
9/20/2026, 2:59:16 PM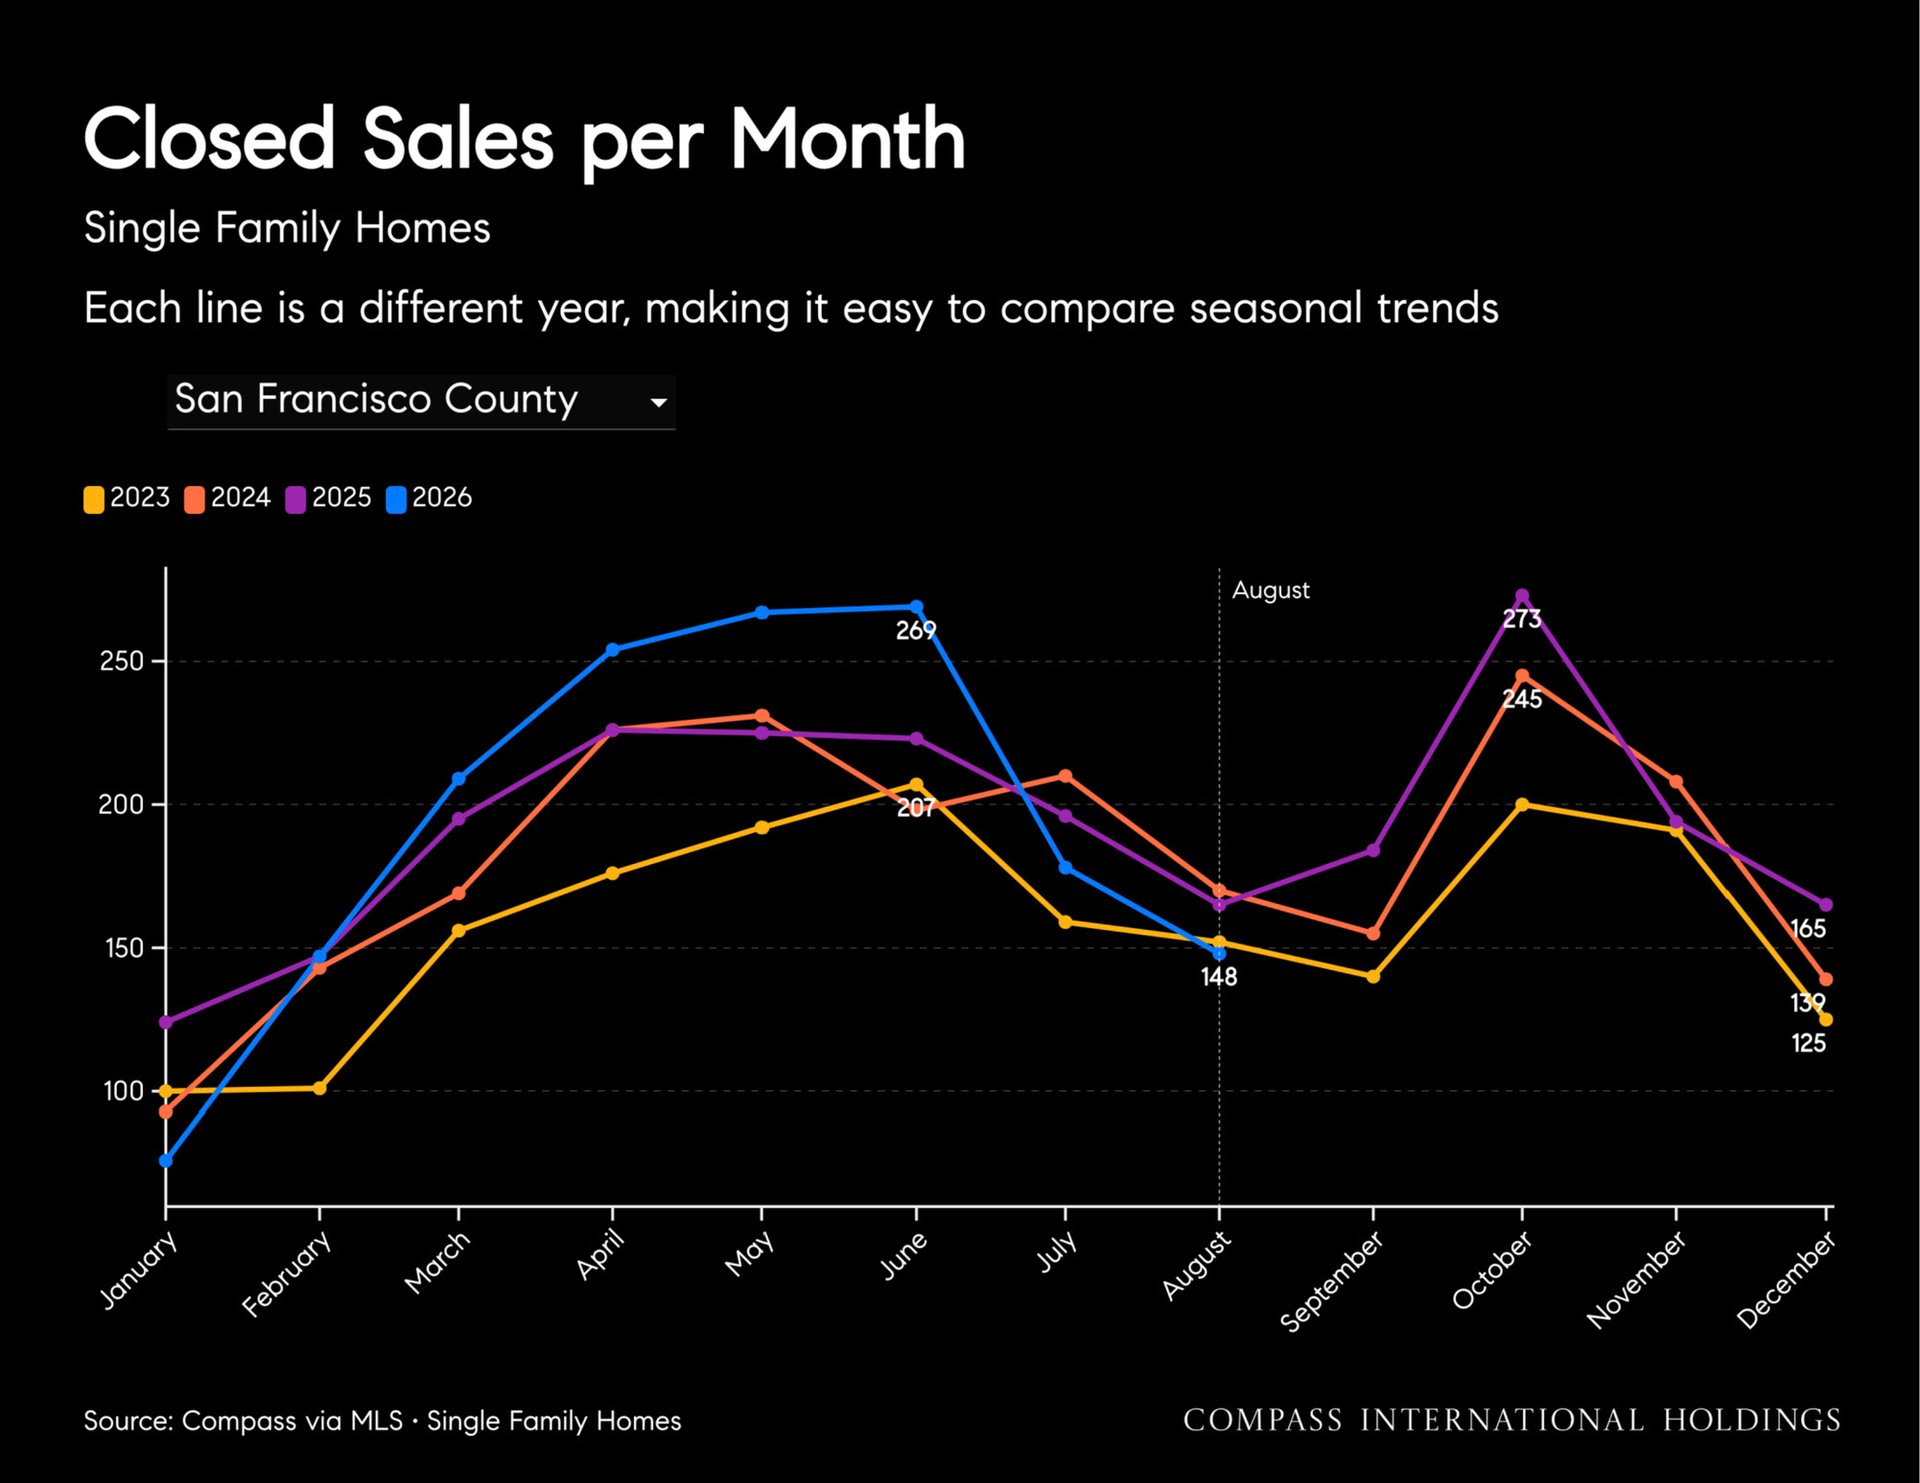
Share:
Blog
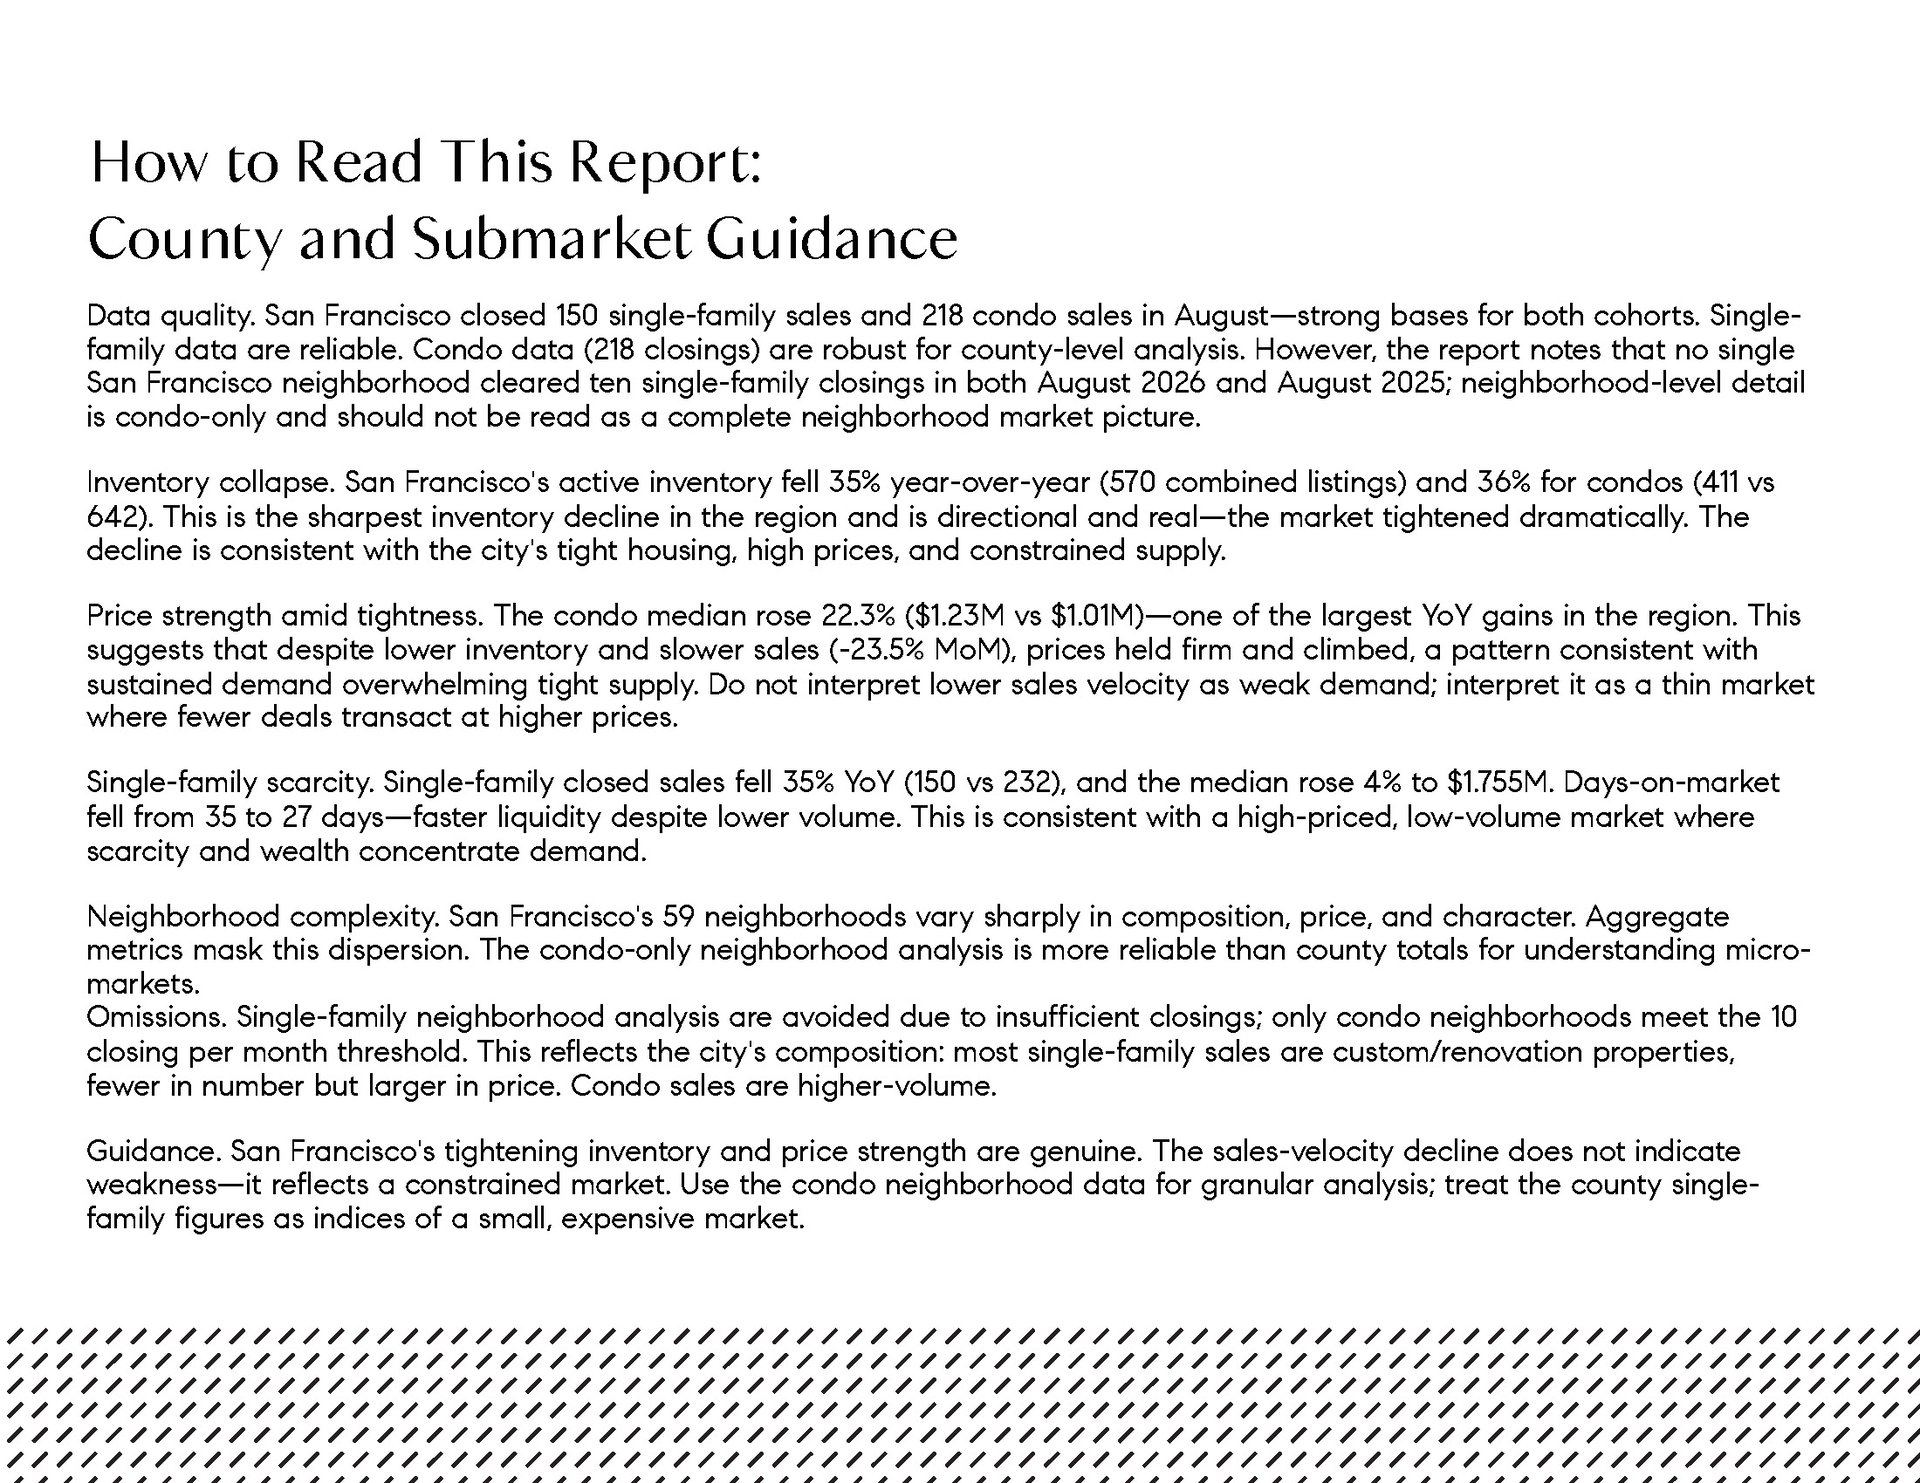
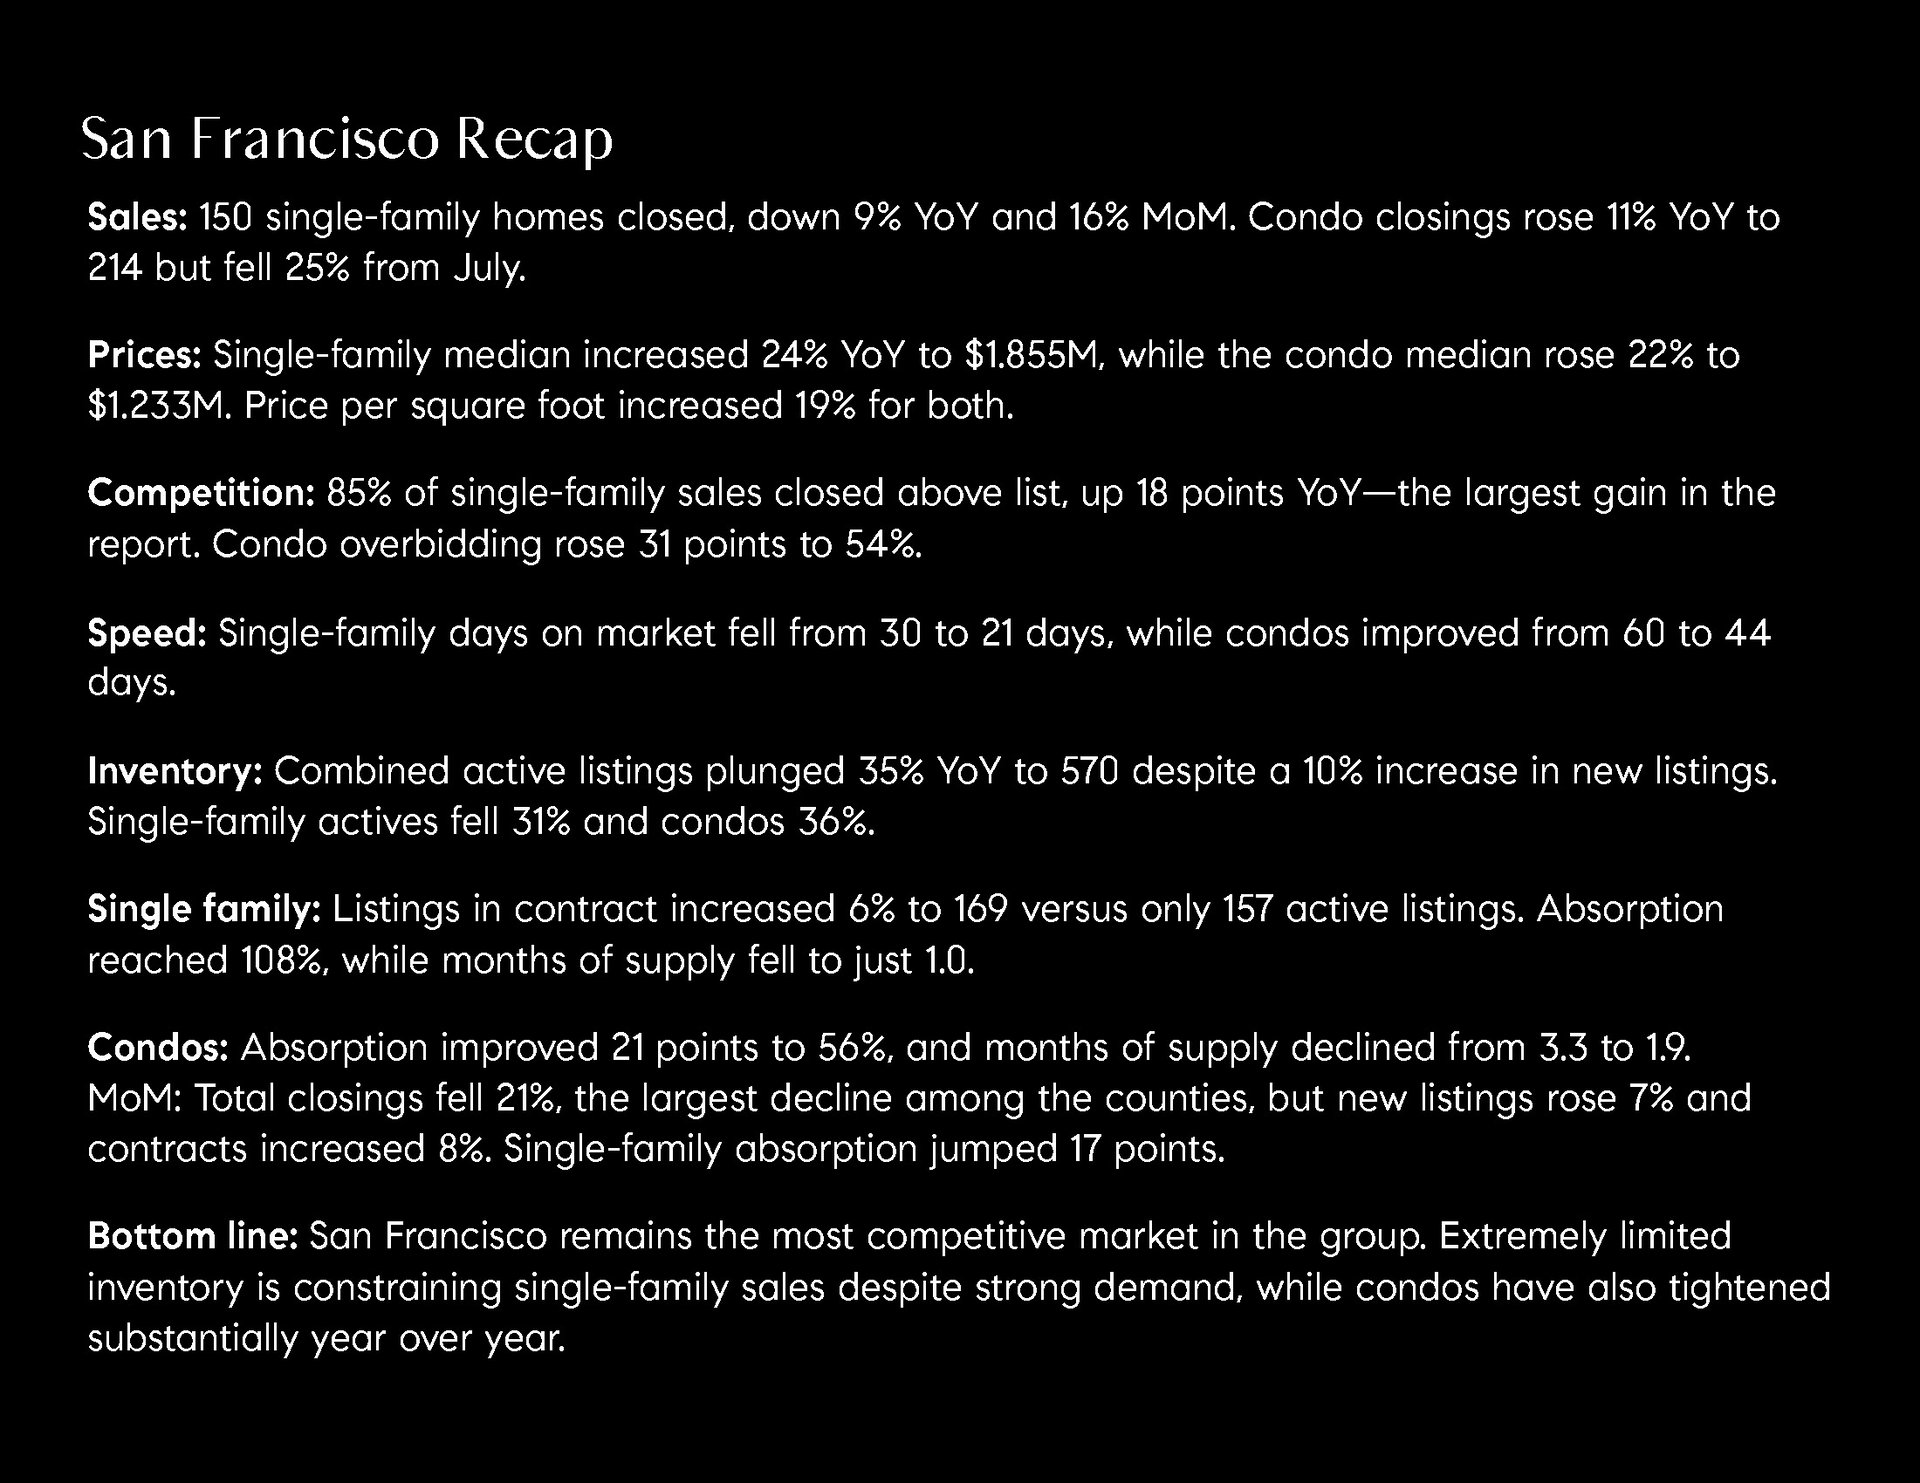
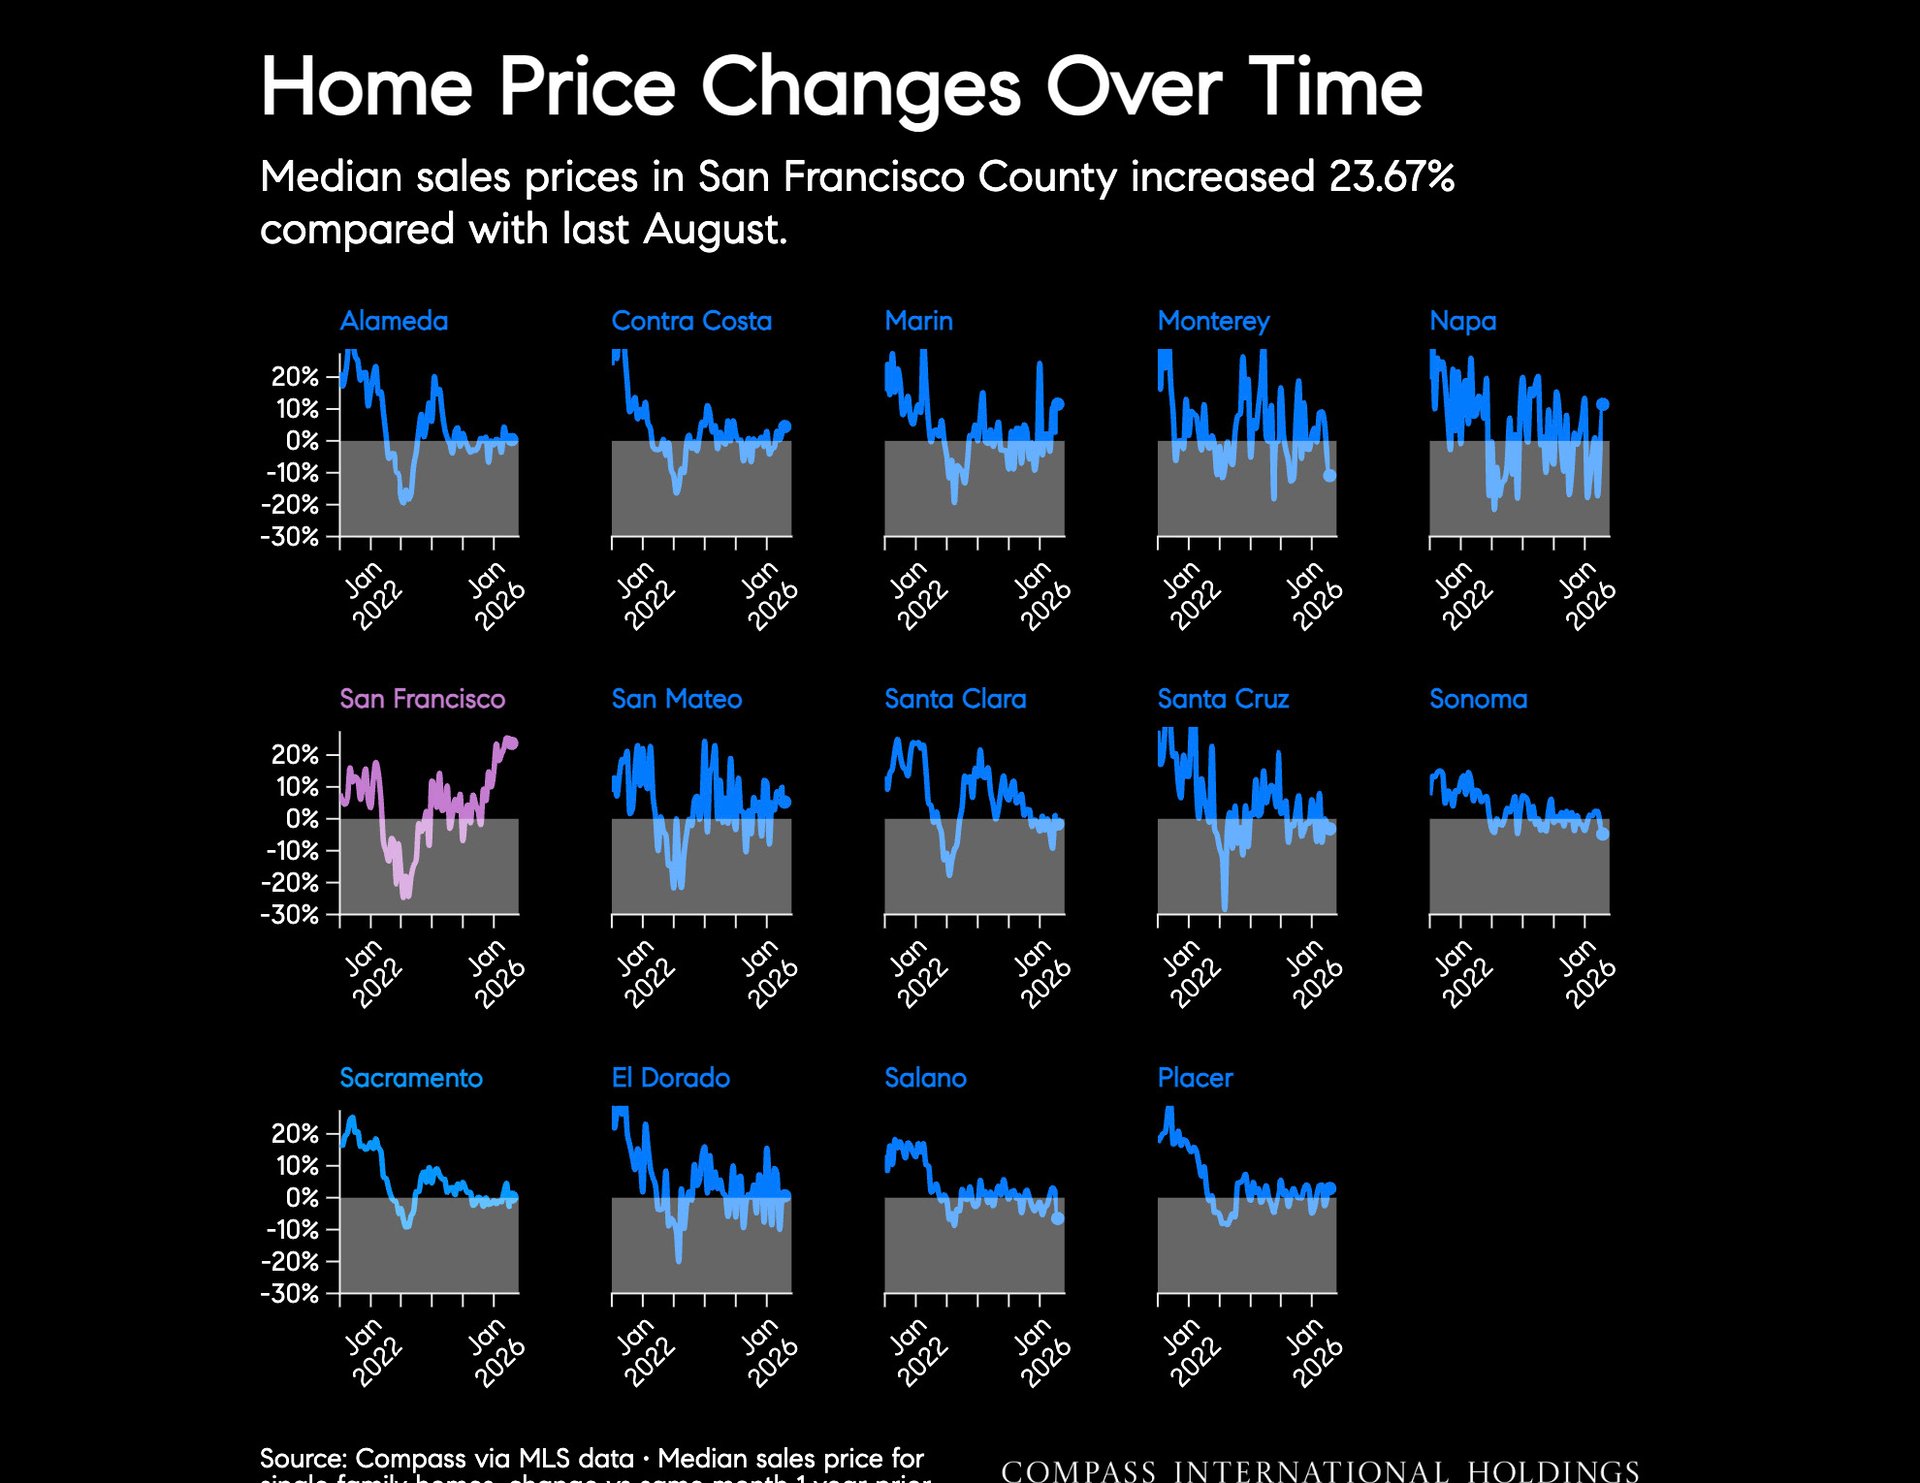
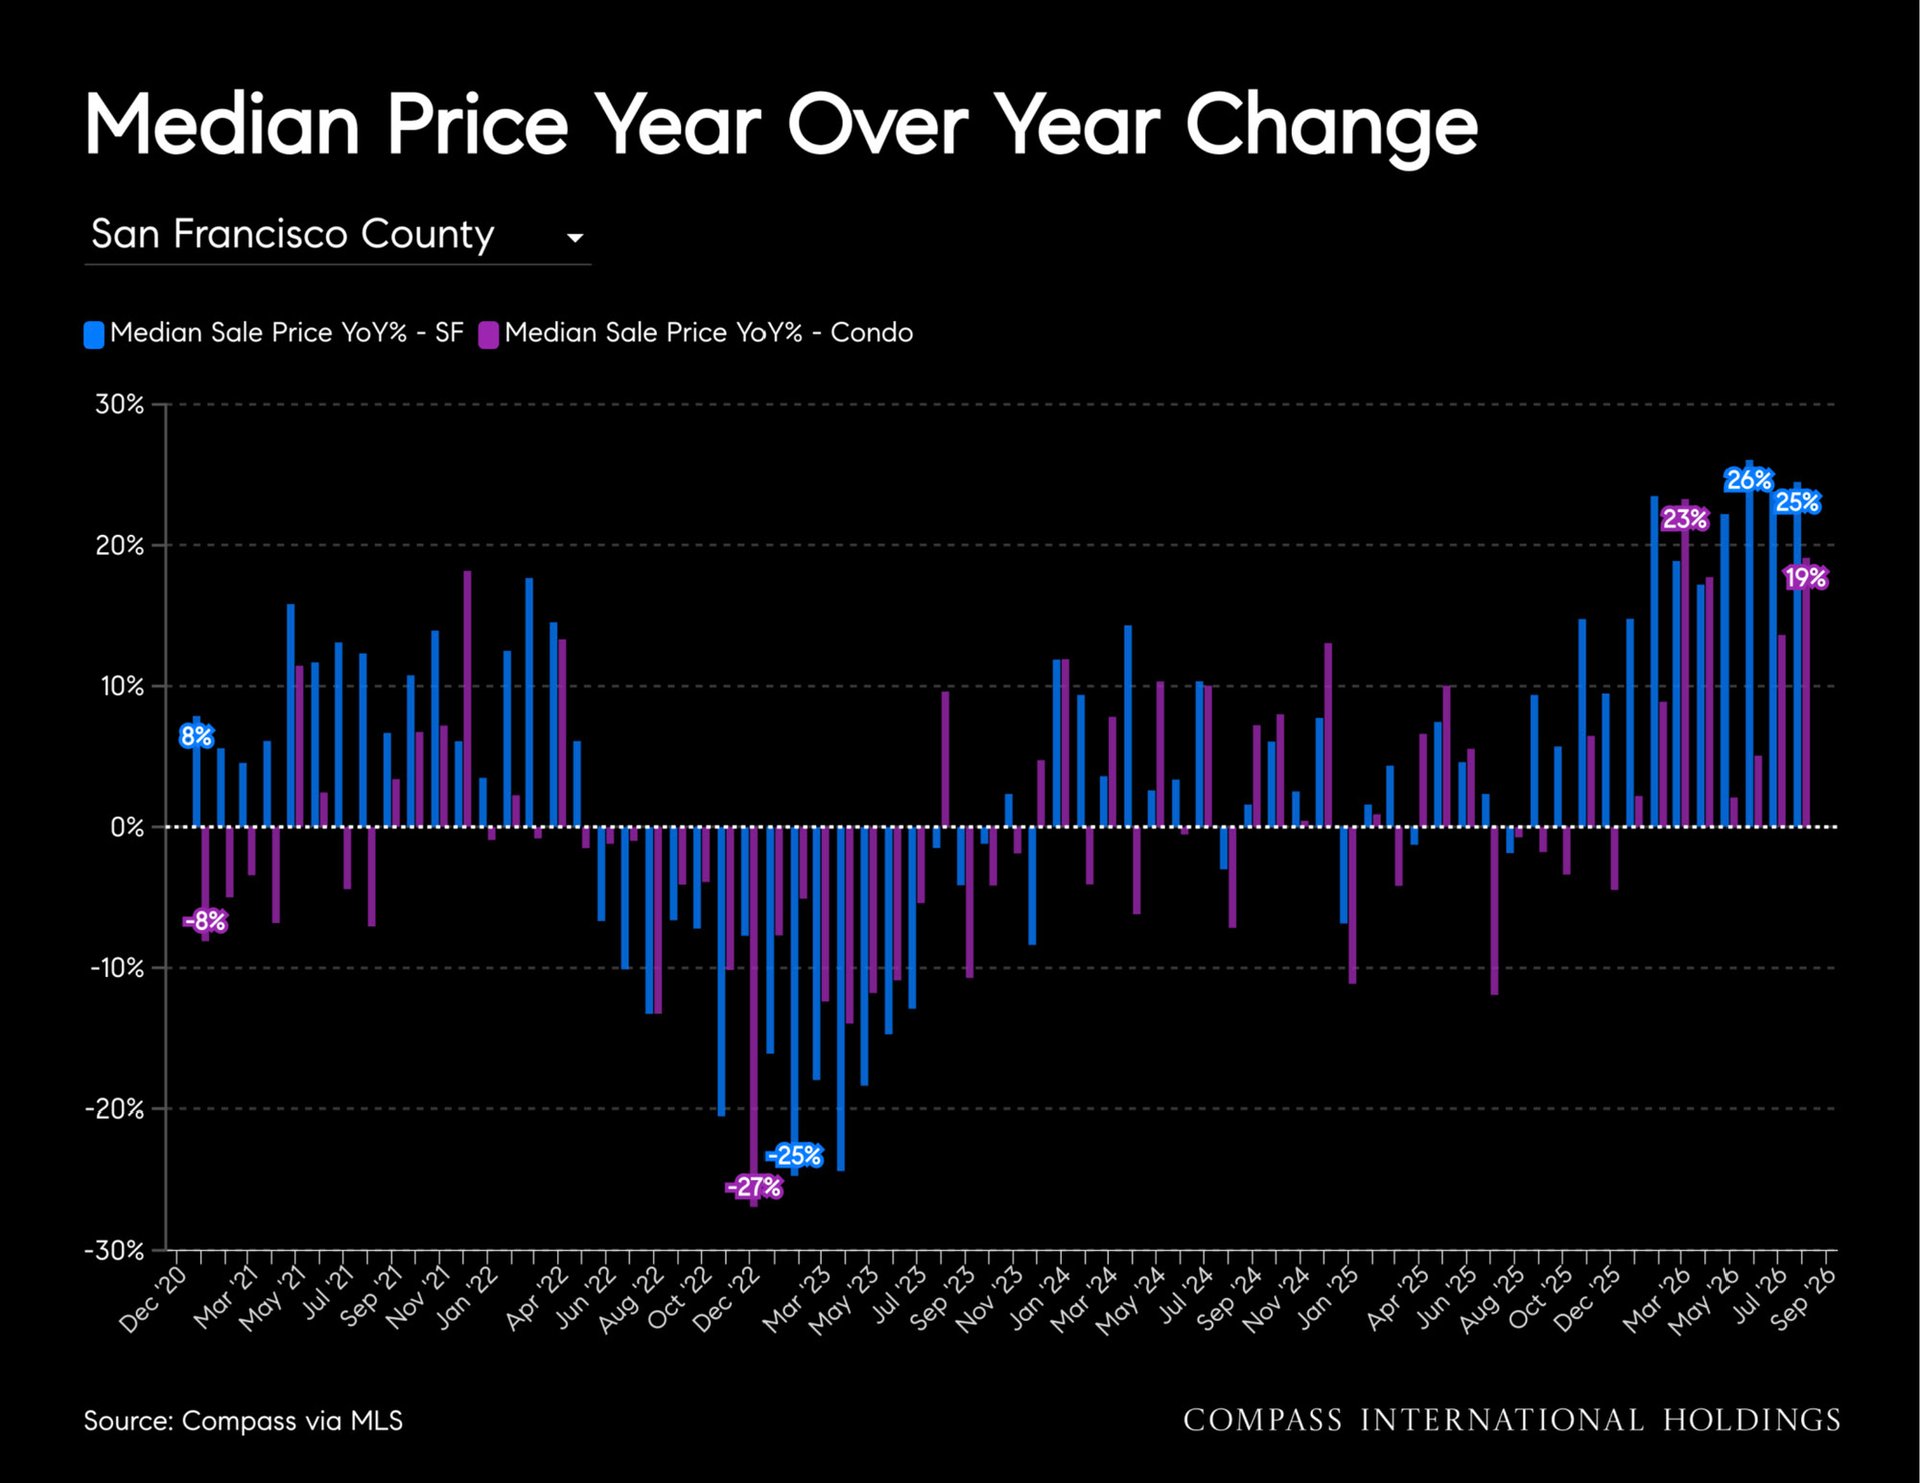
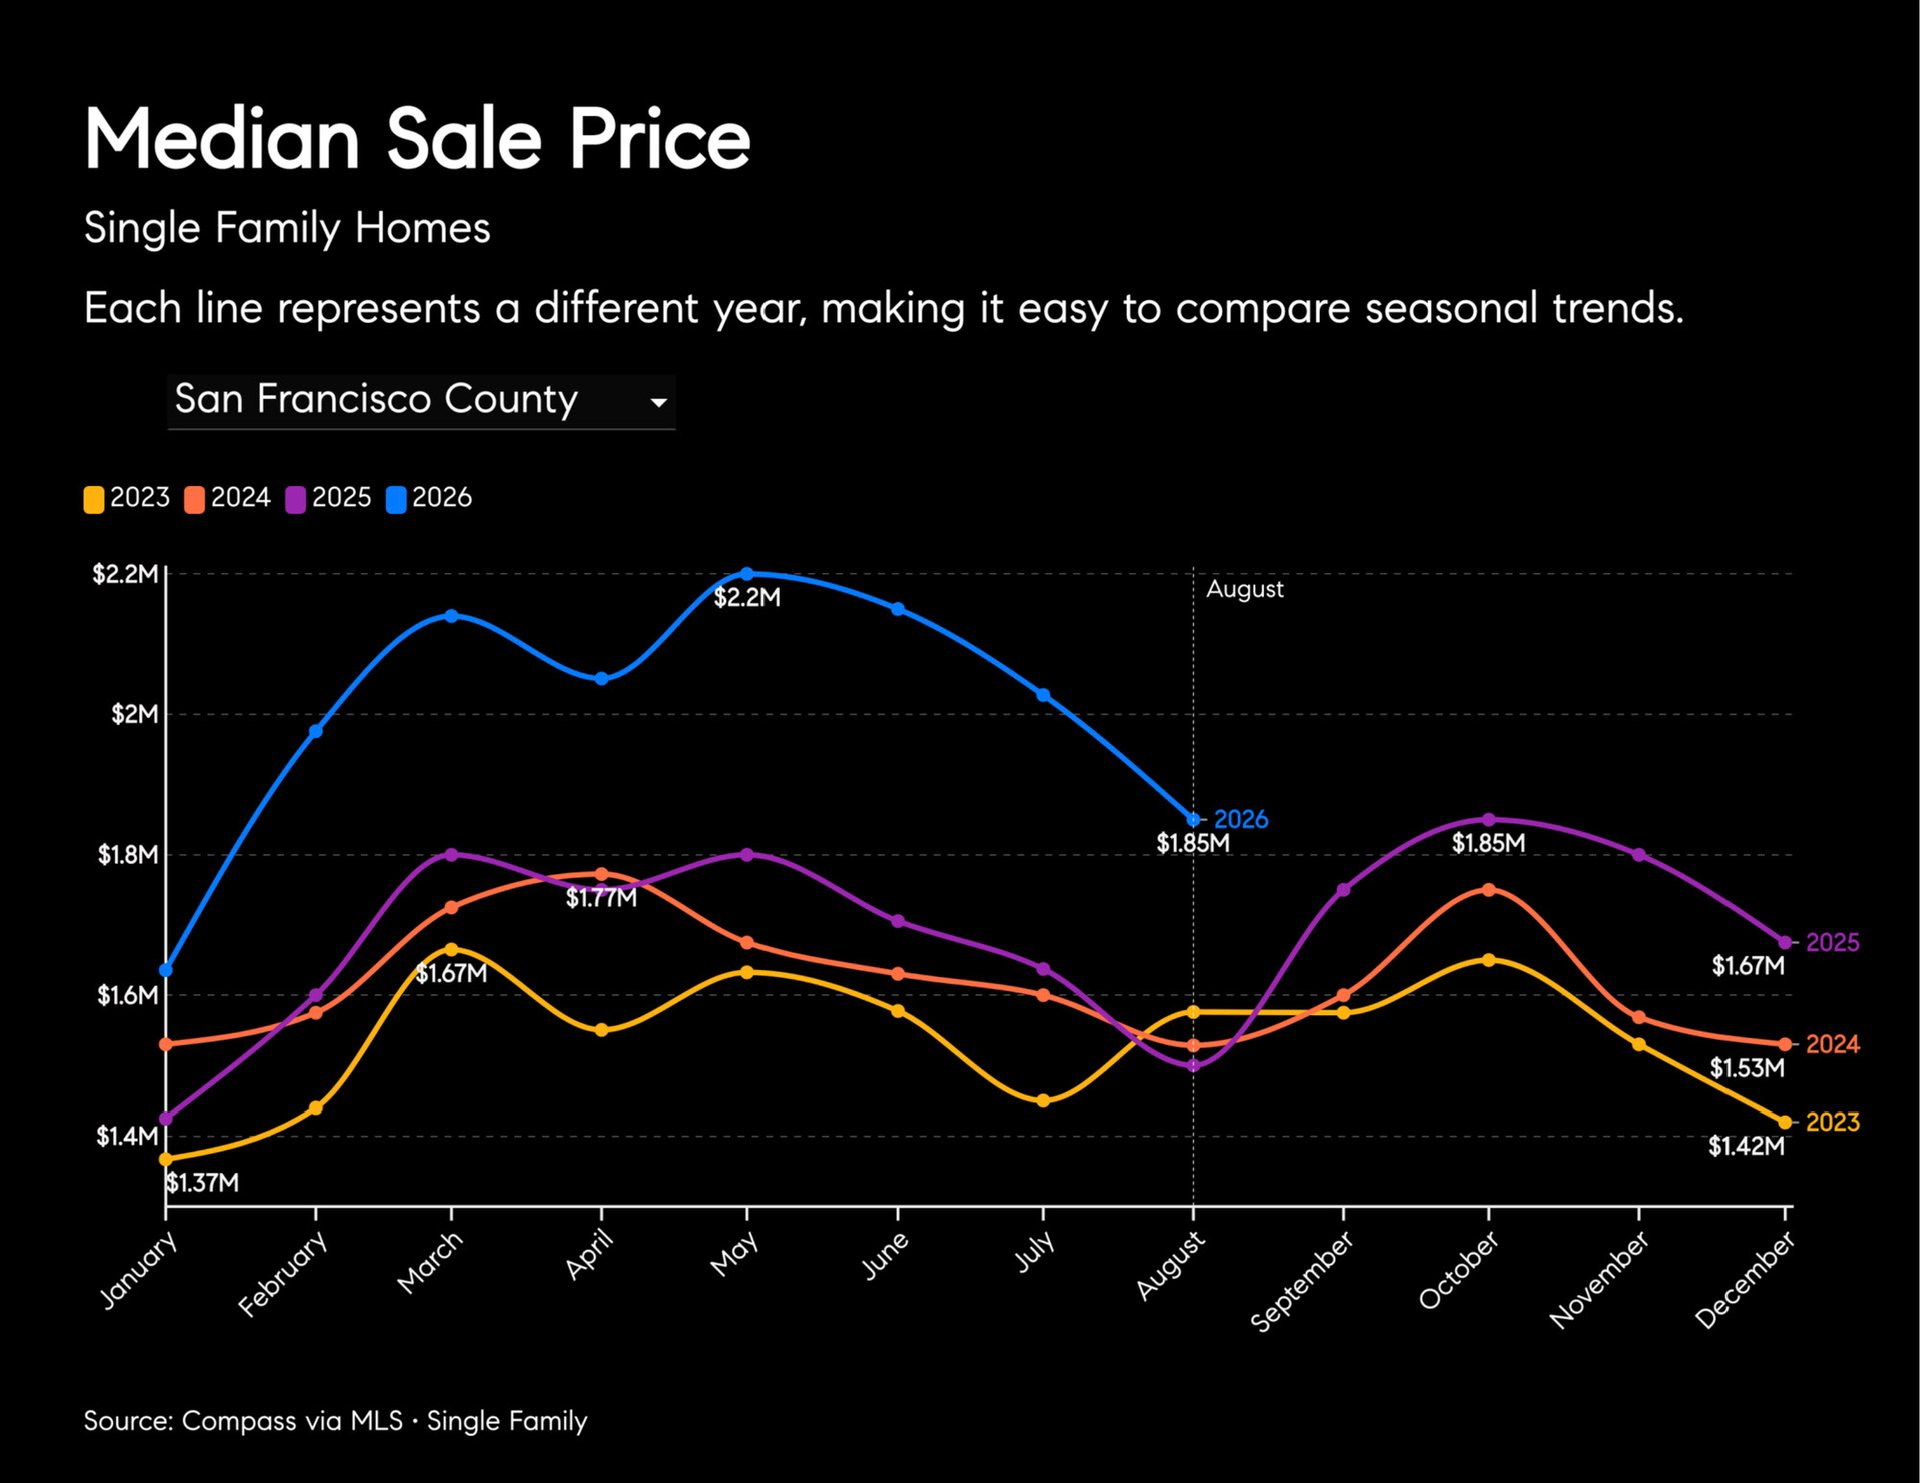
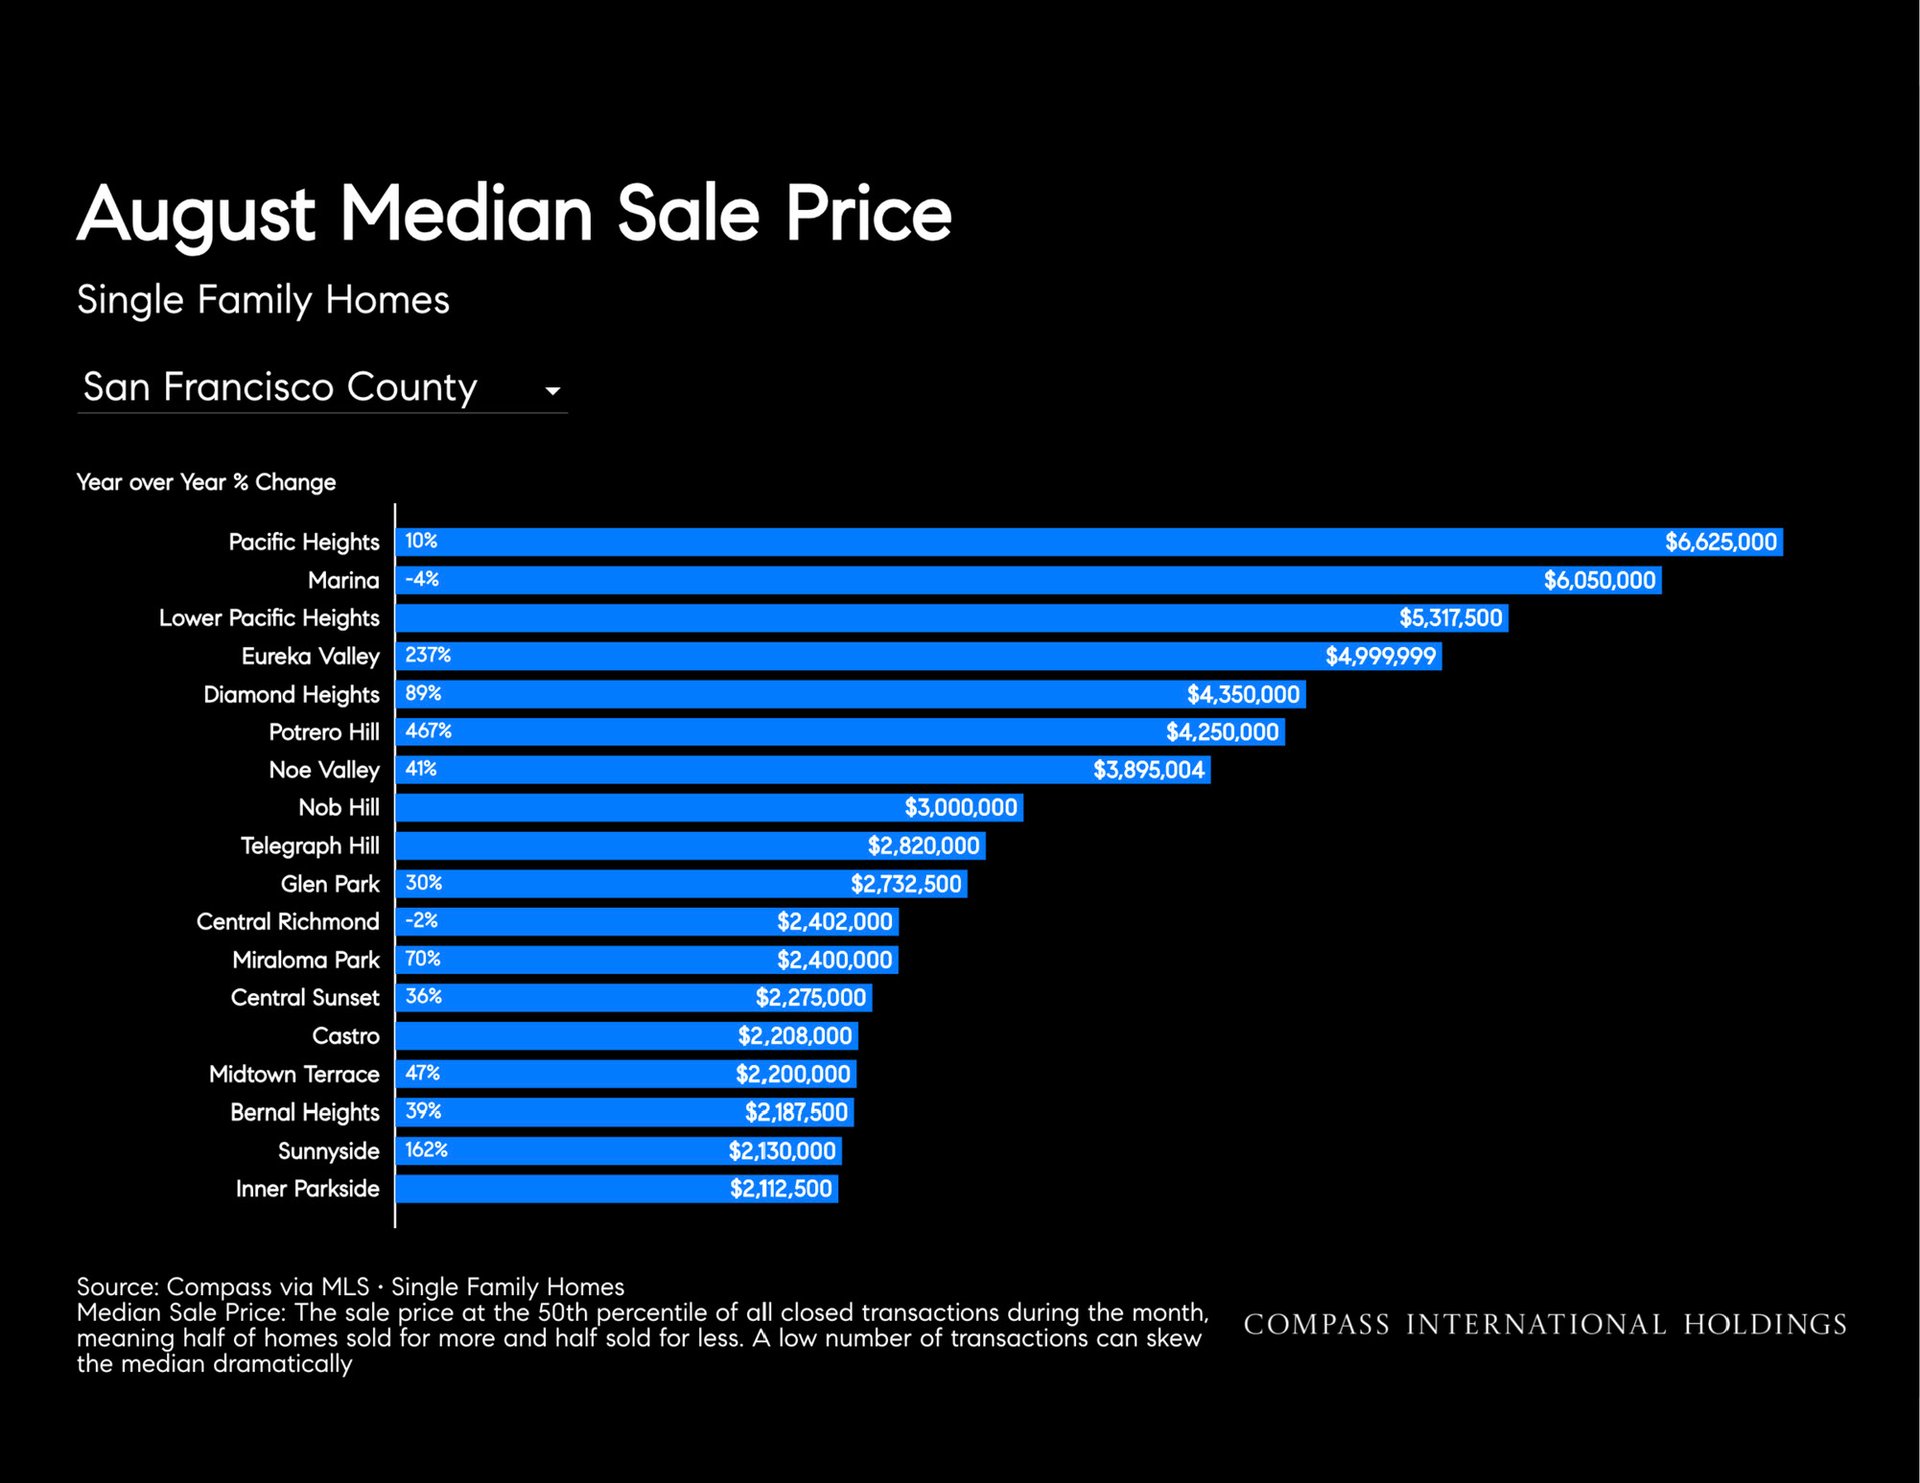
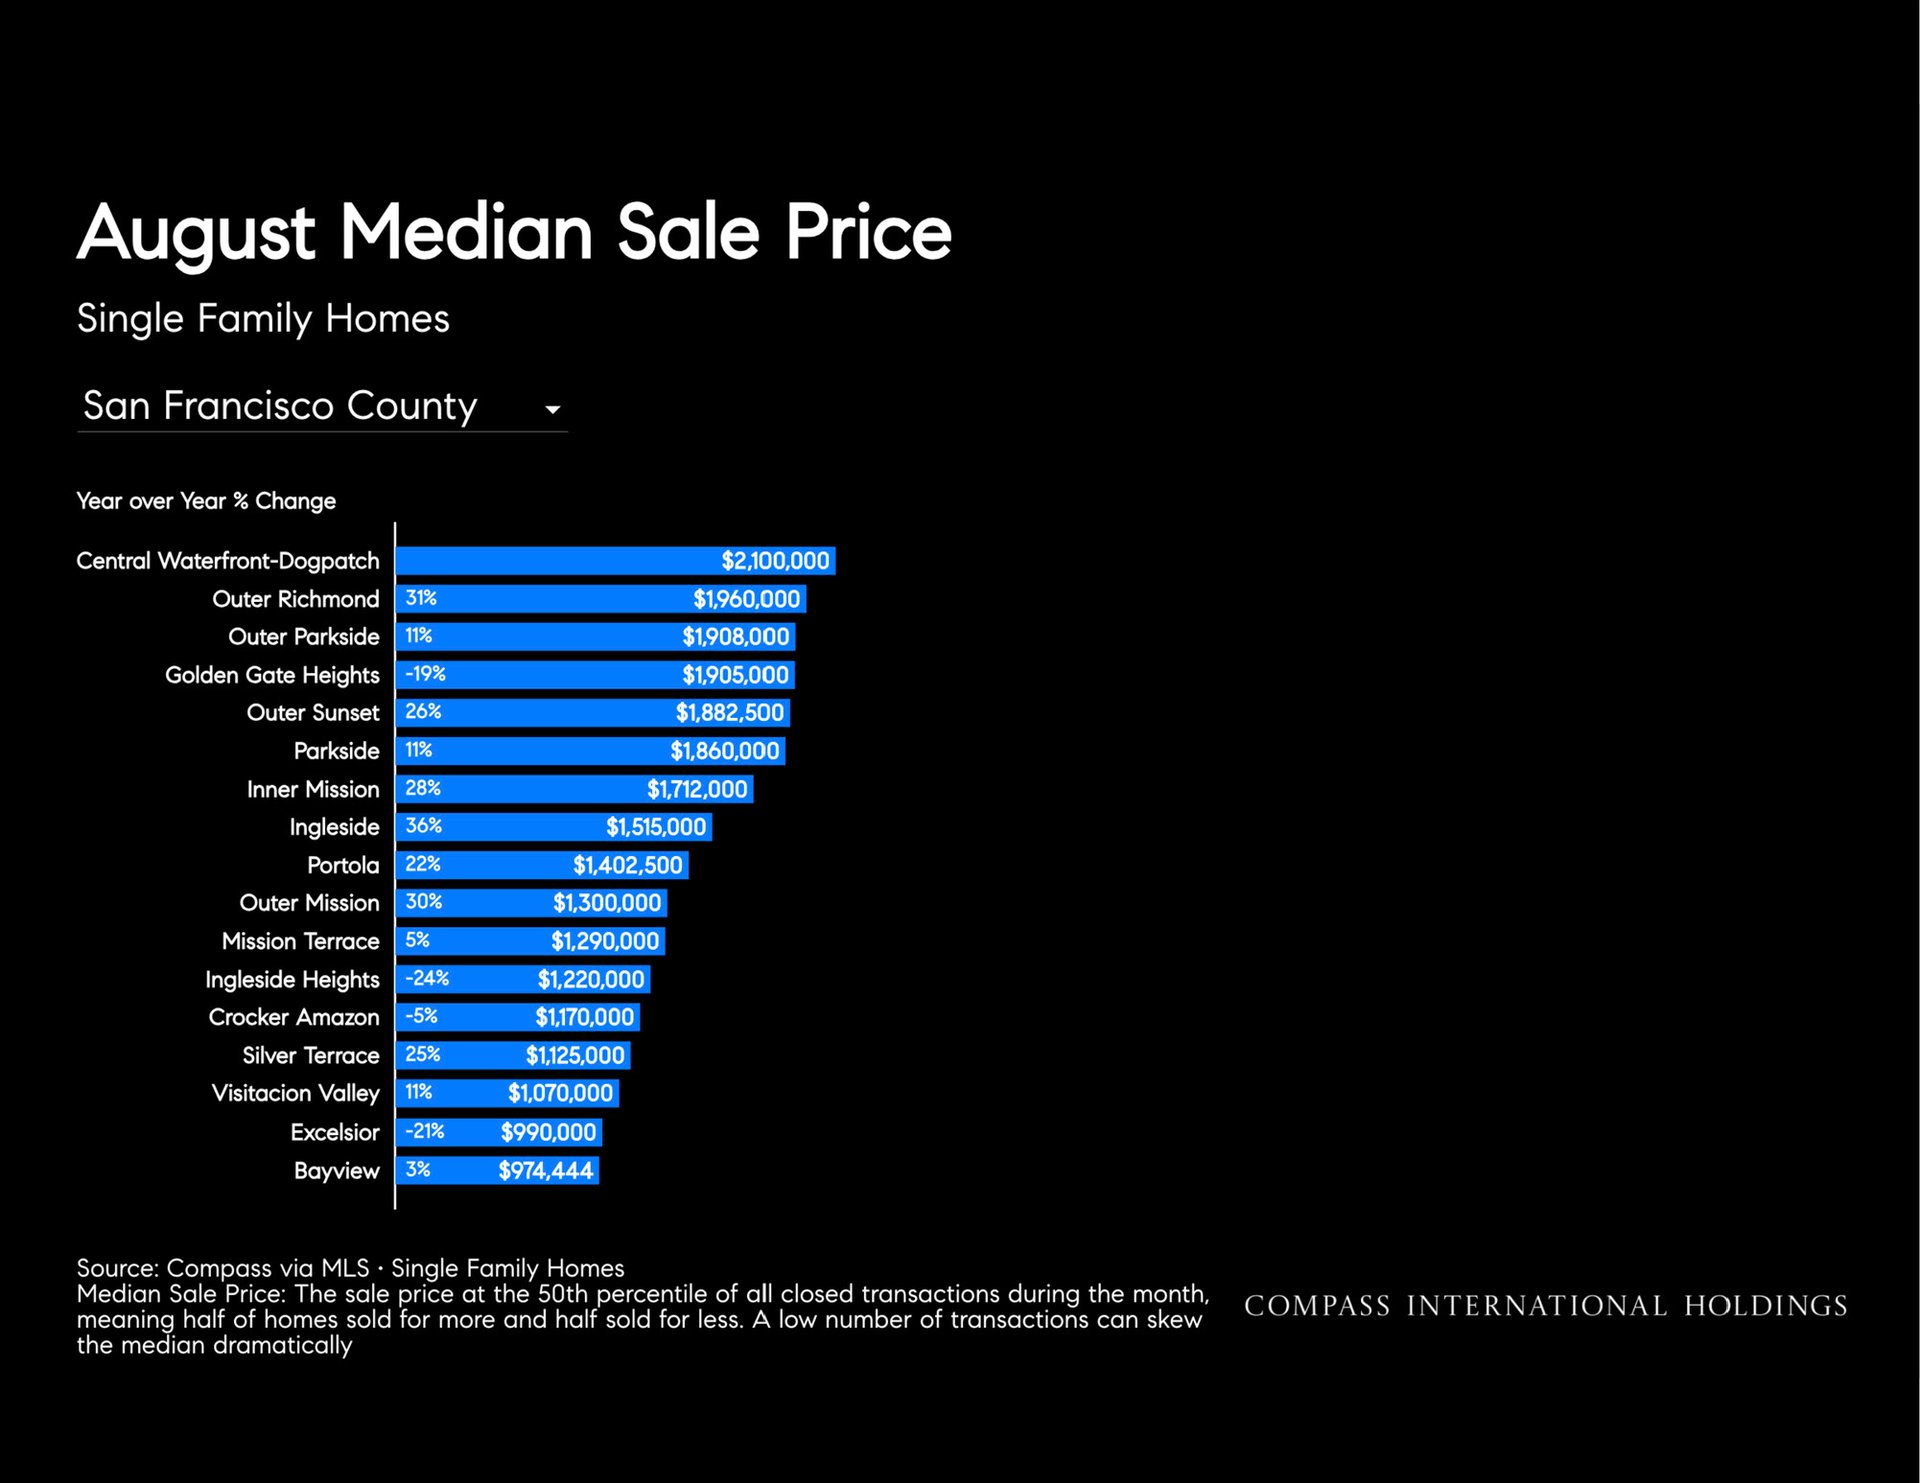
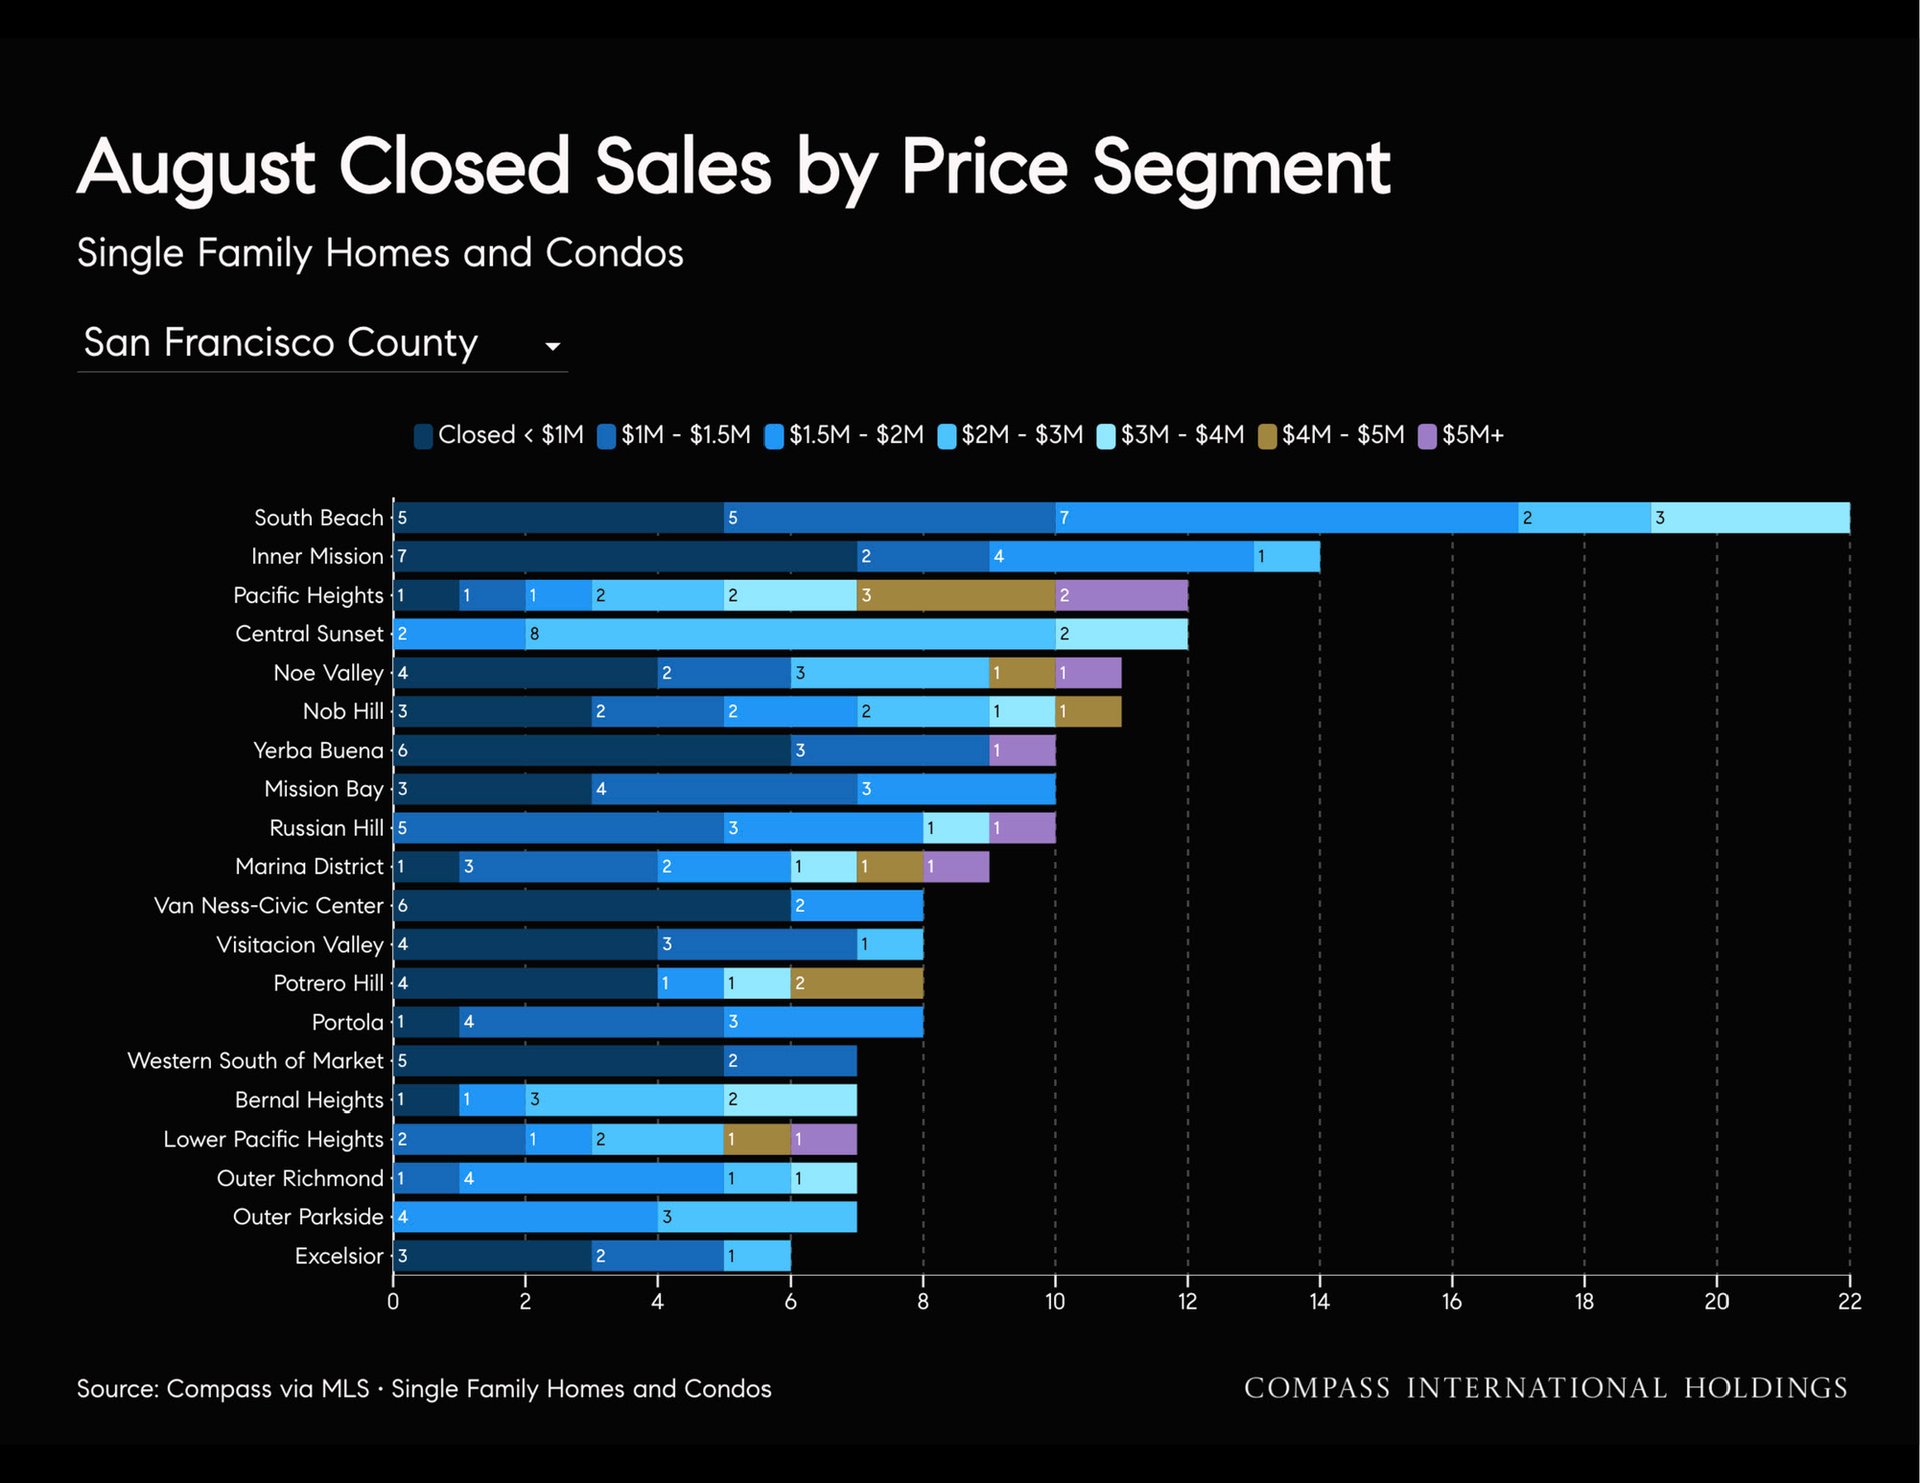
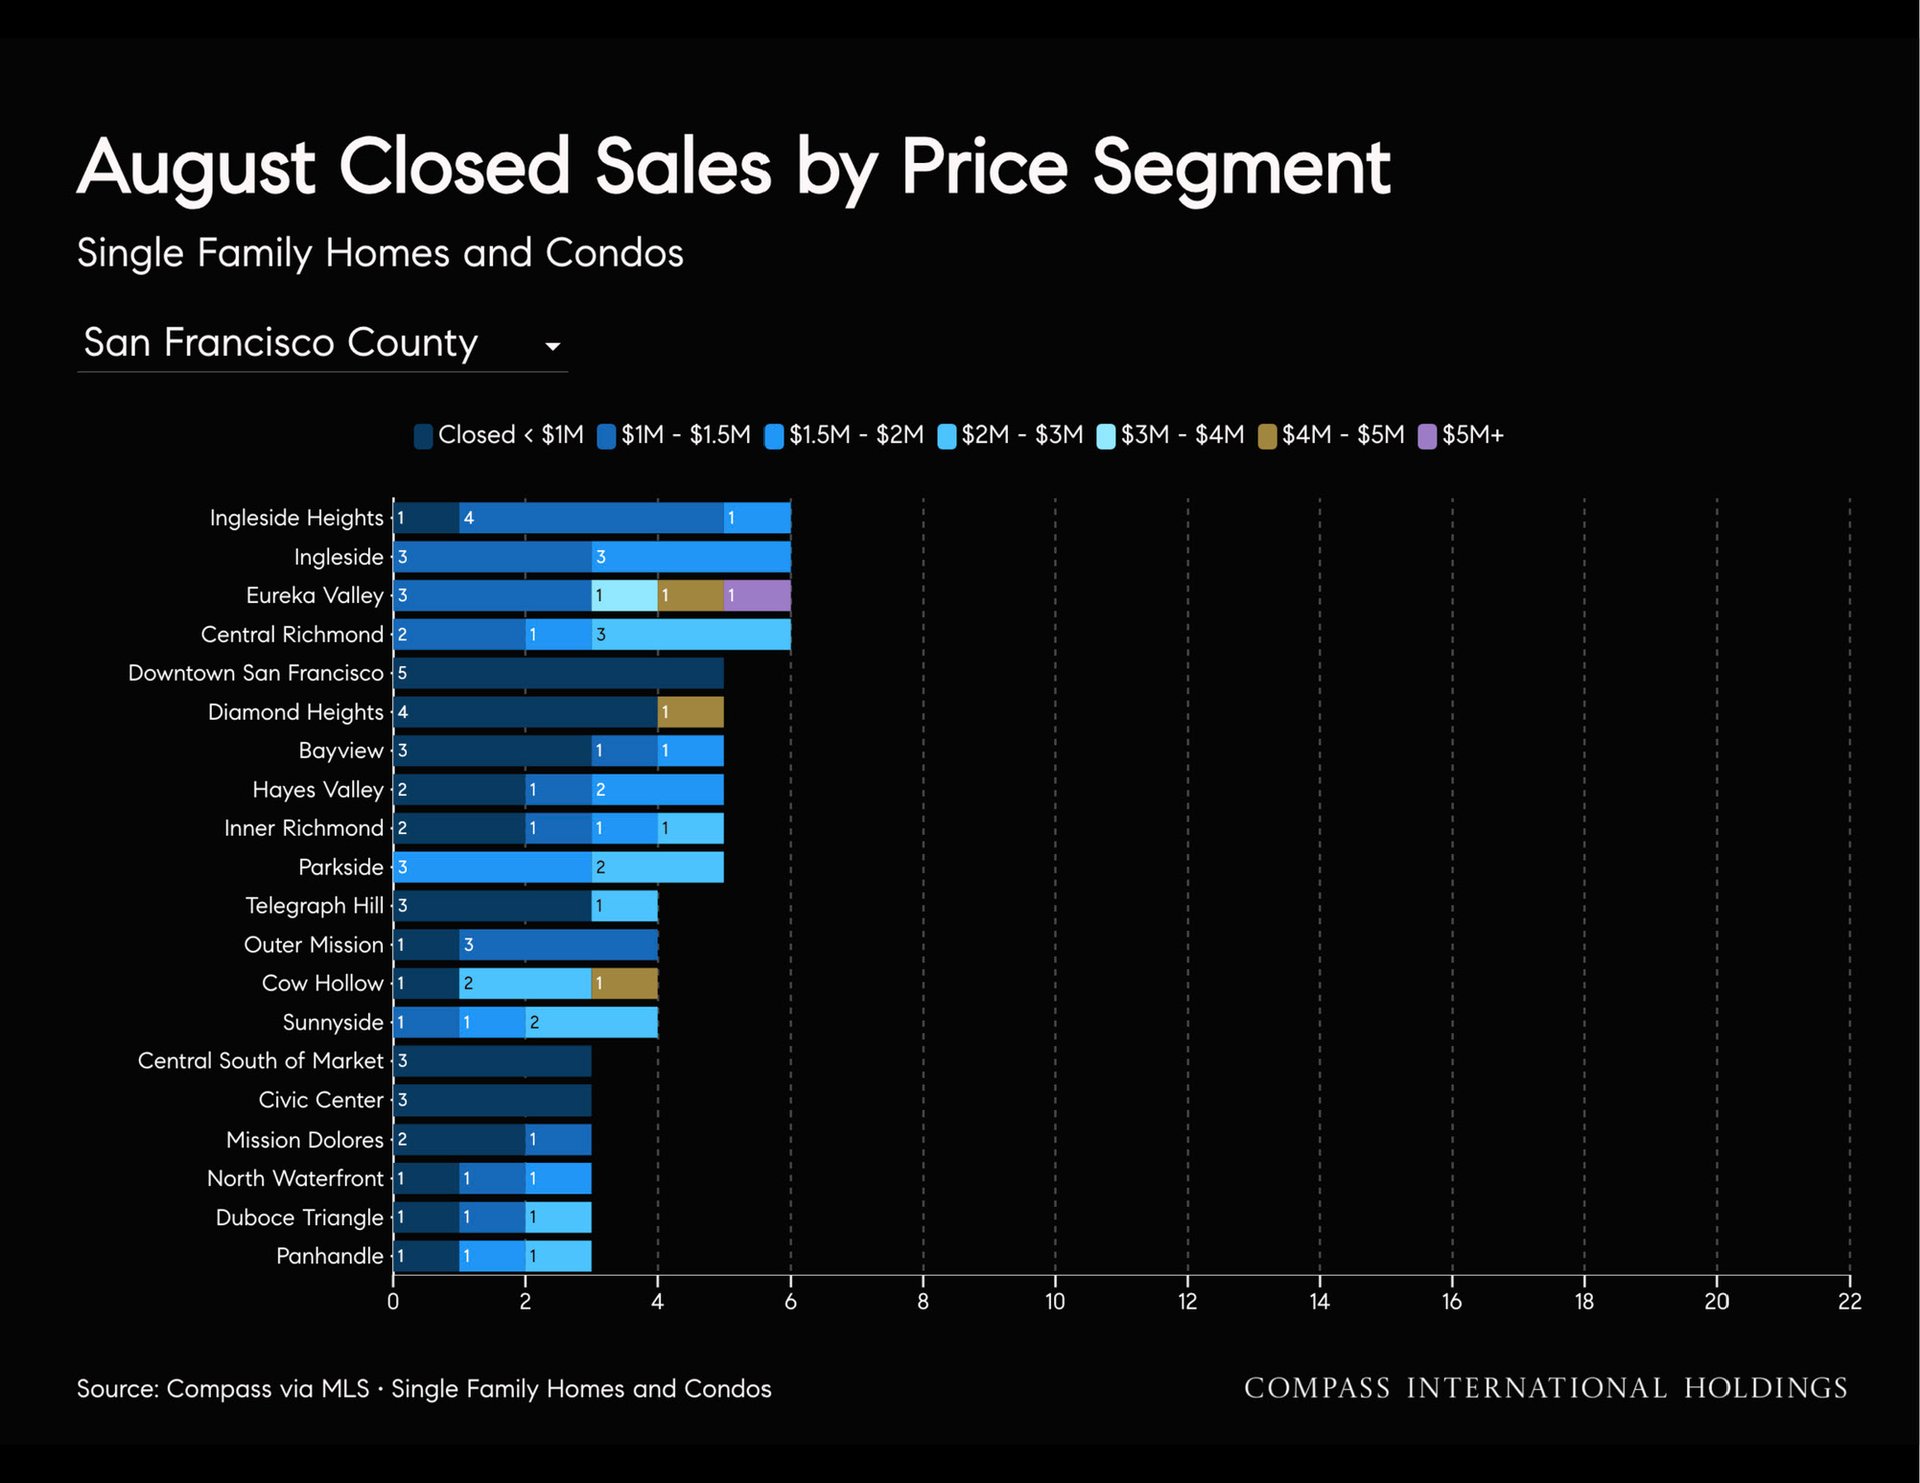
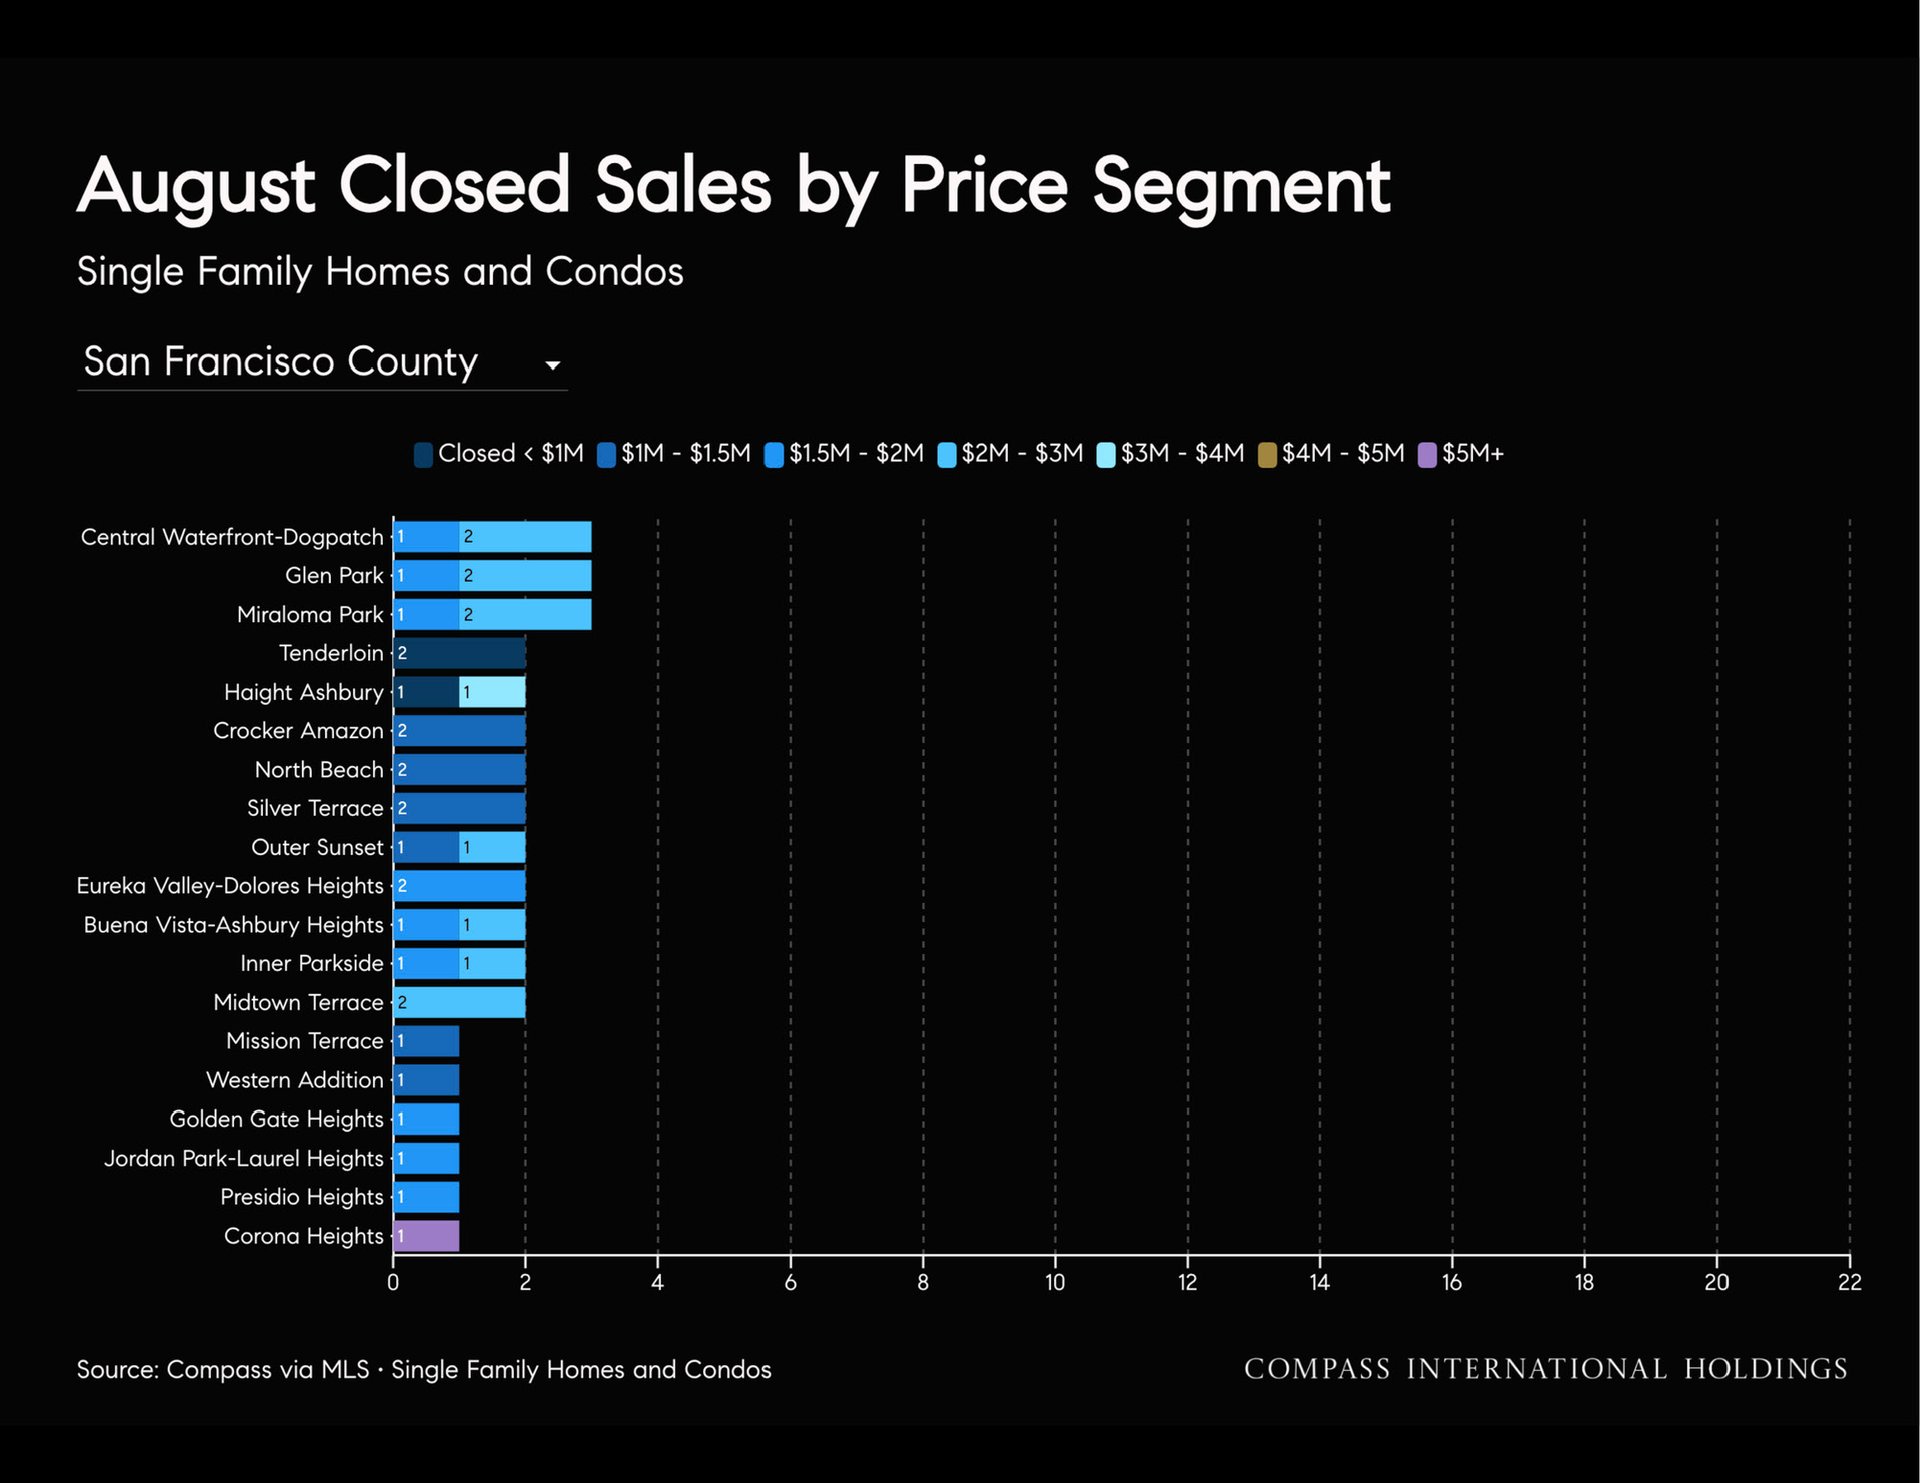
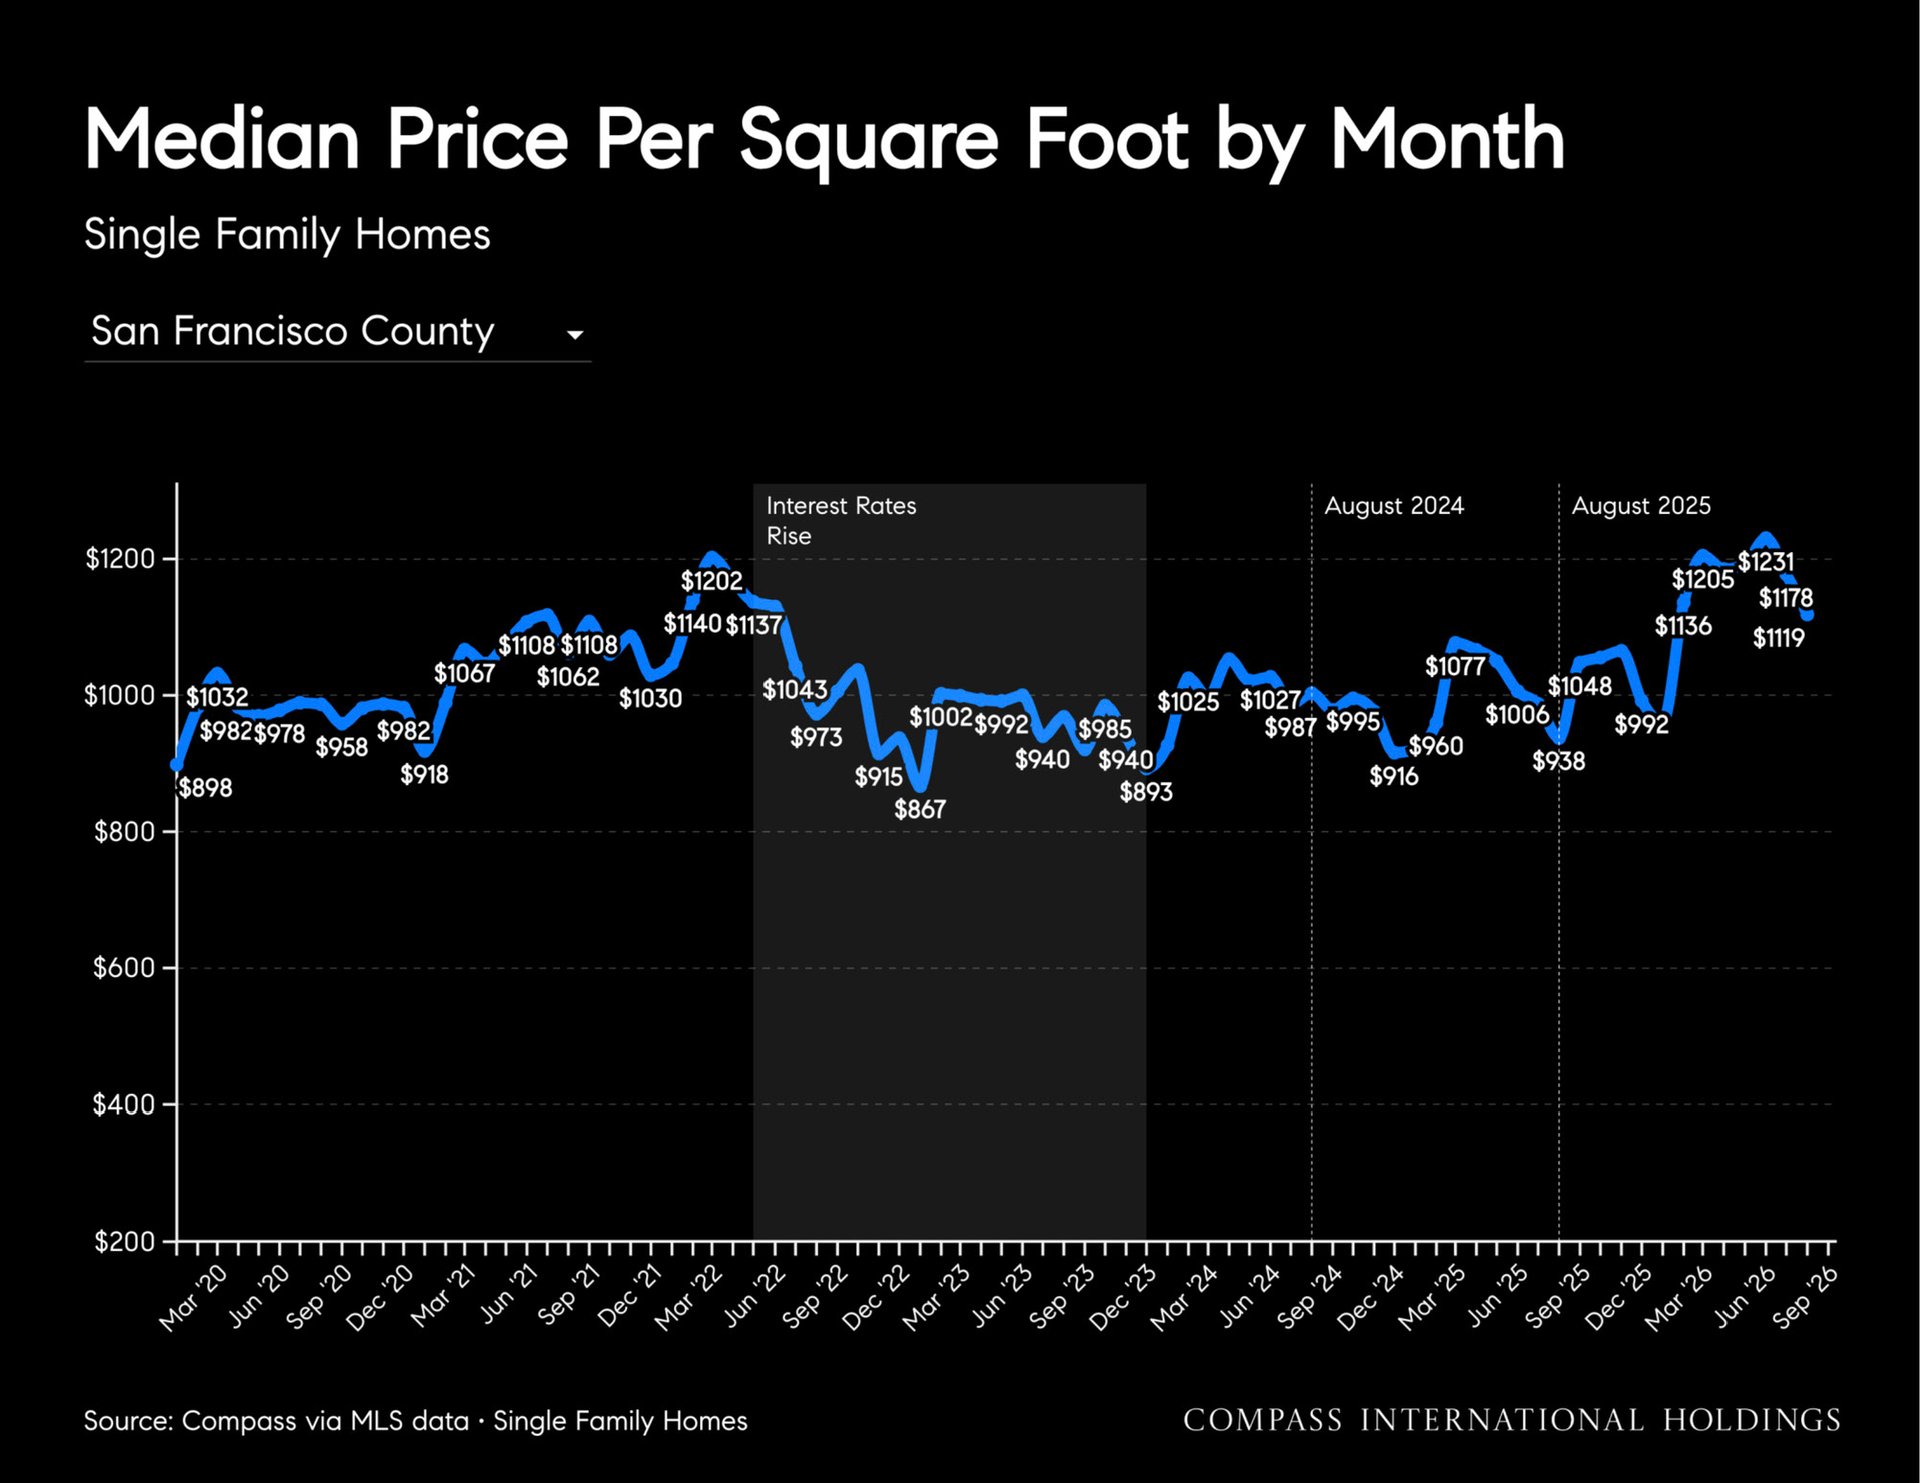
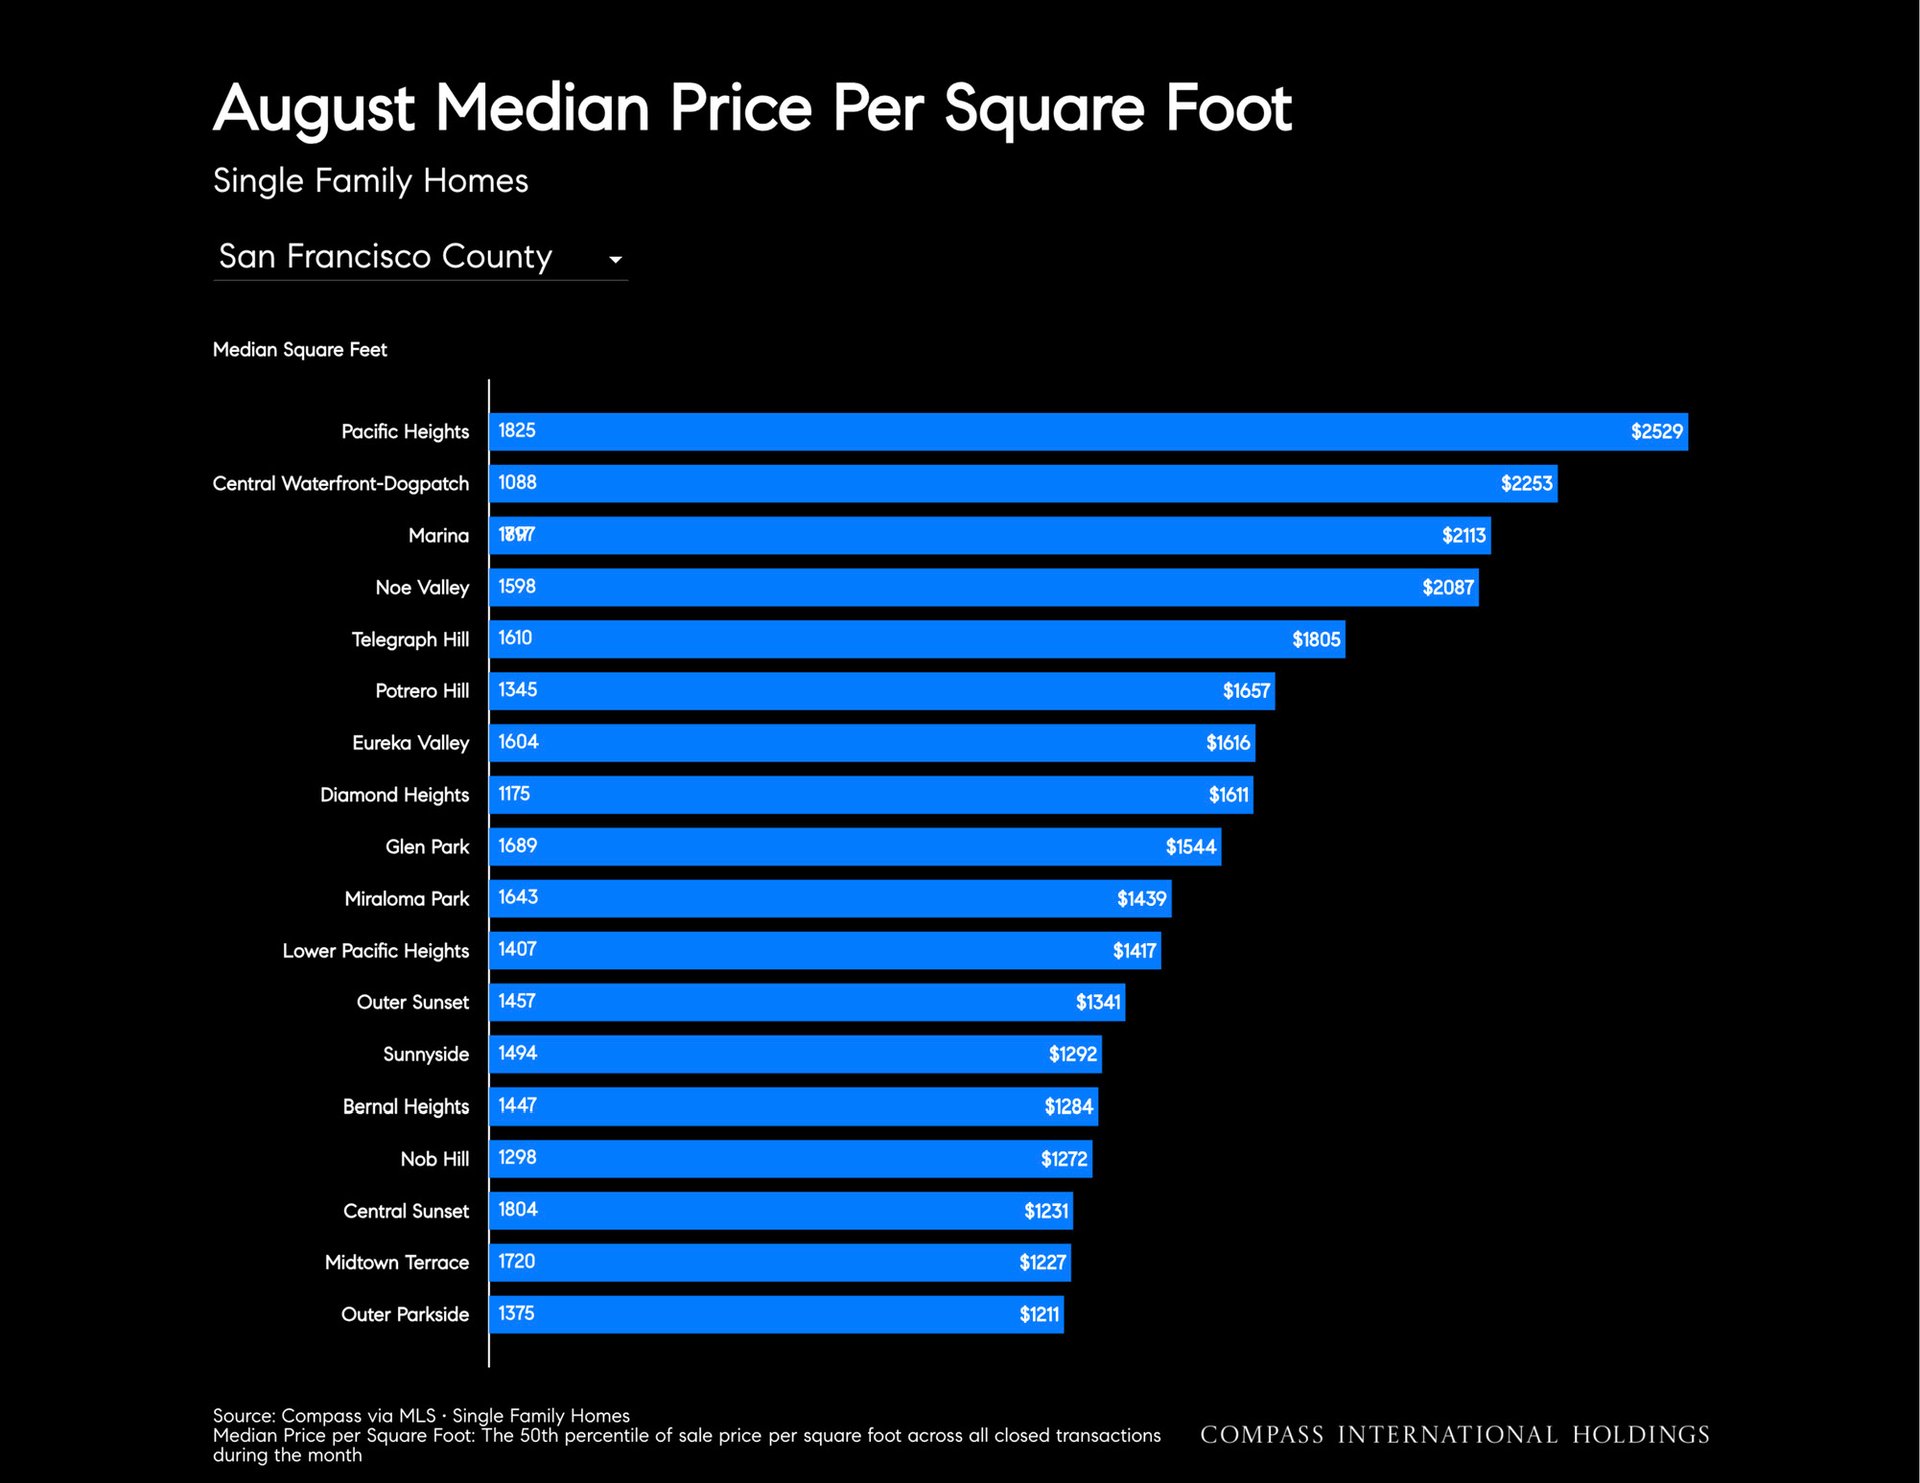
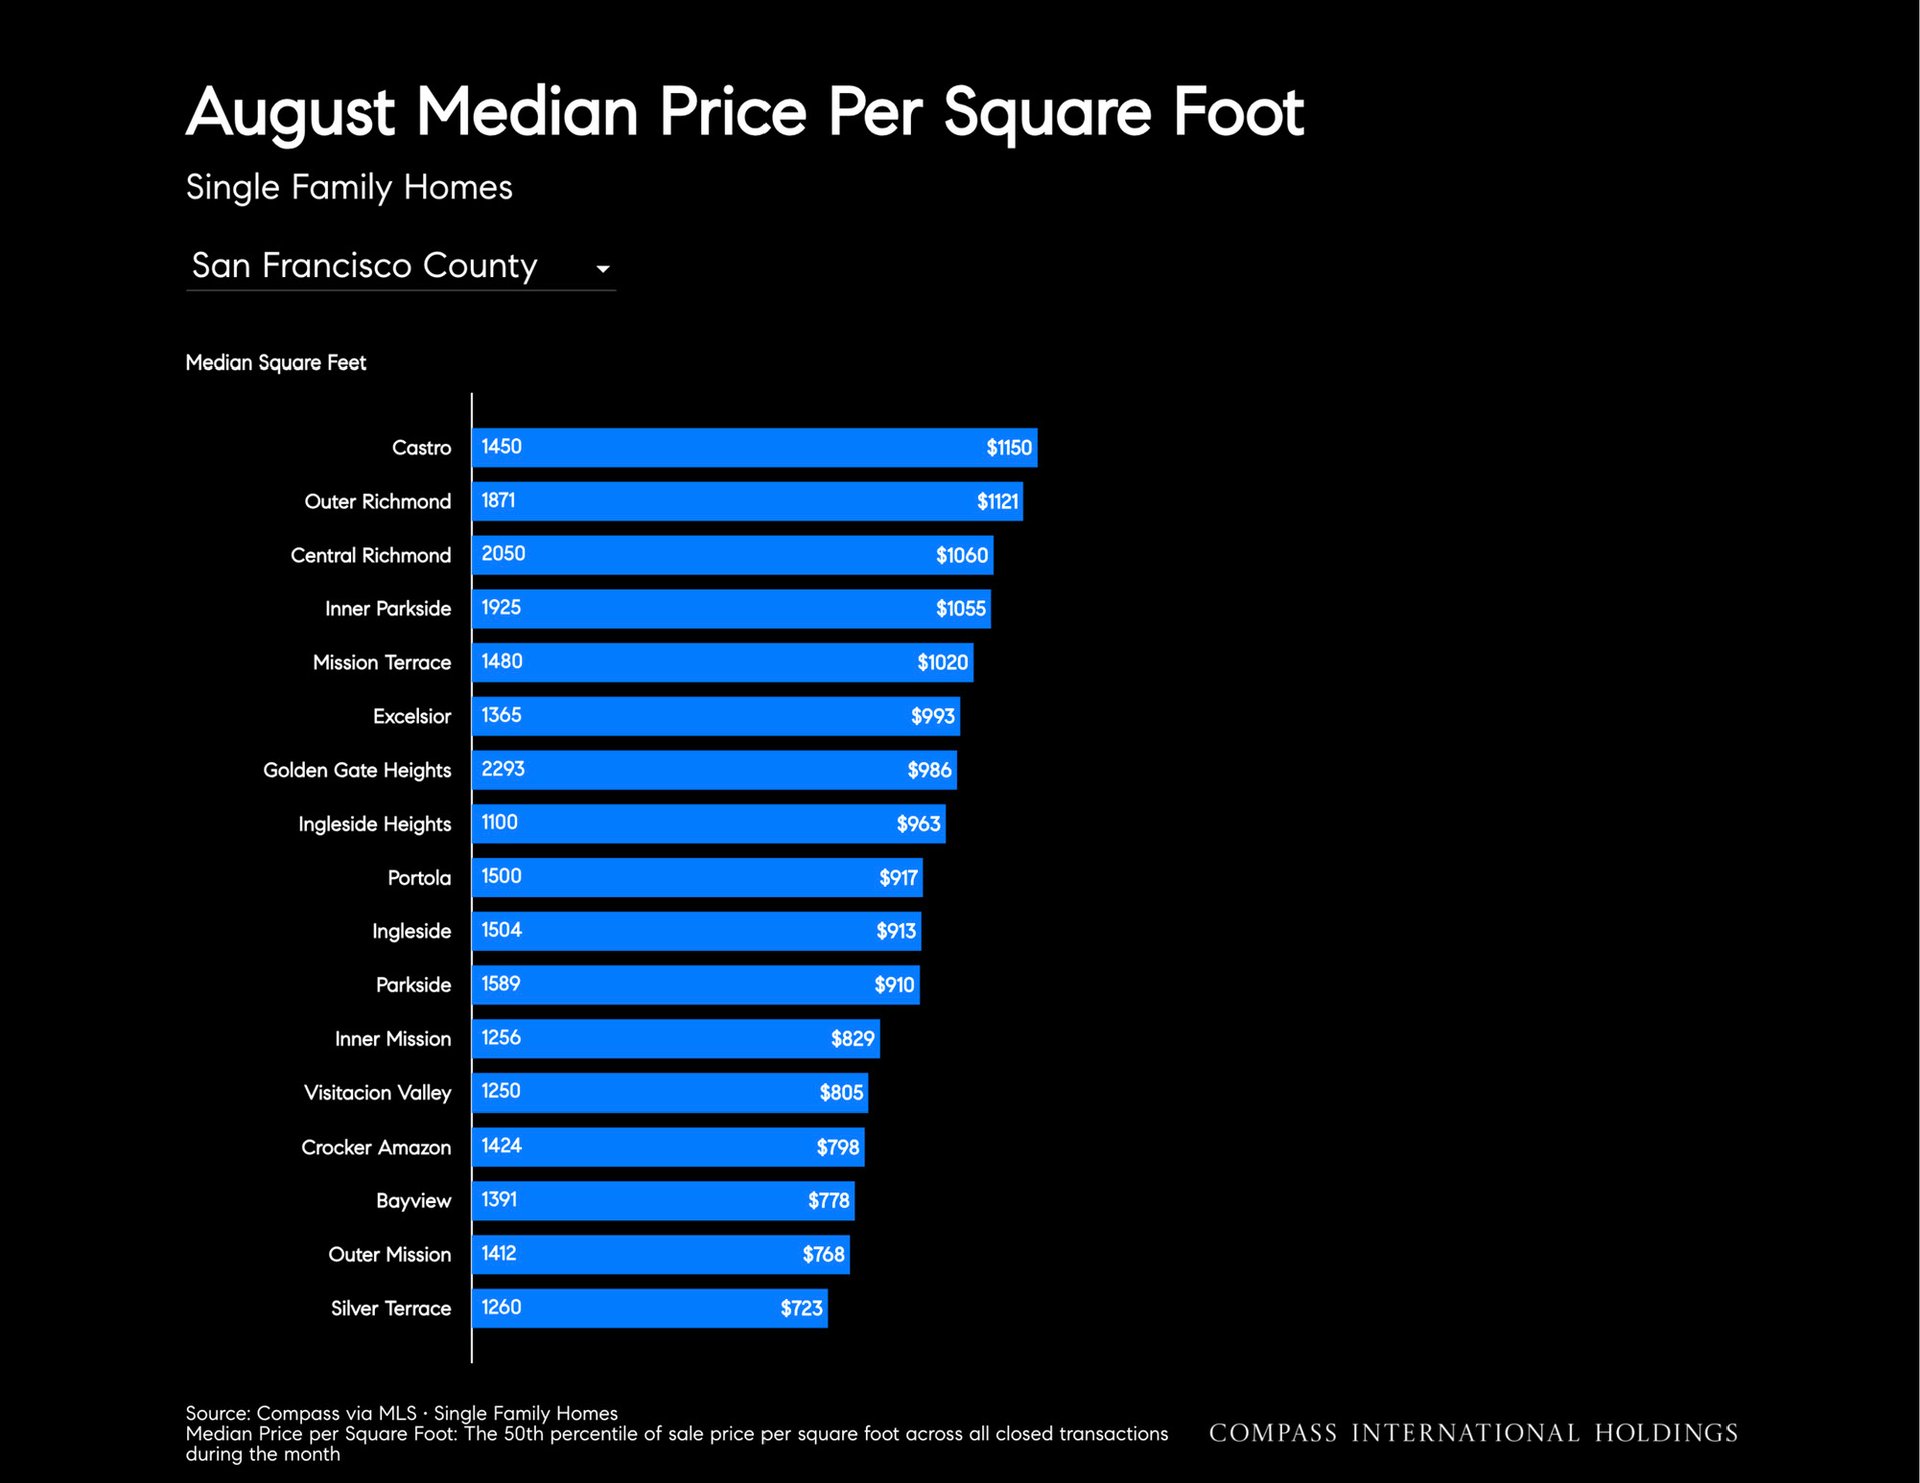
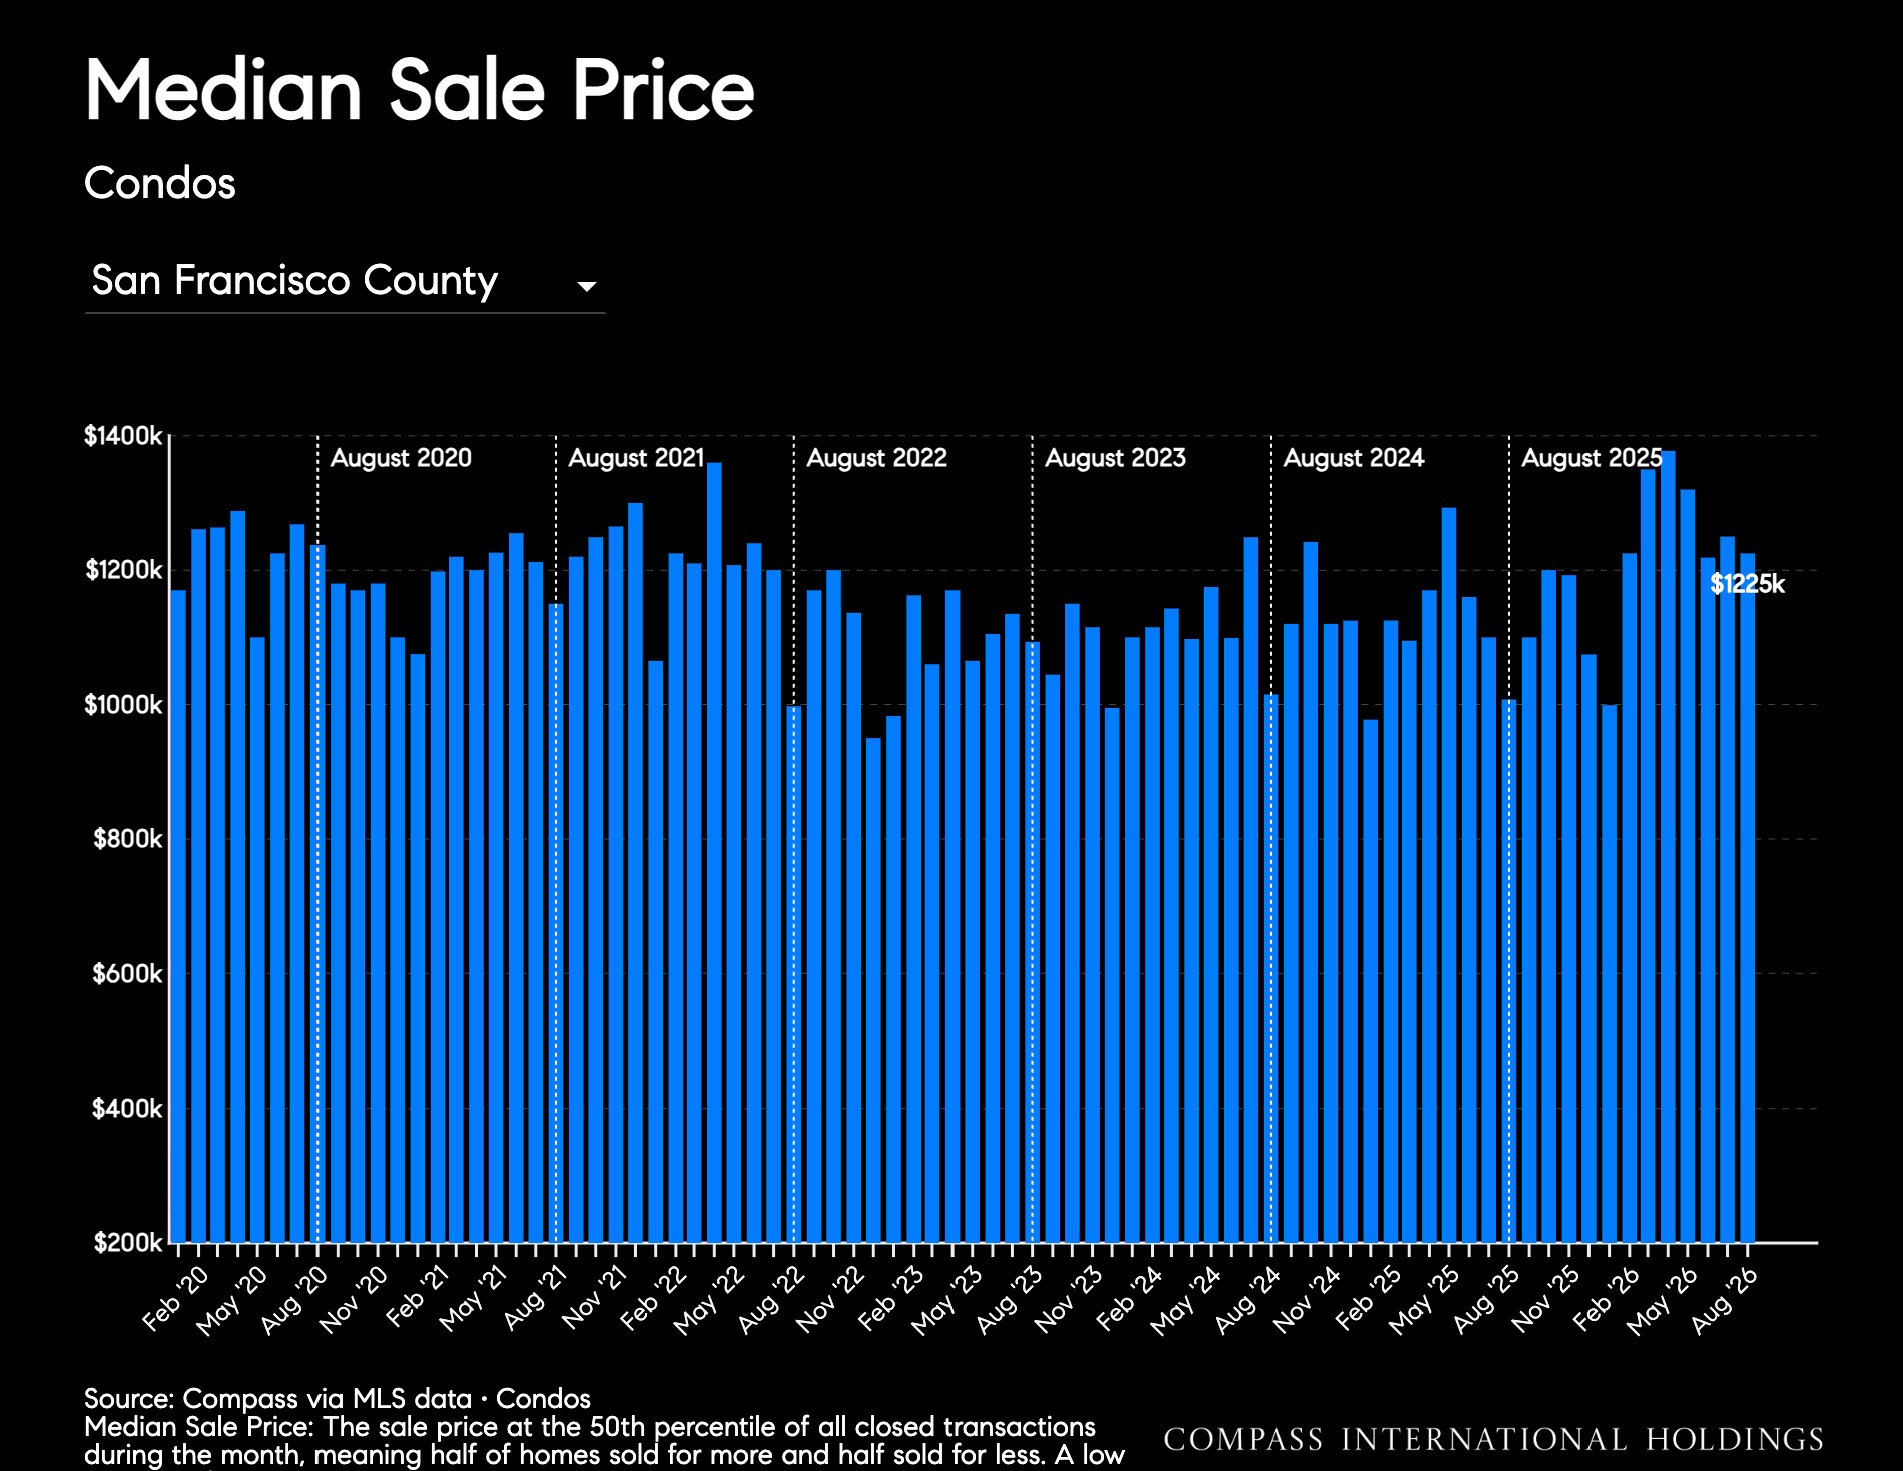
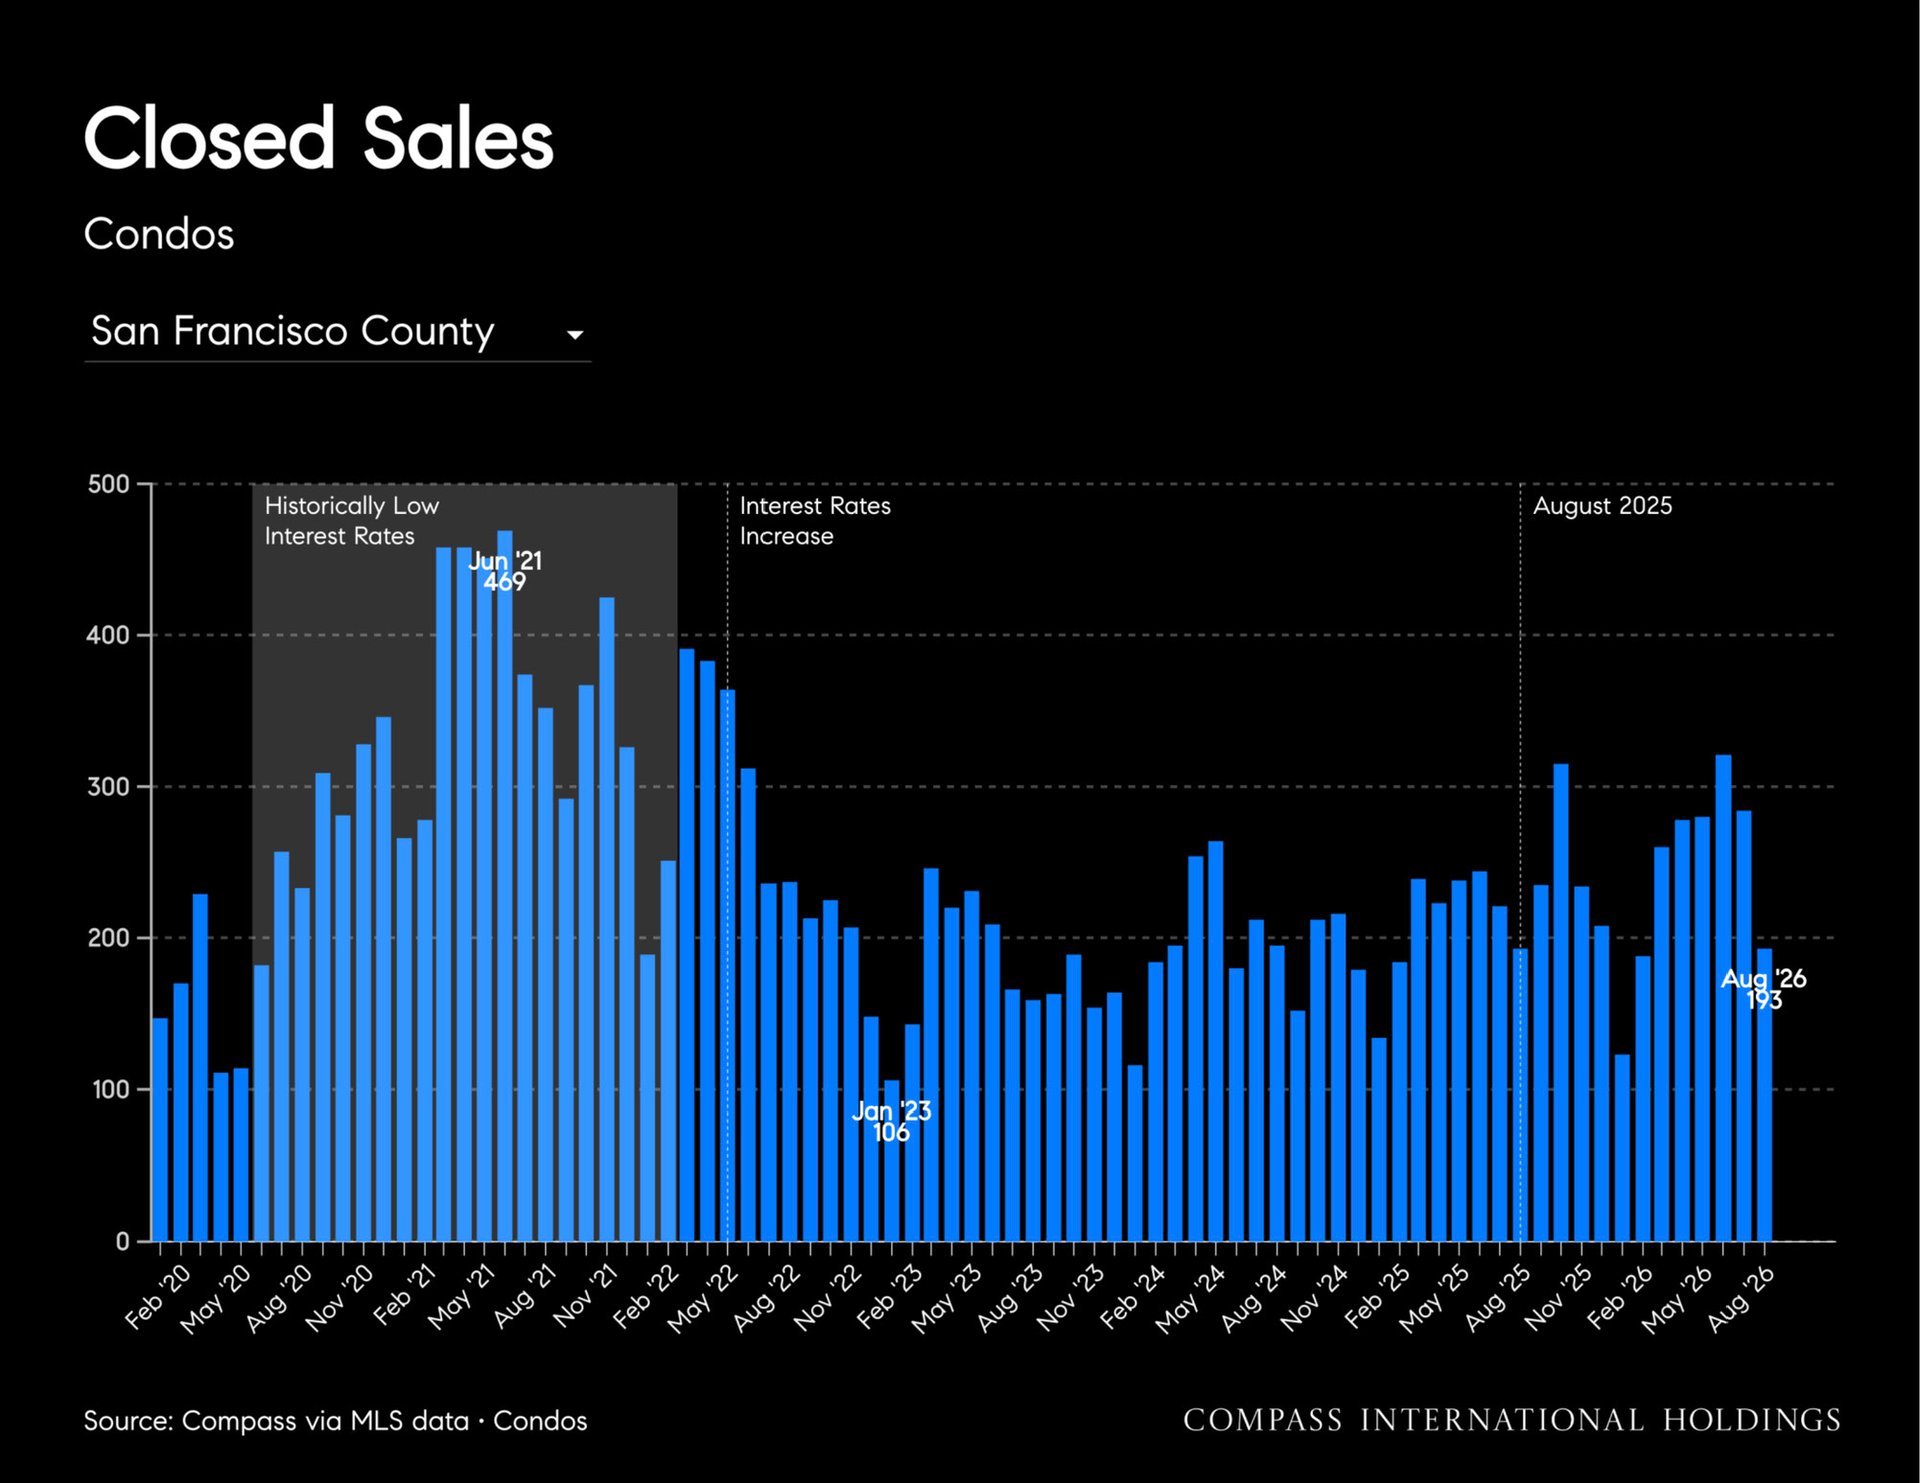
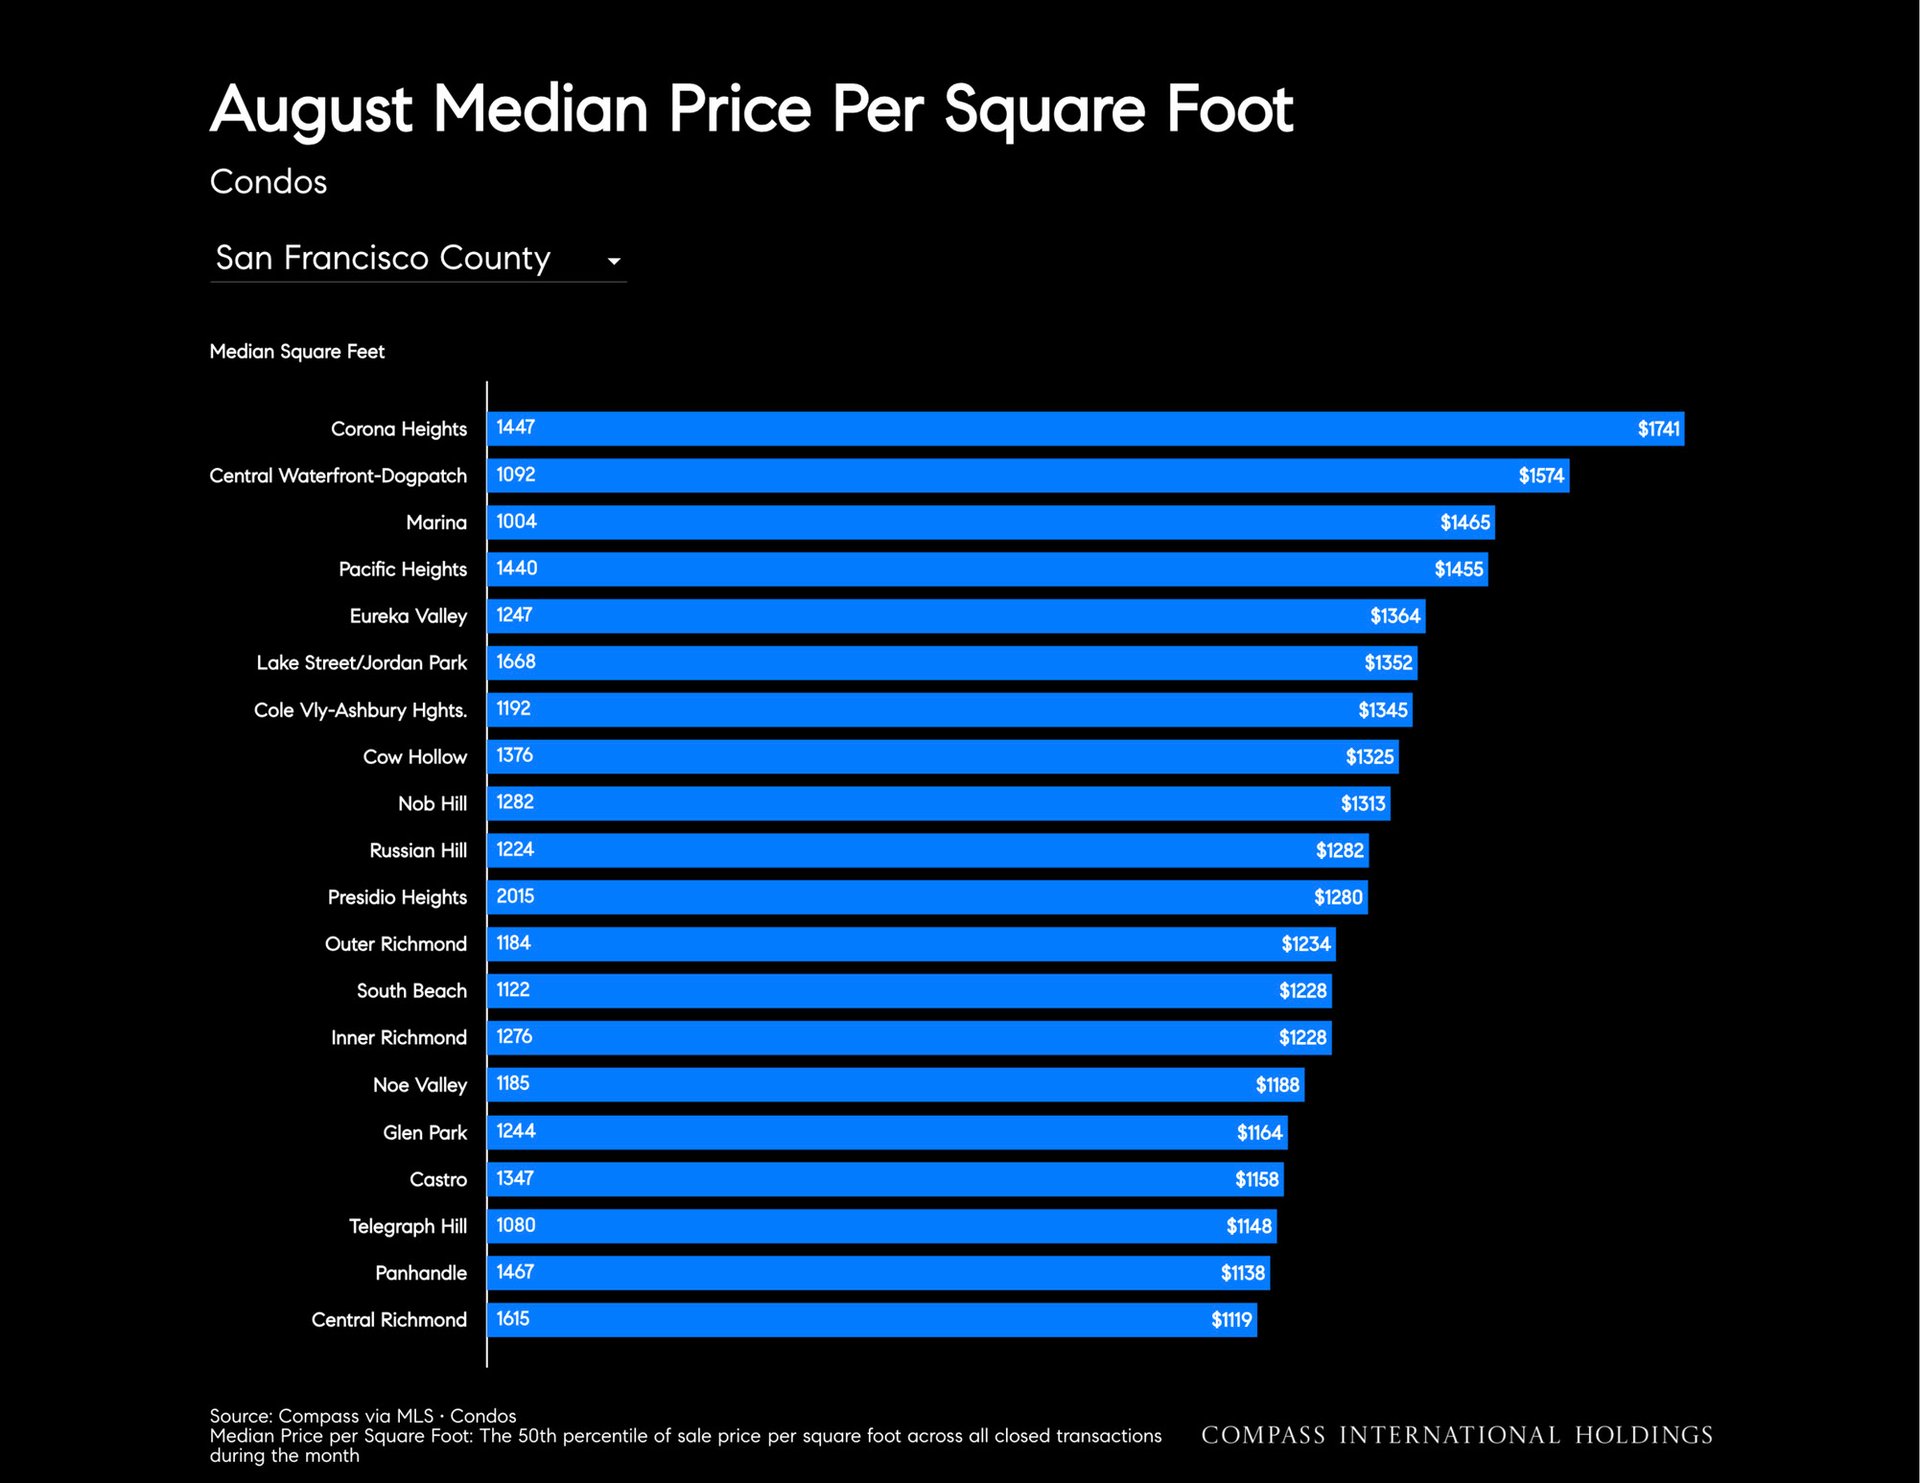
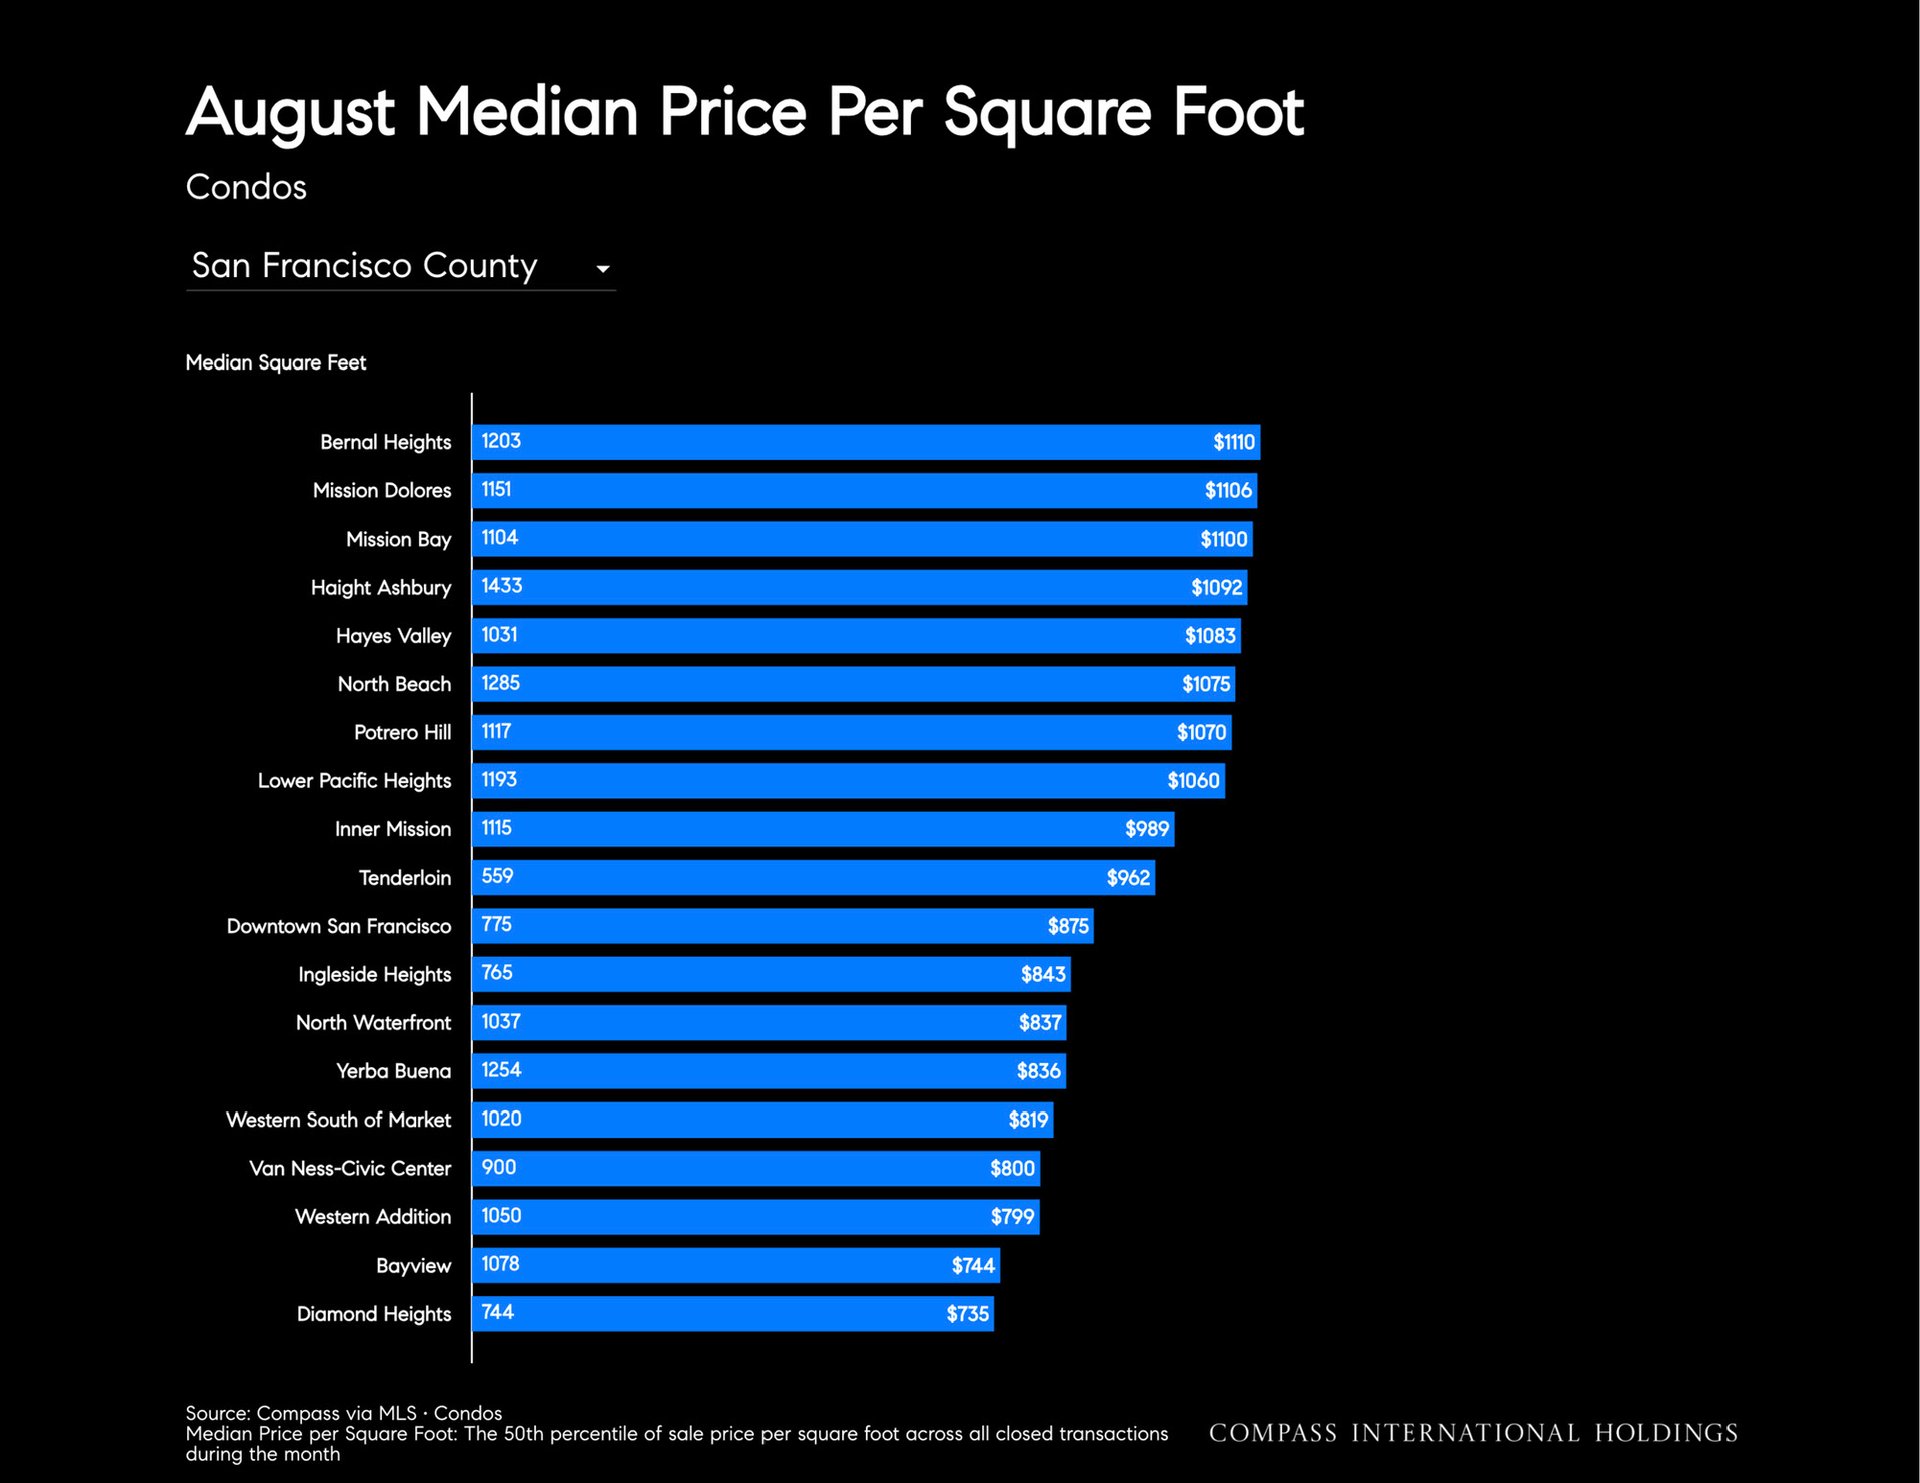
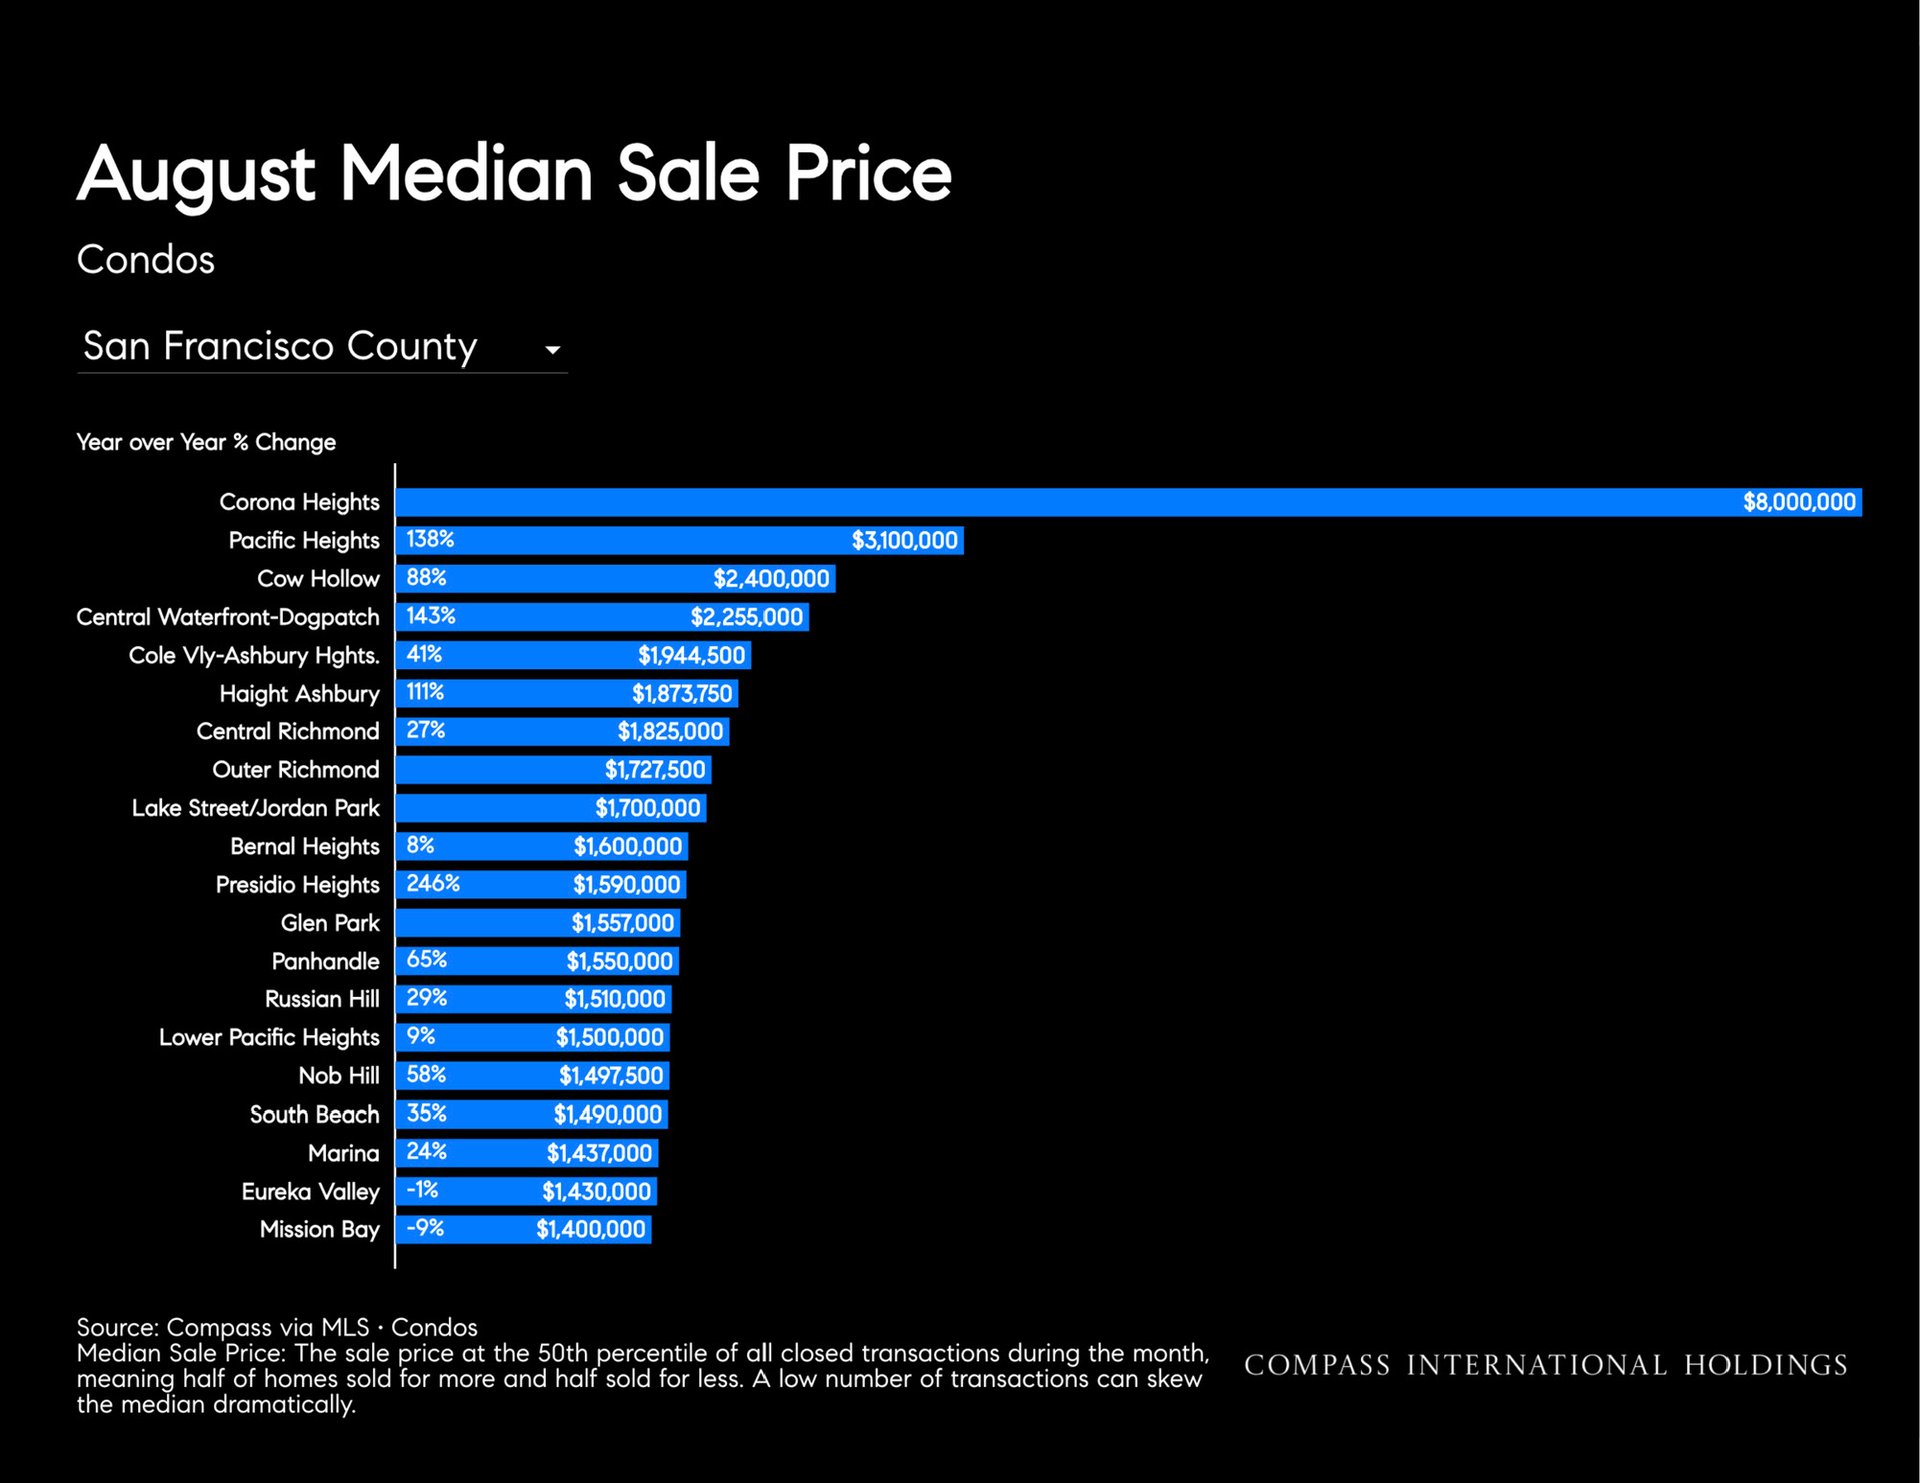
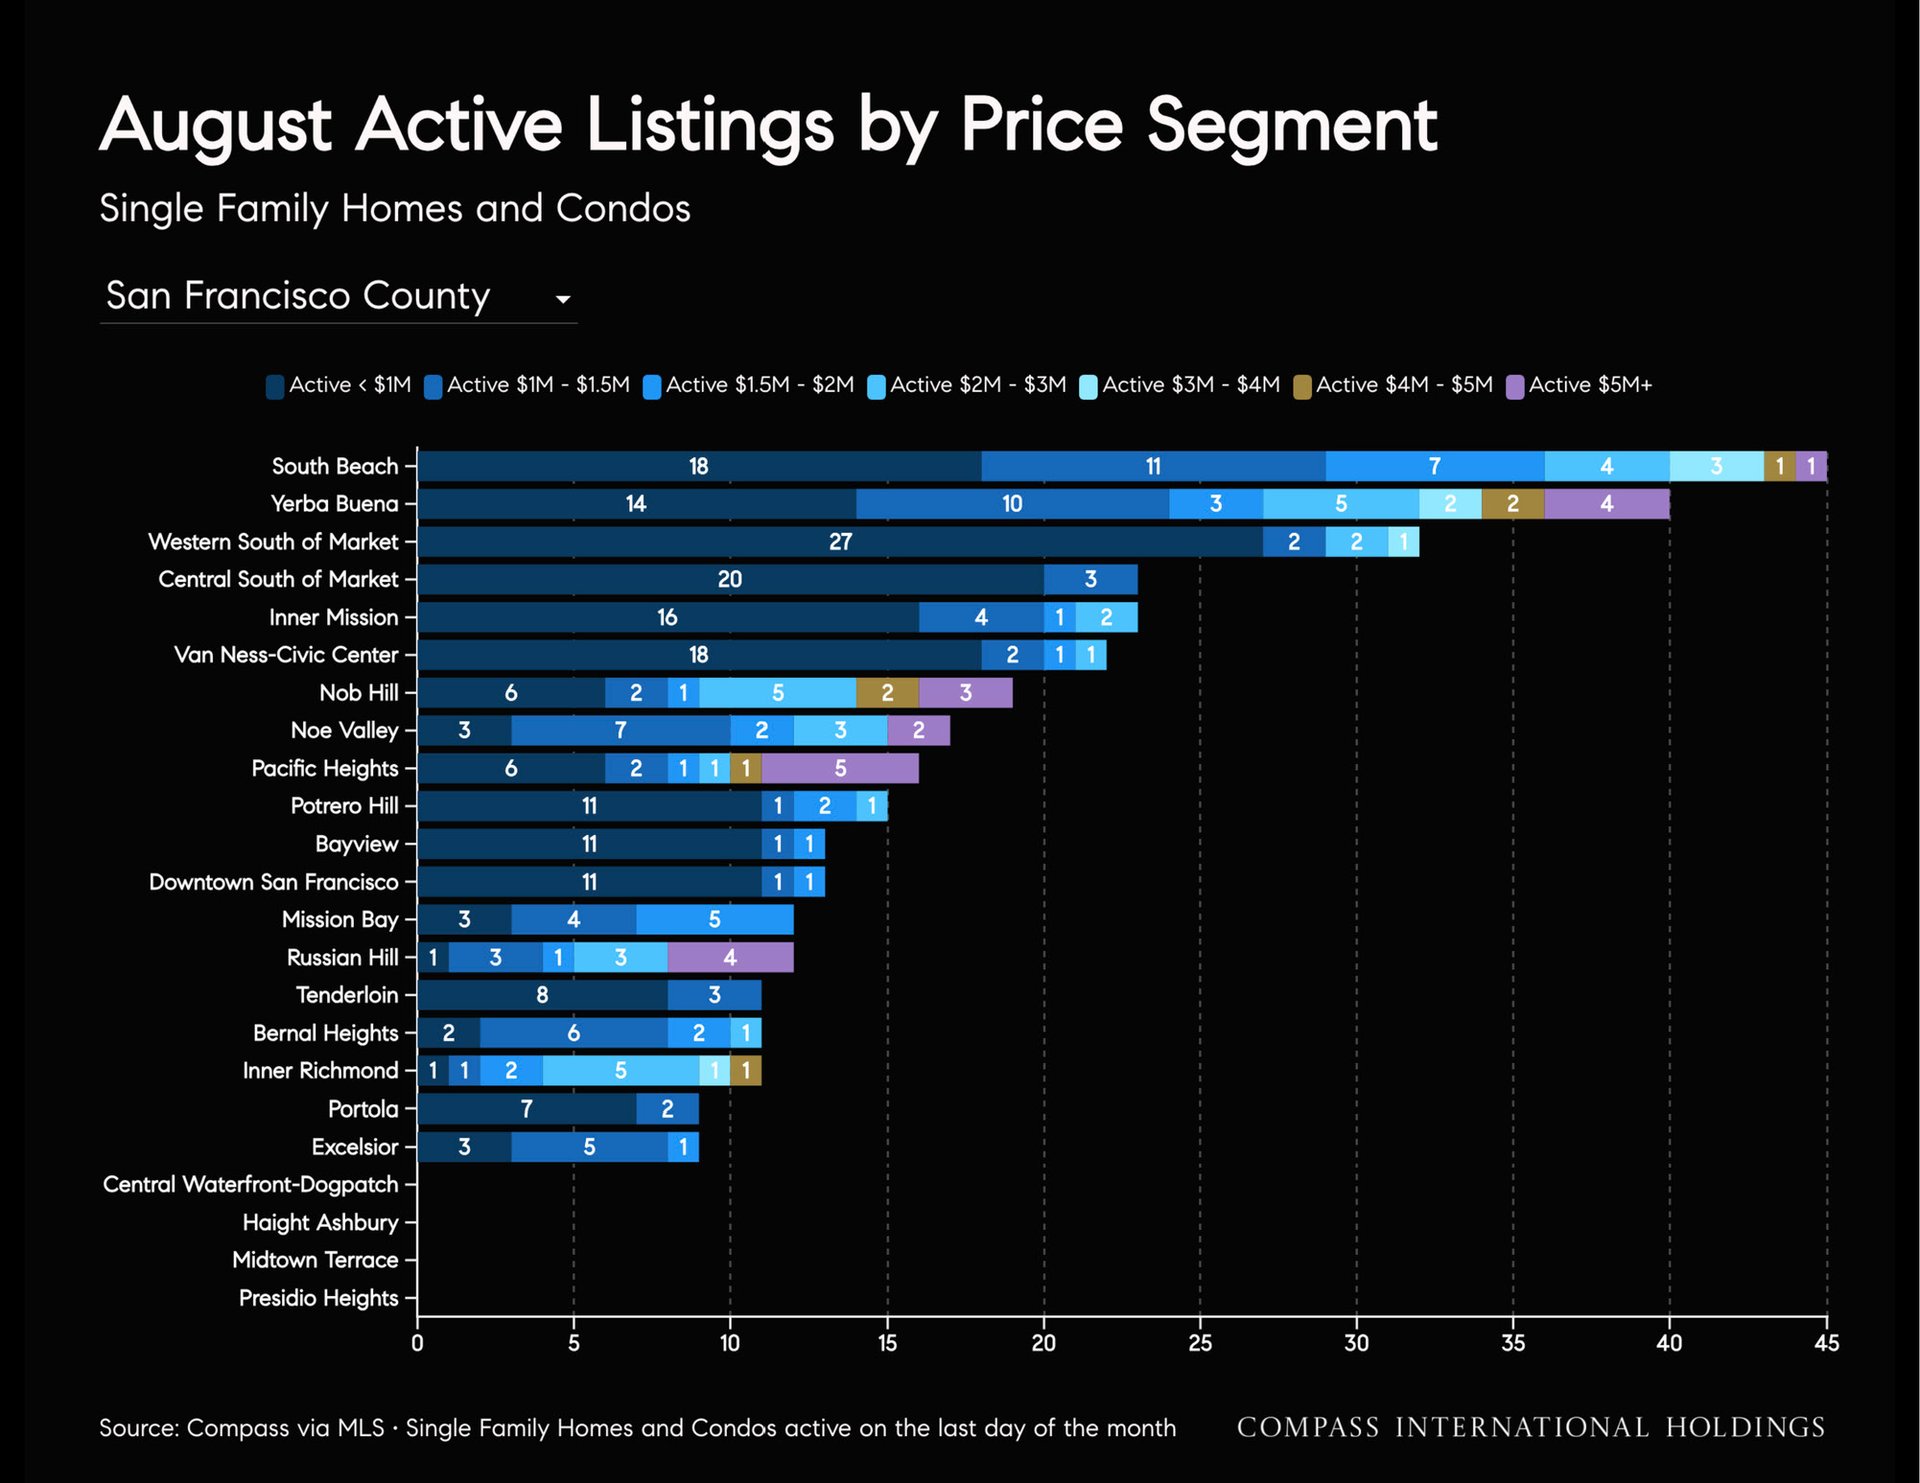
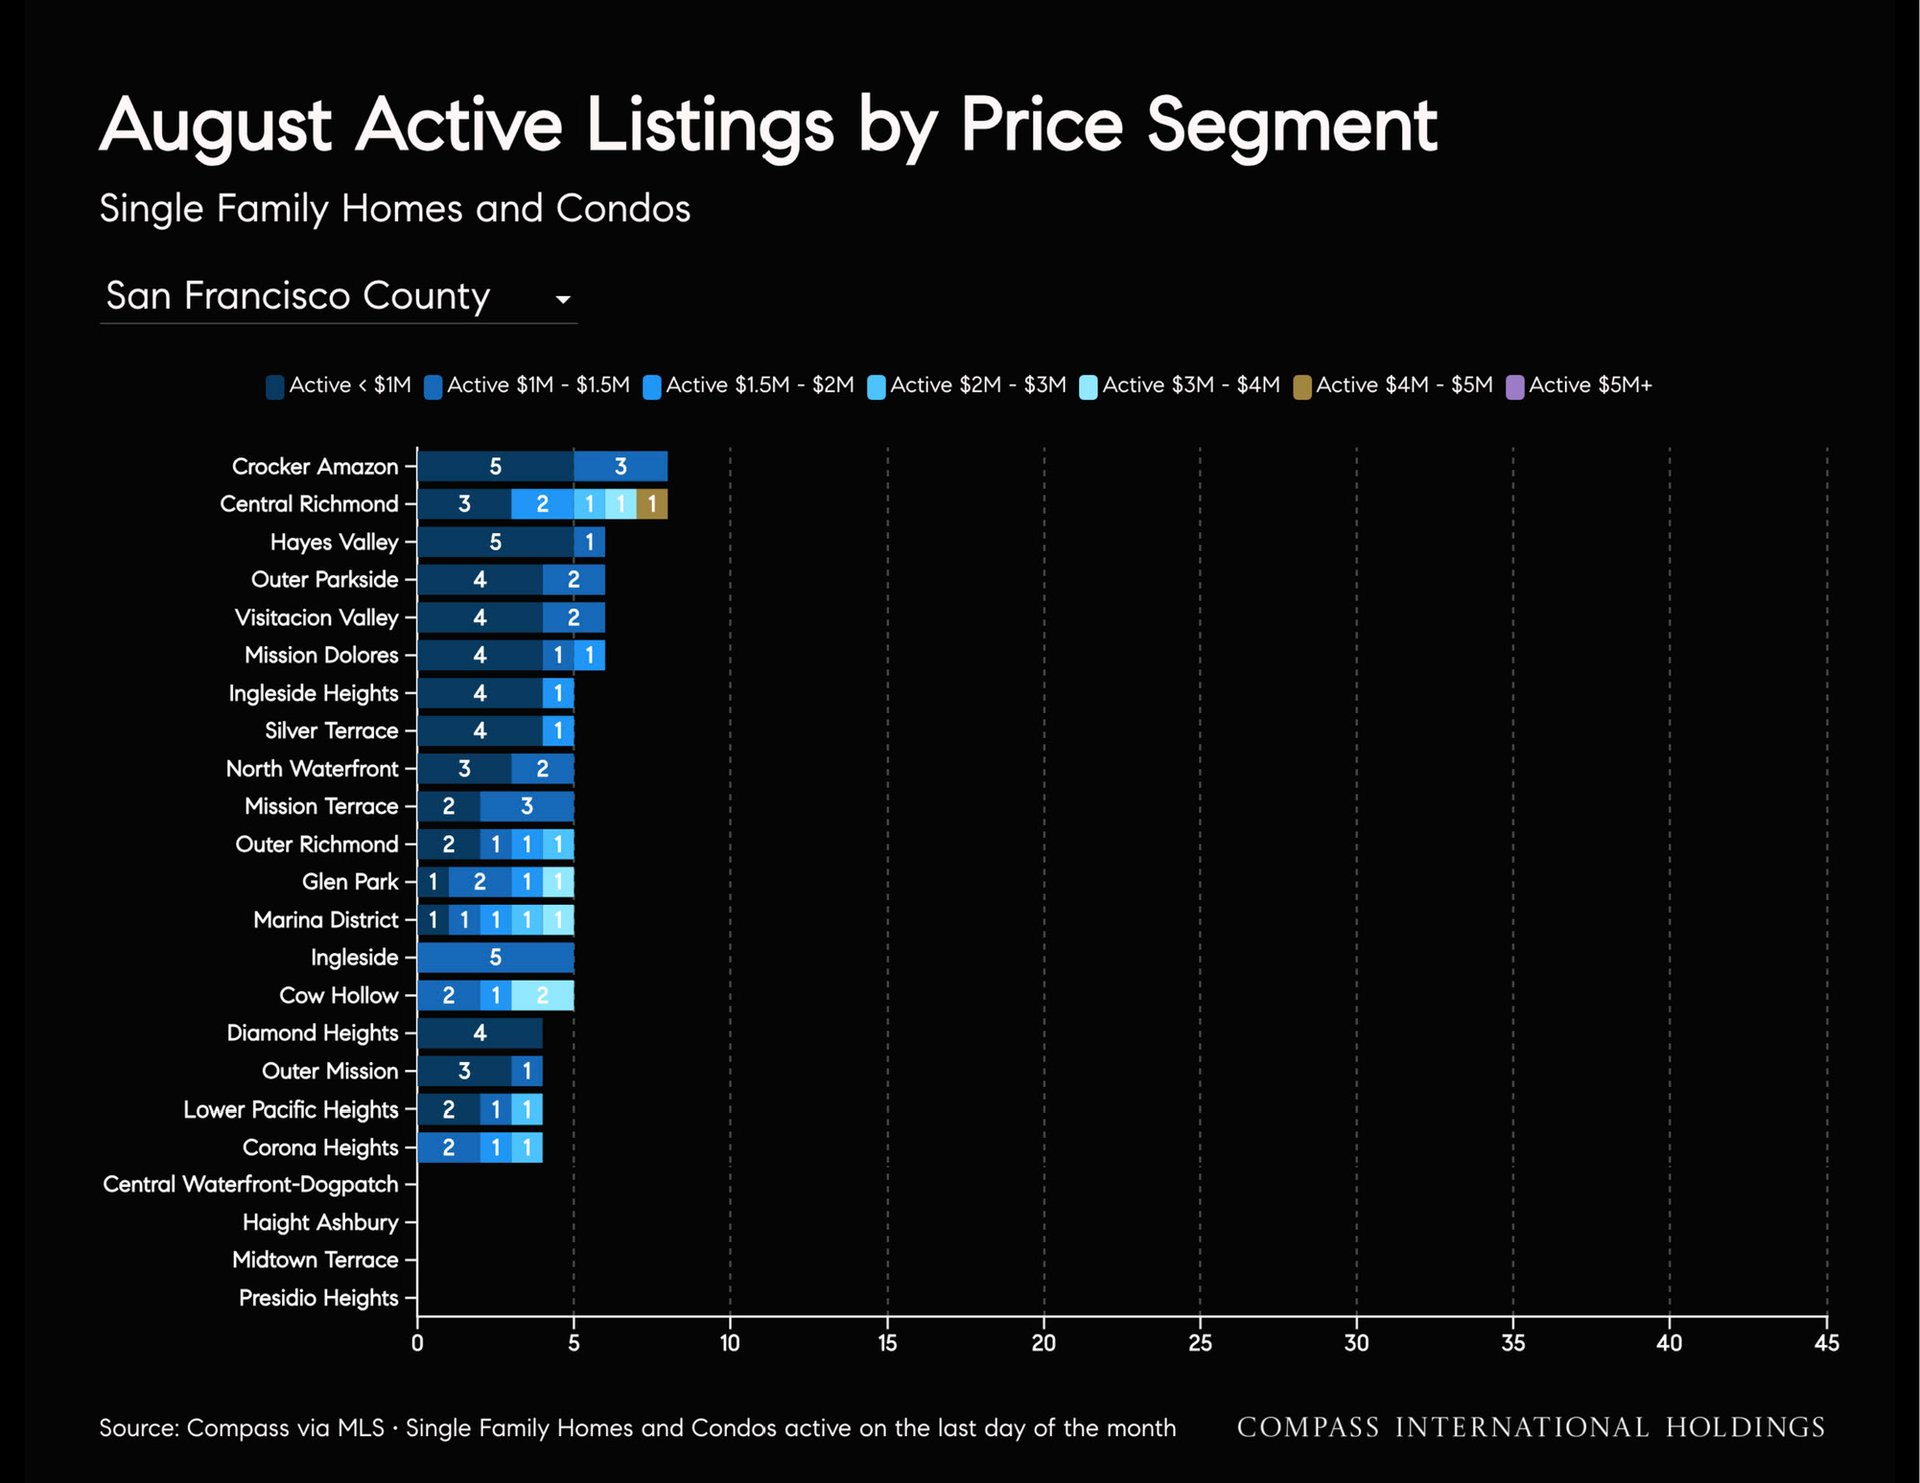
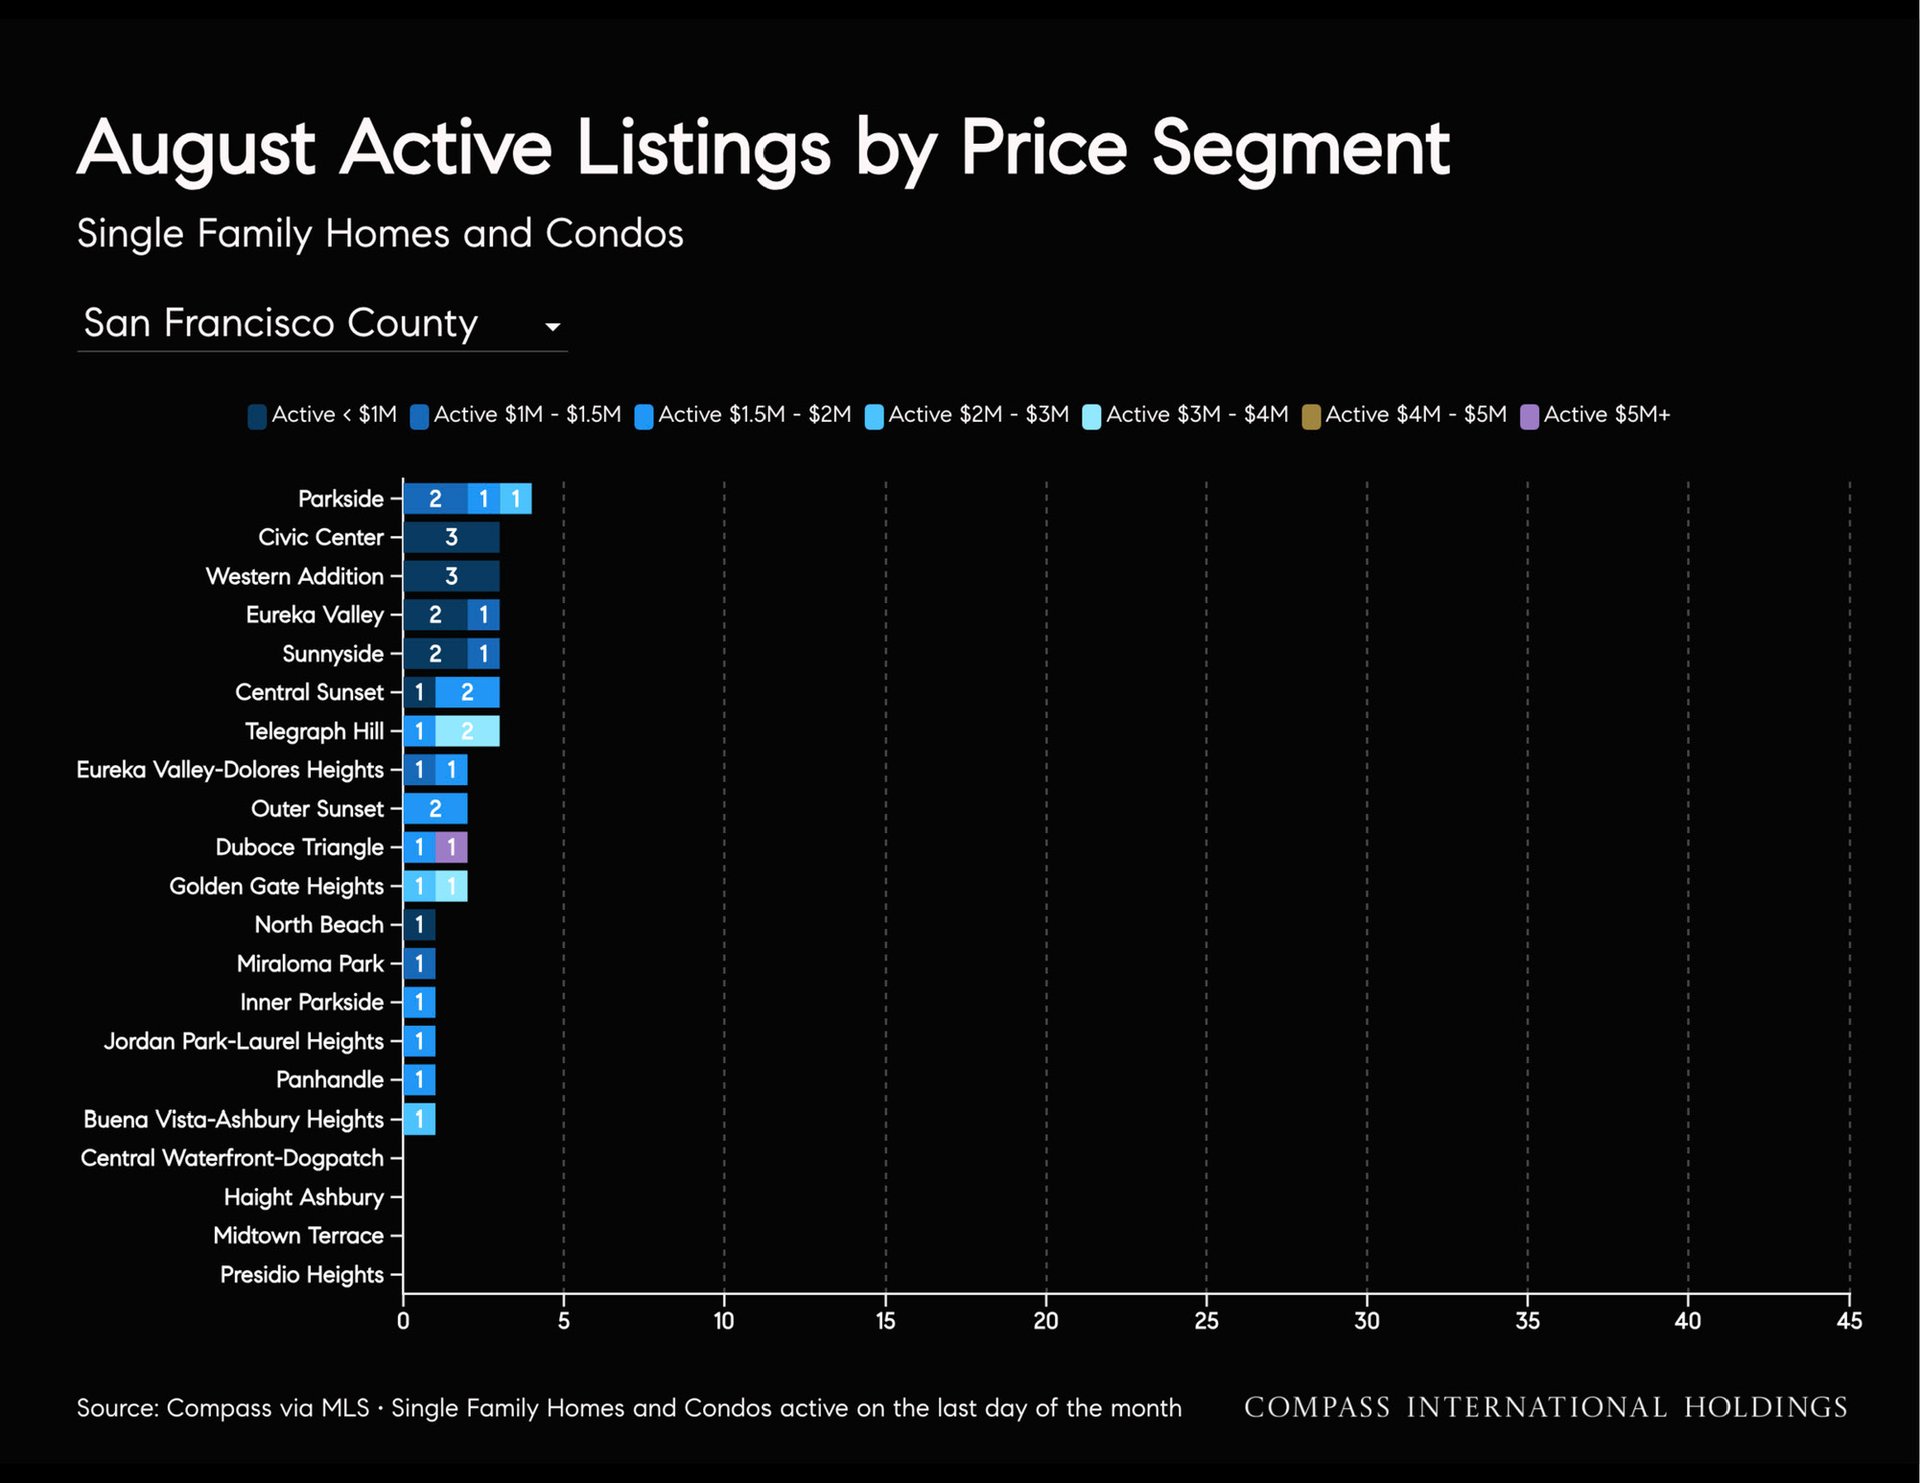
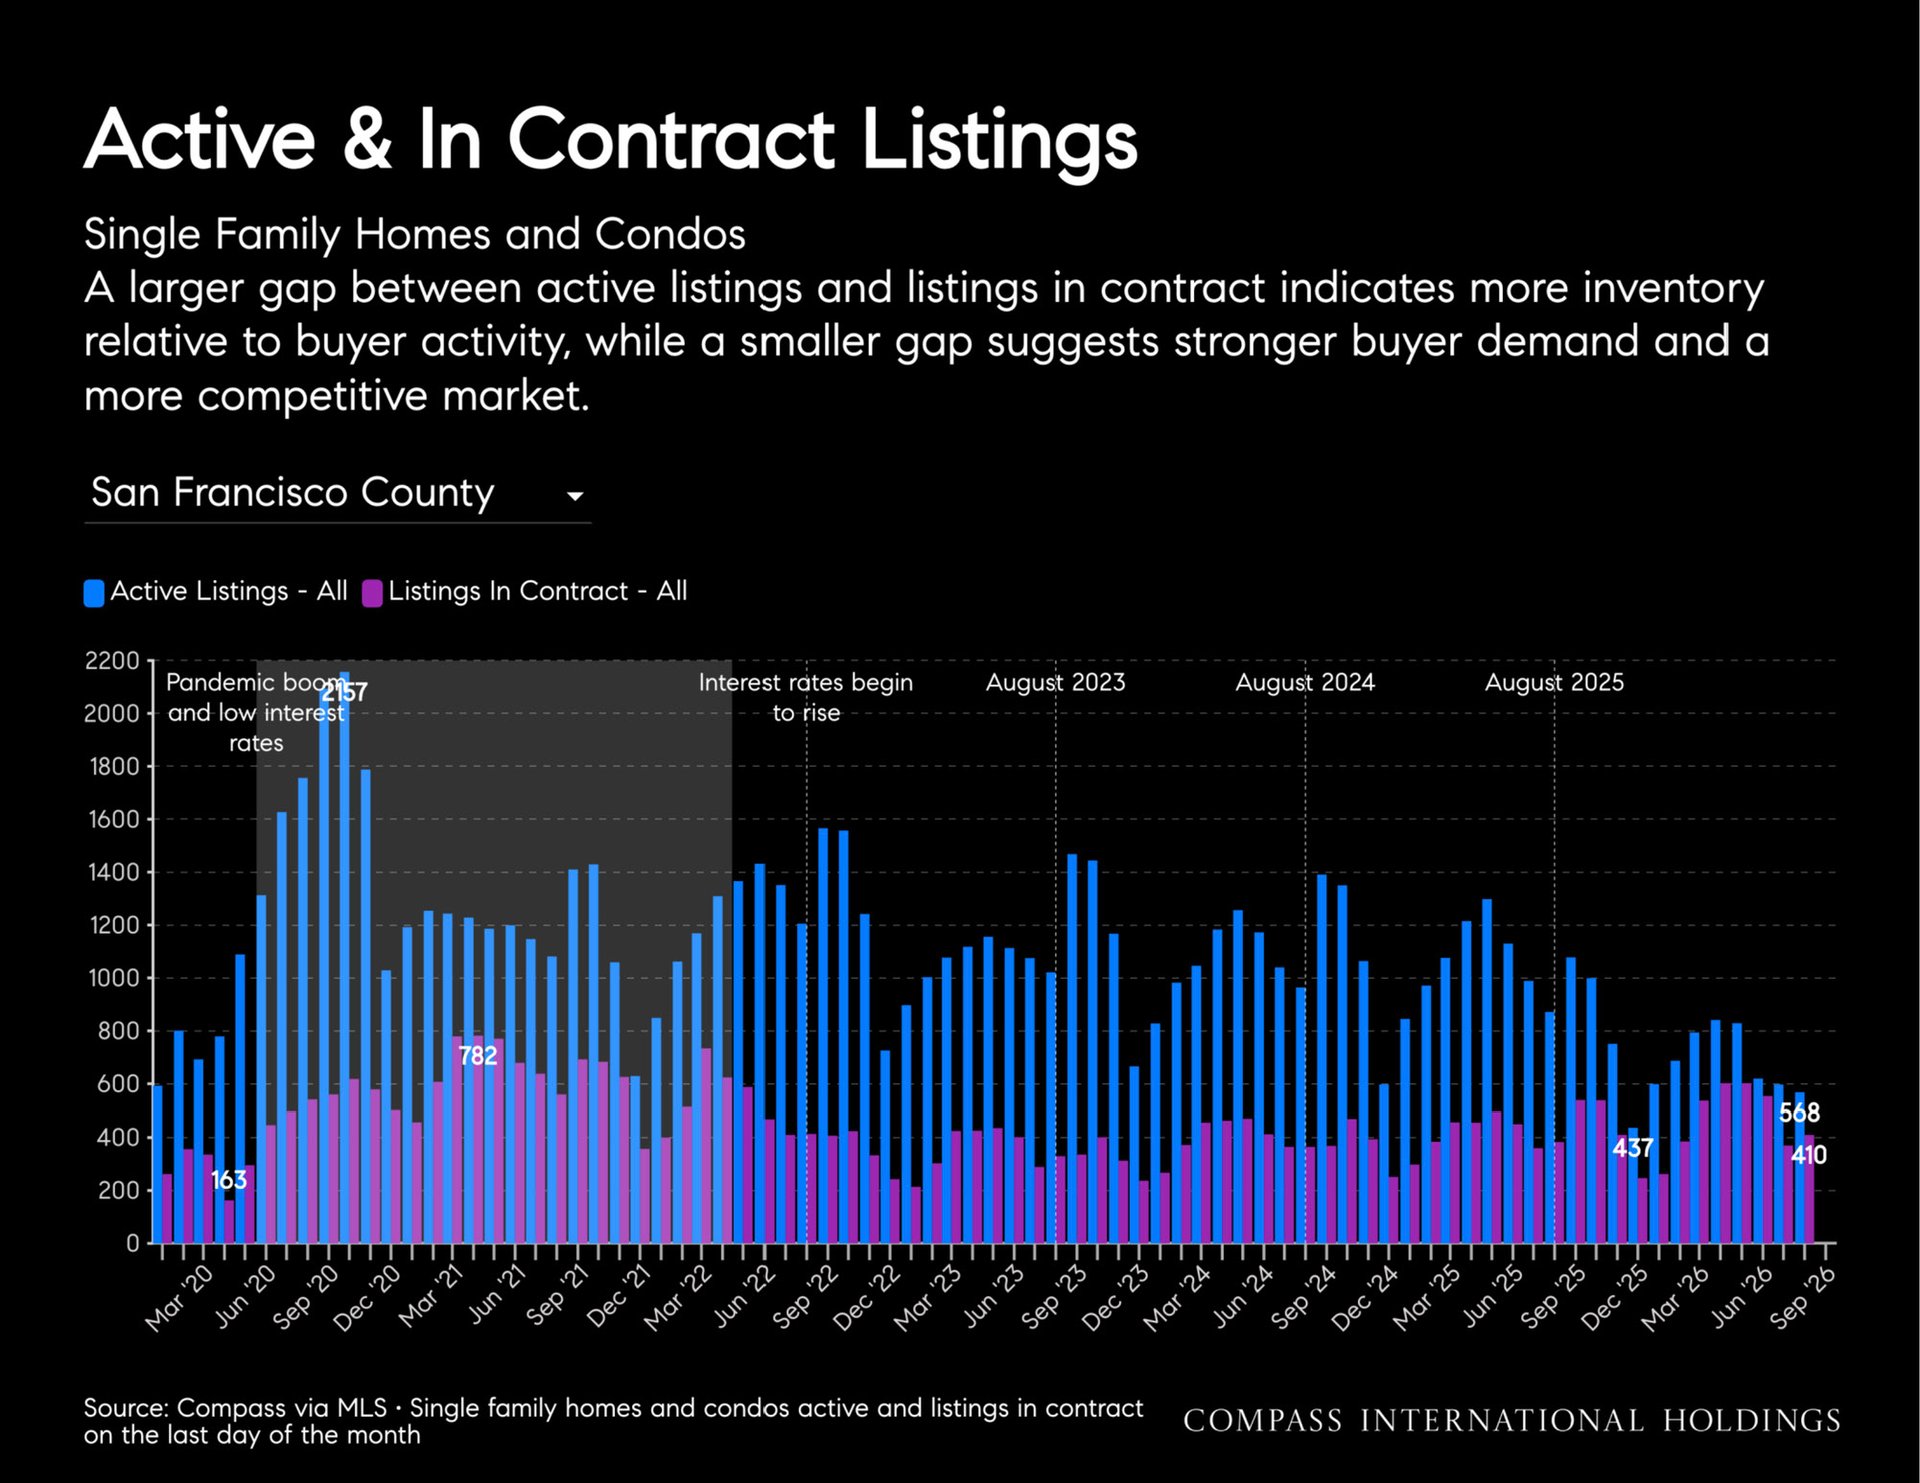
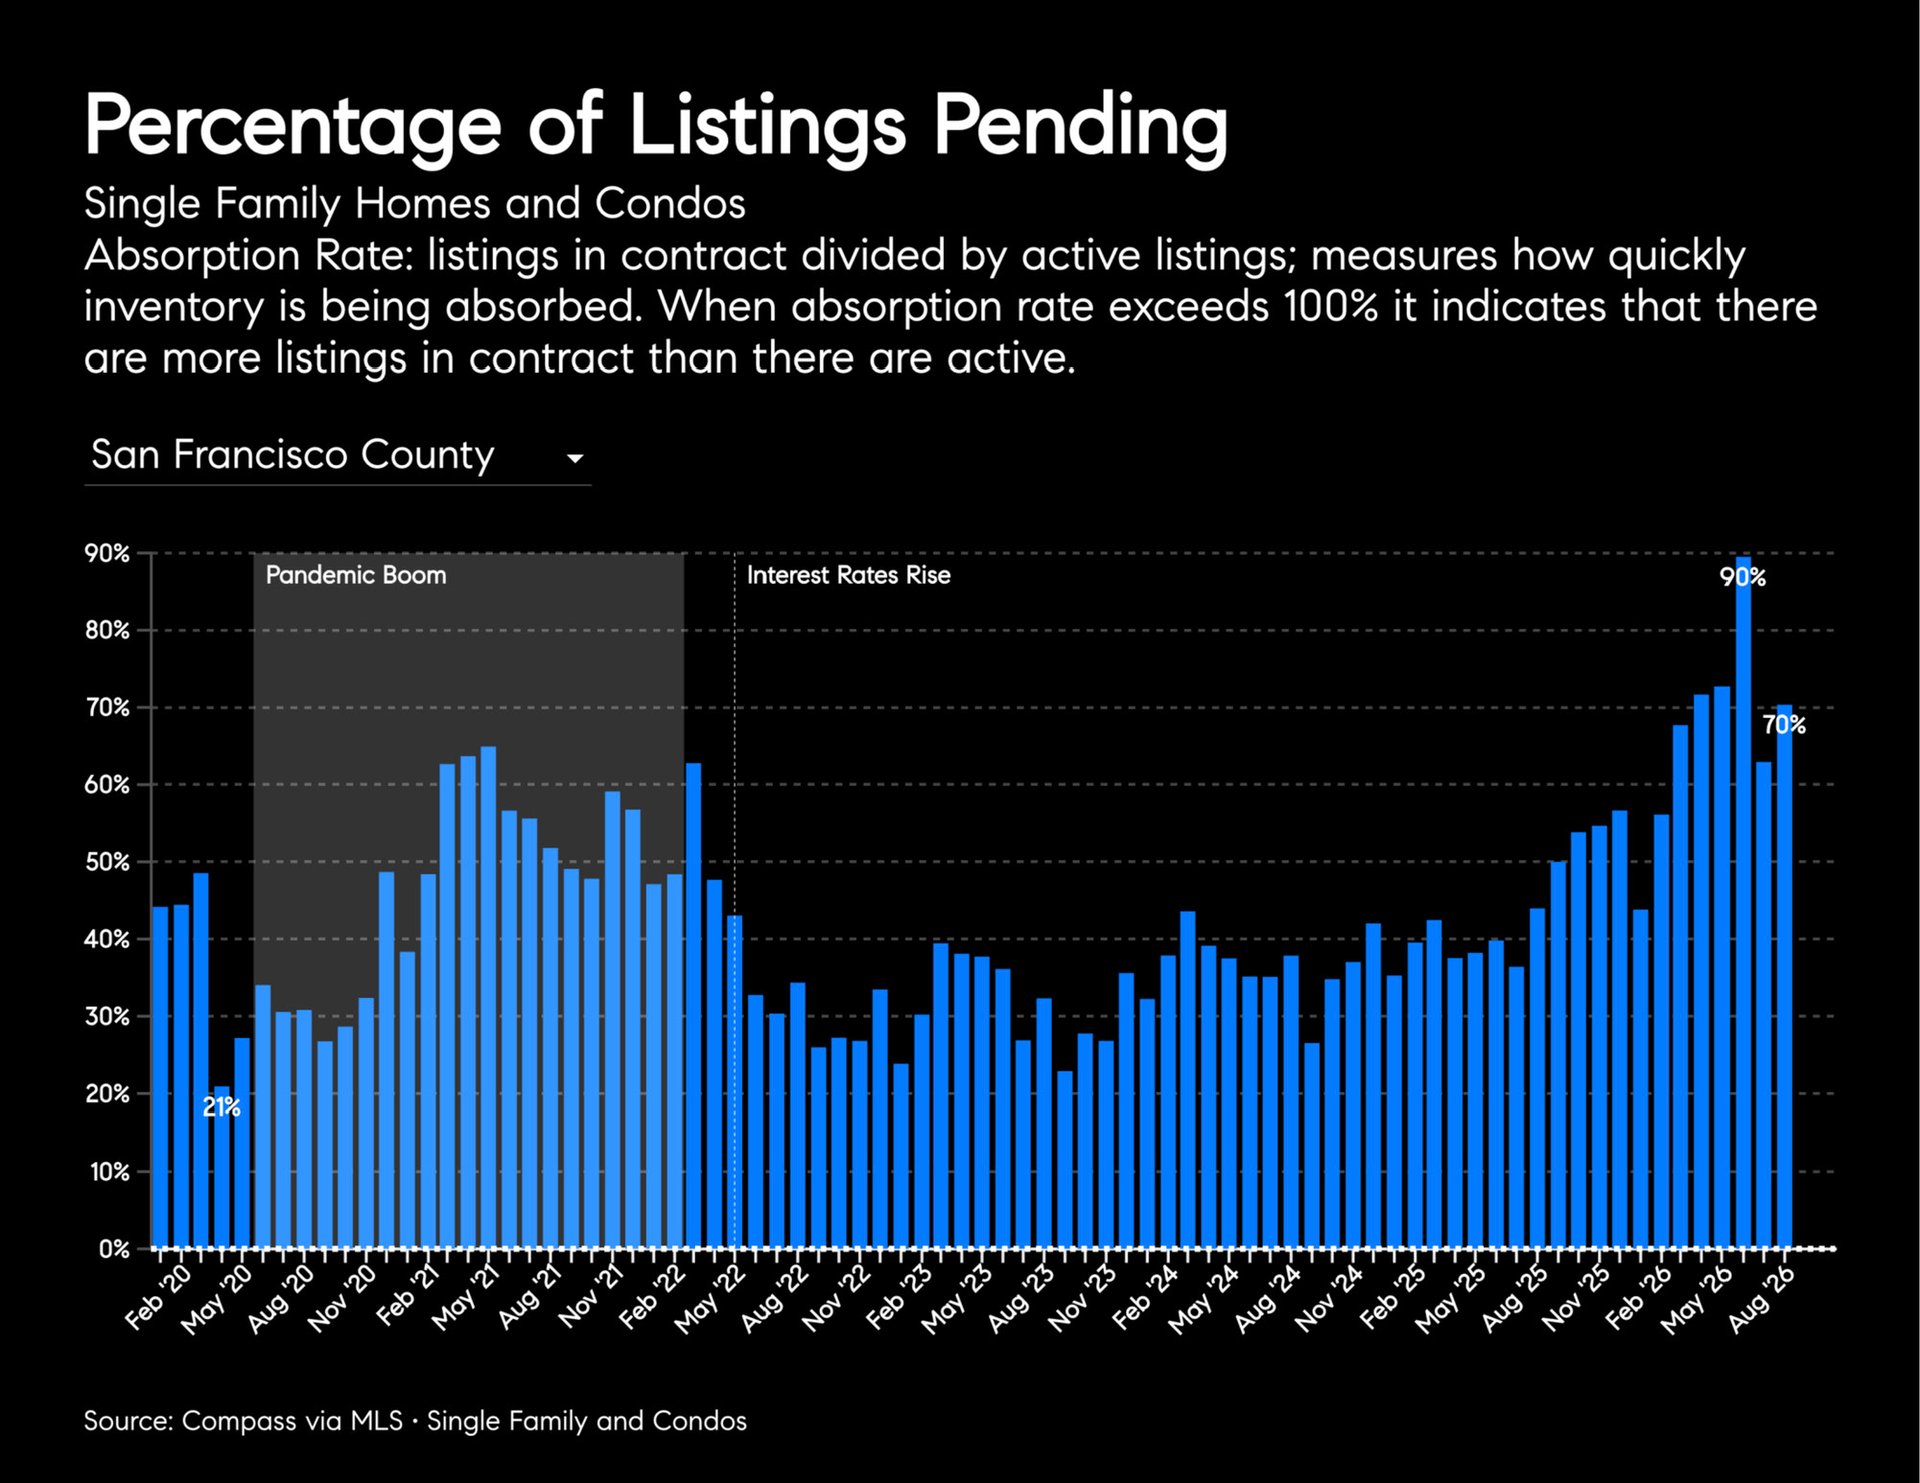
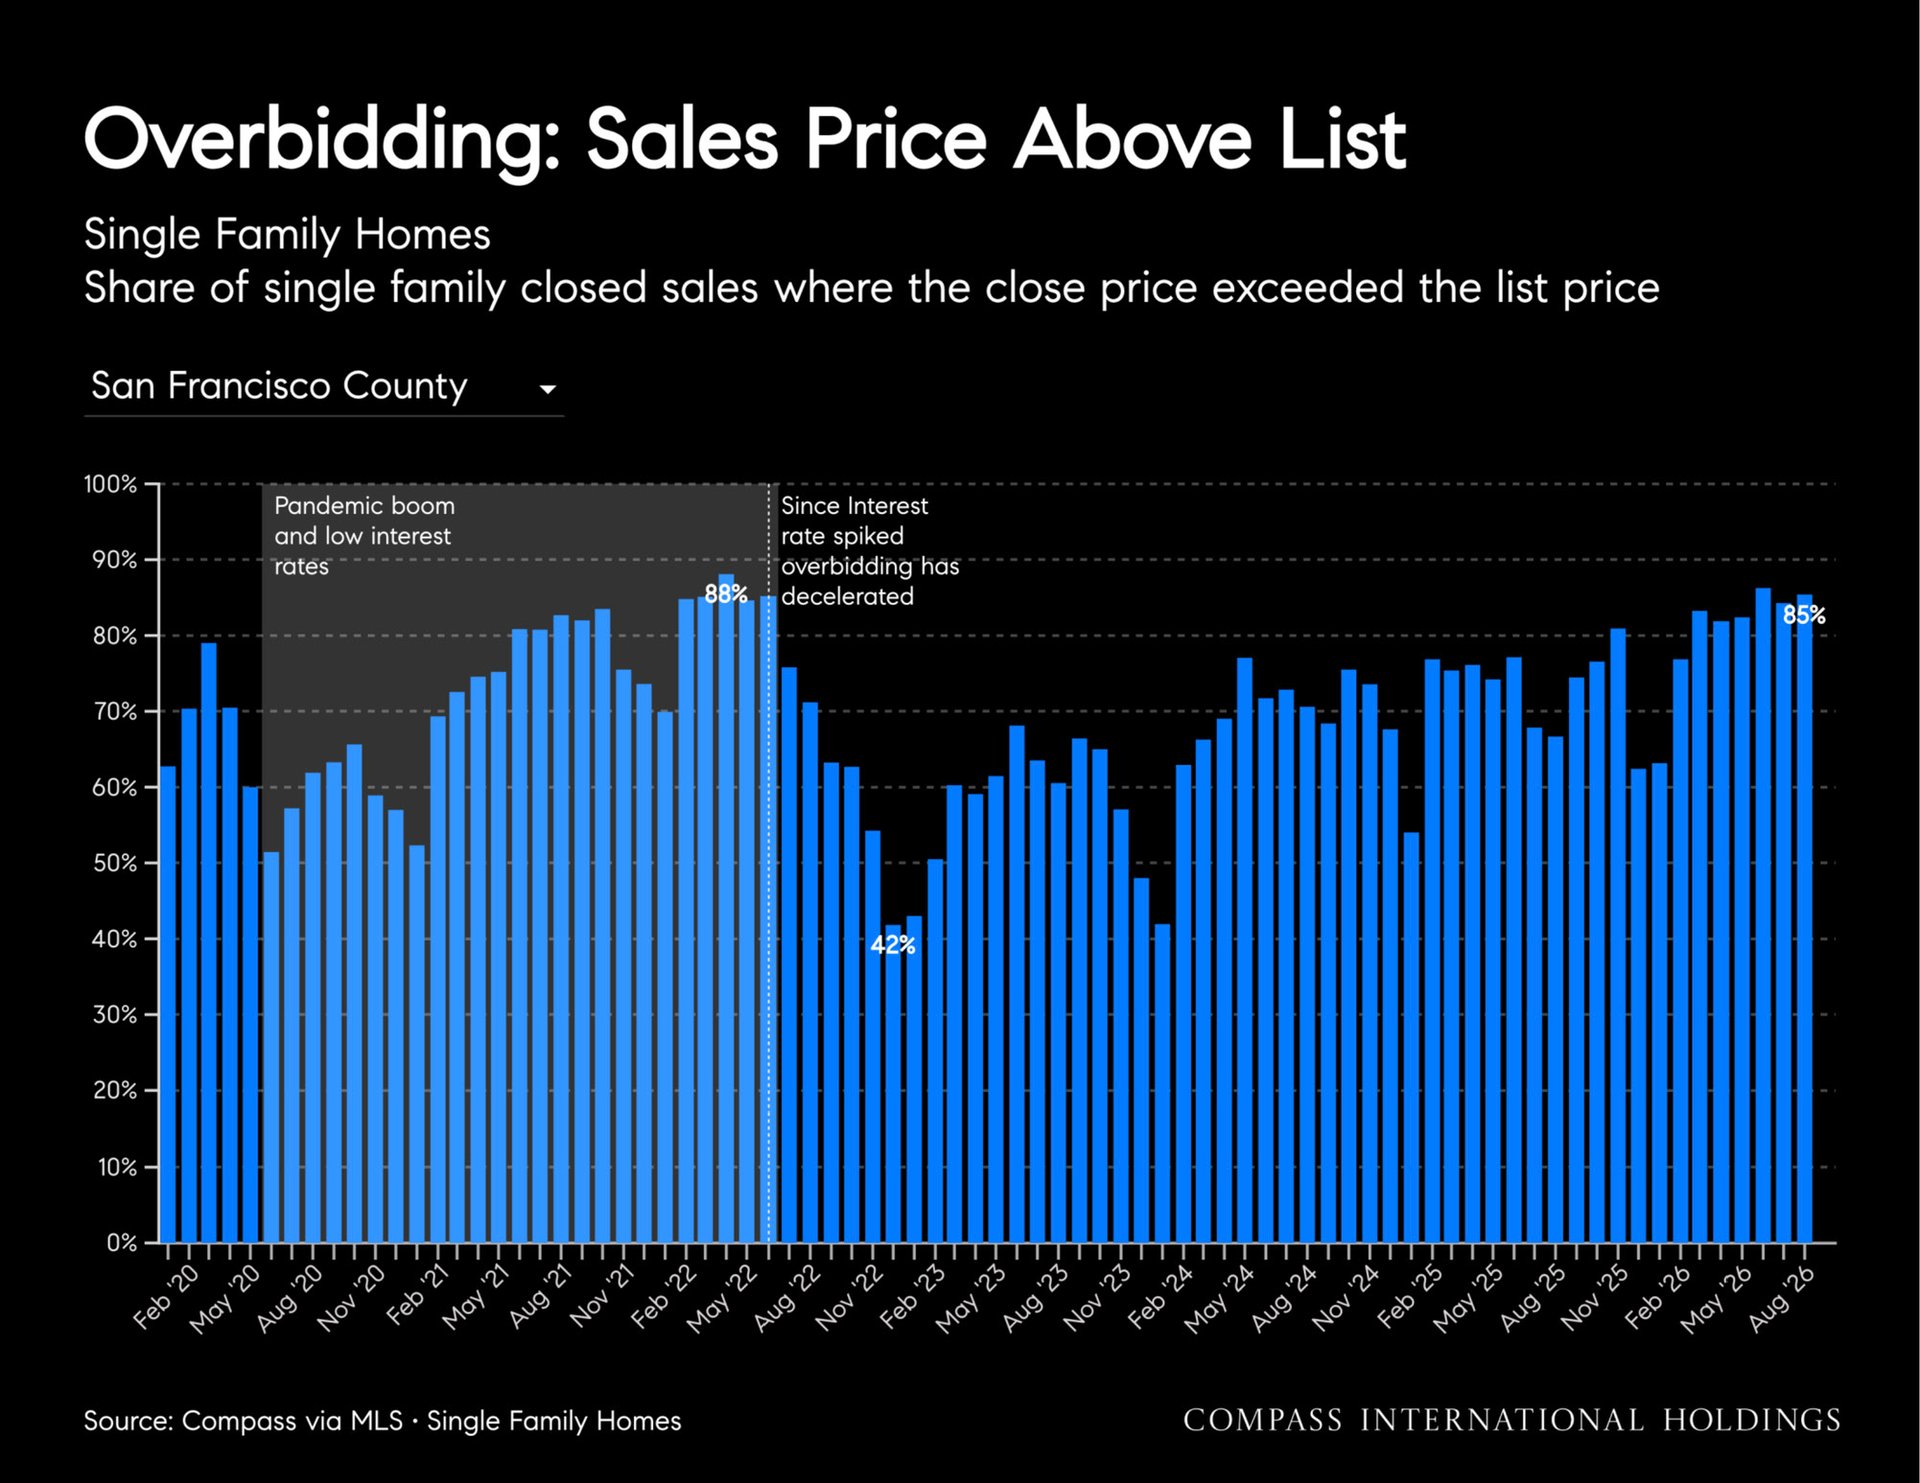
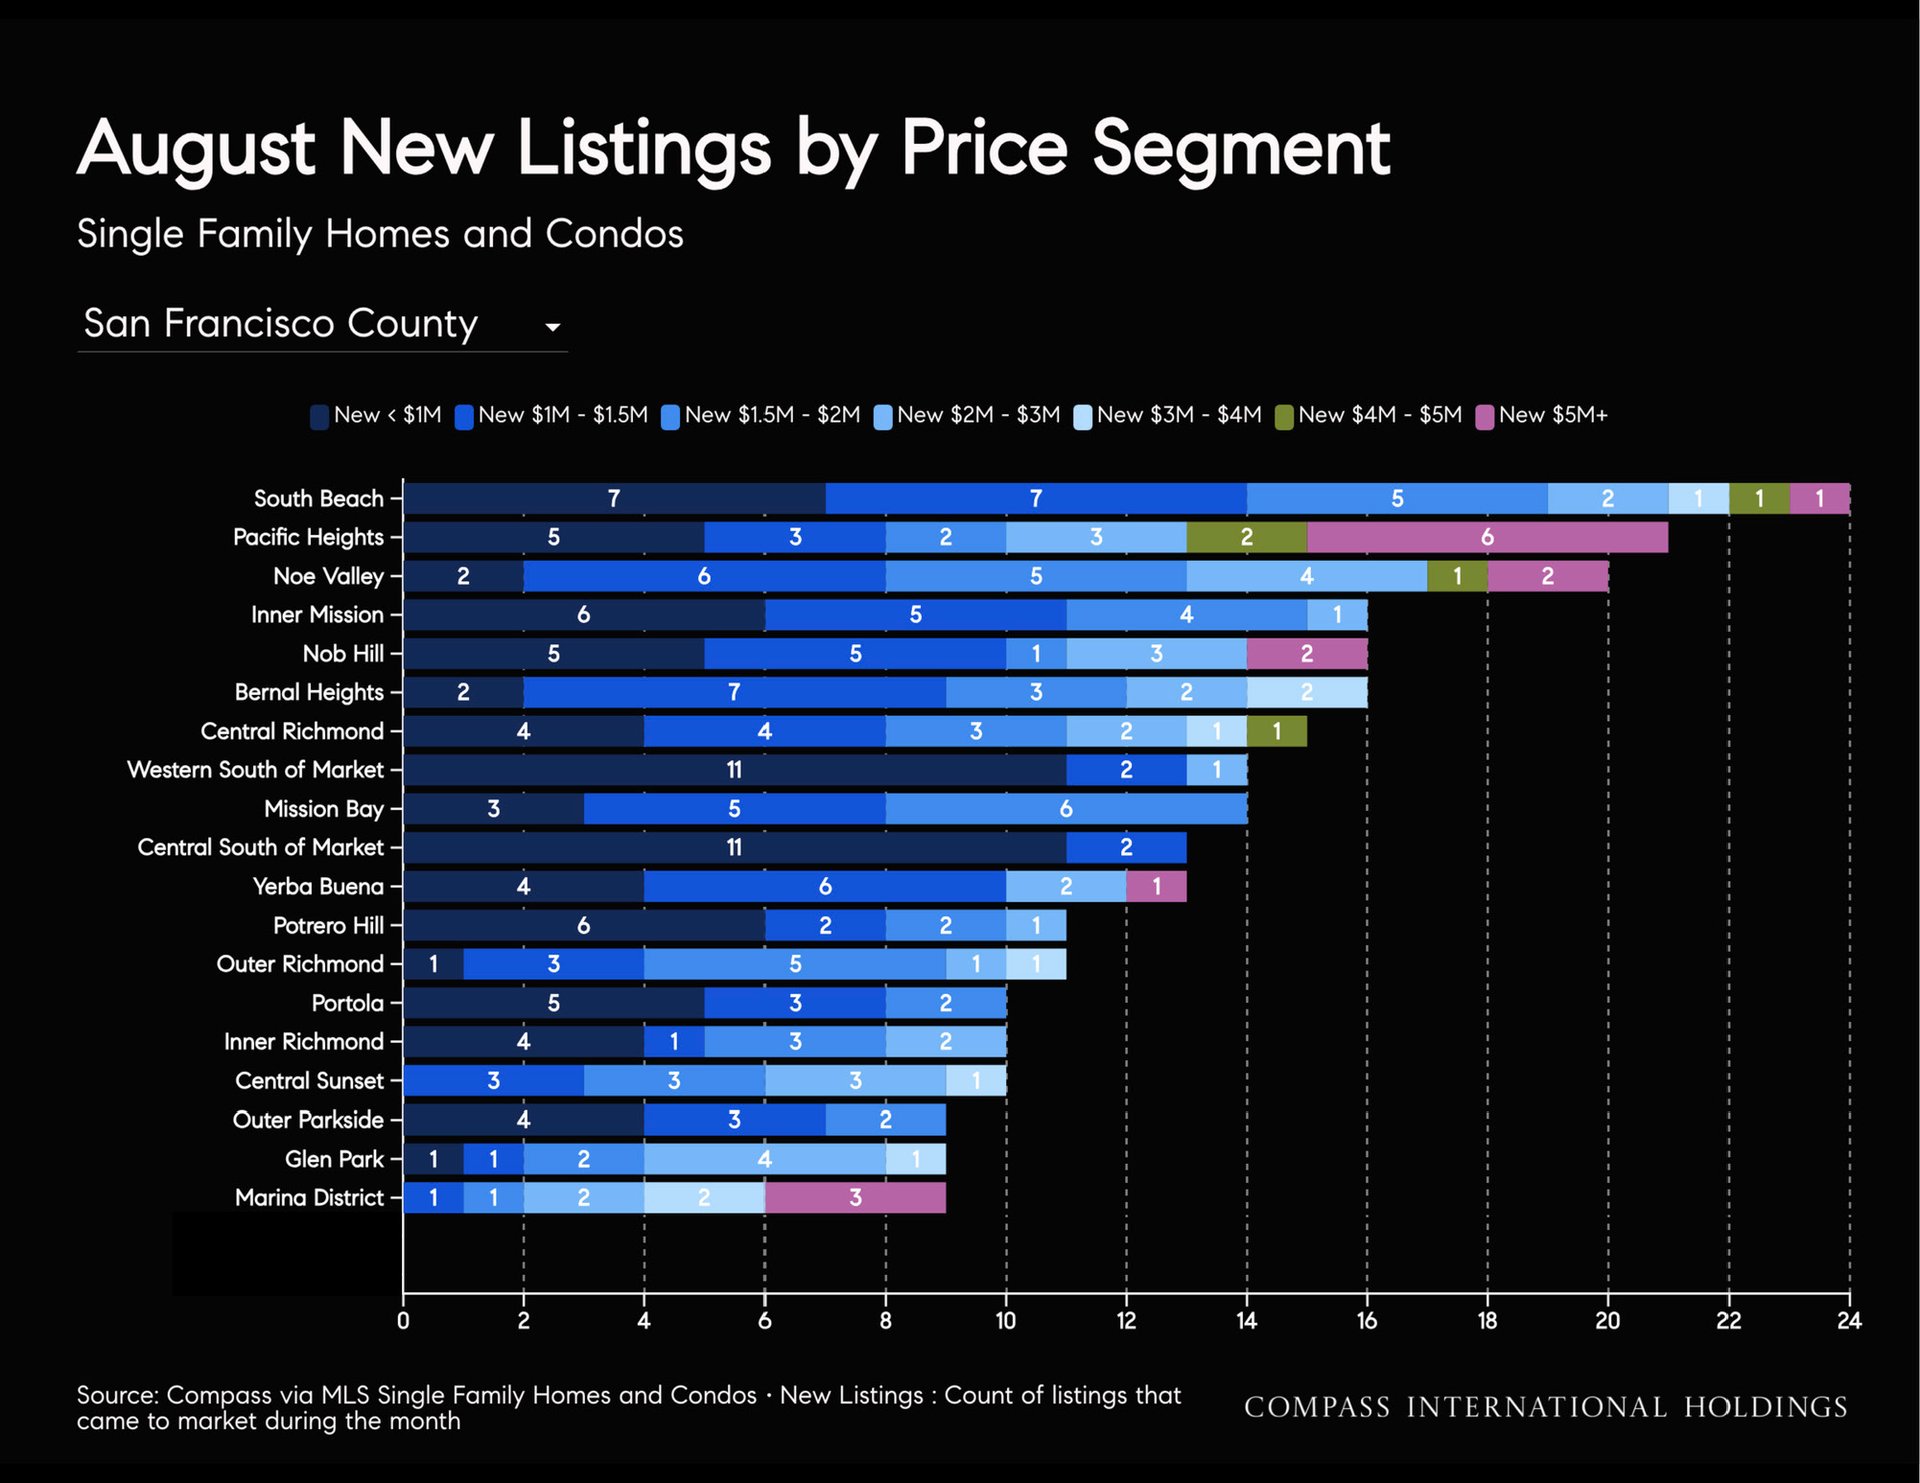
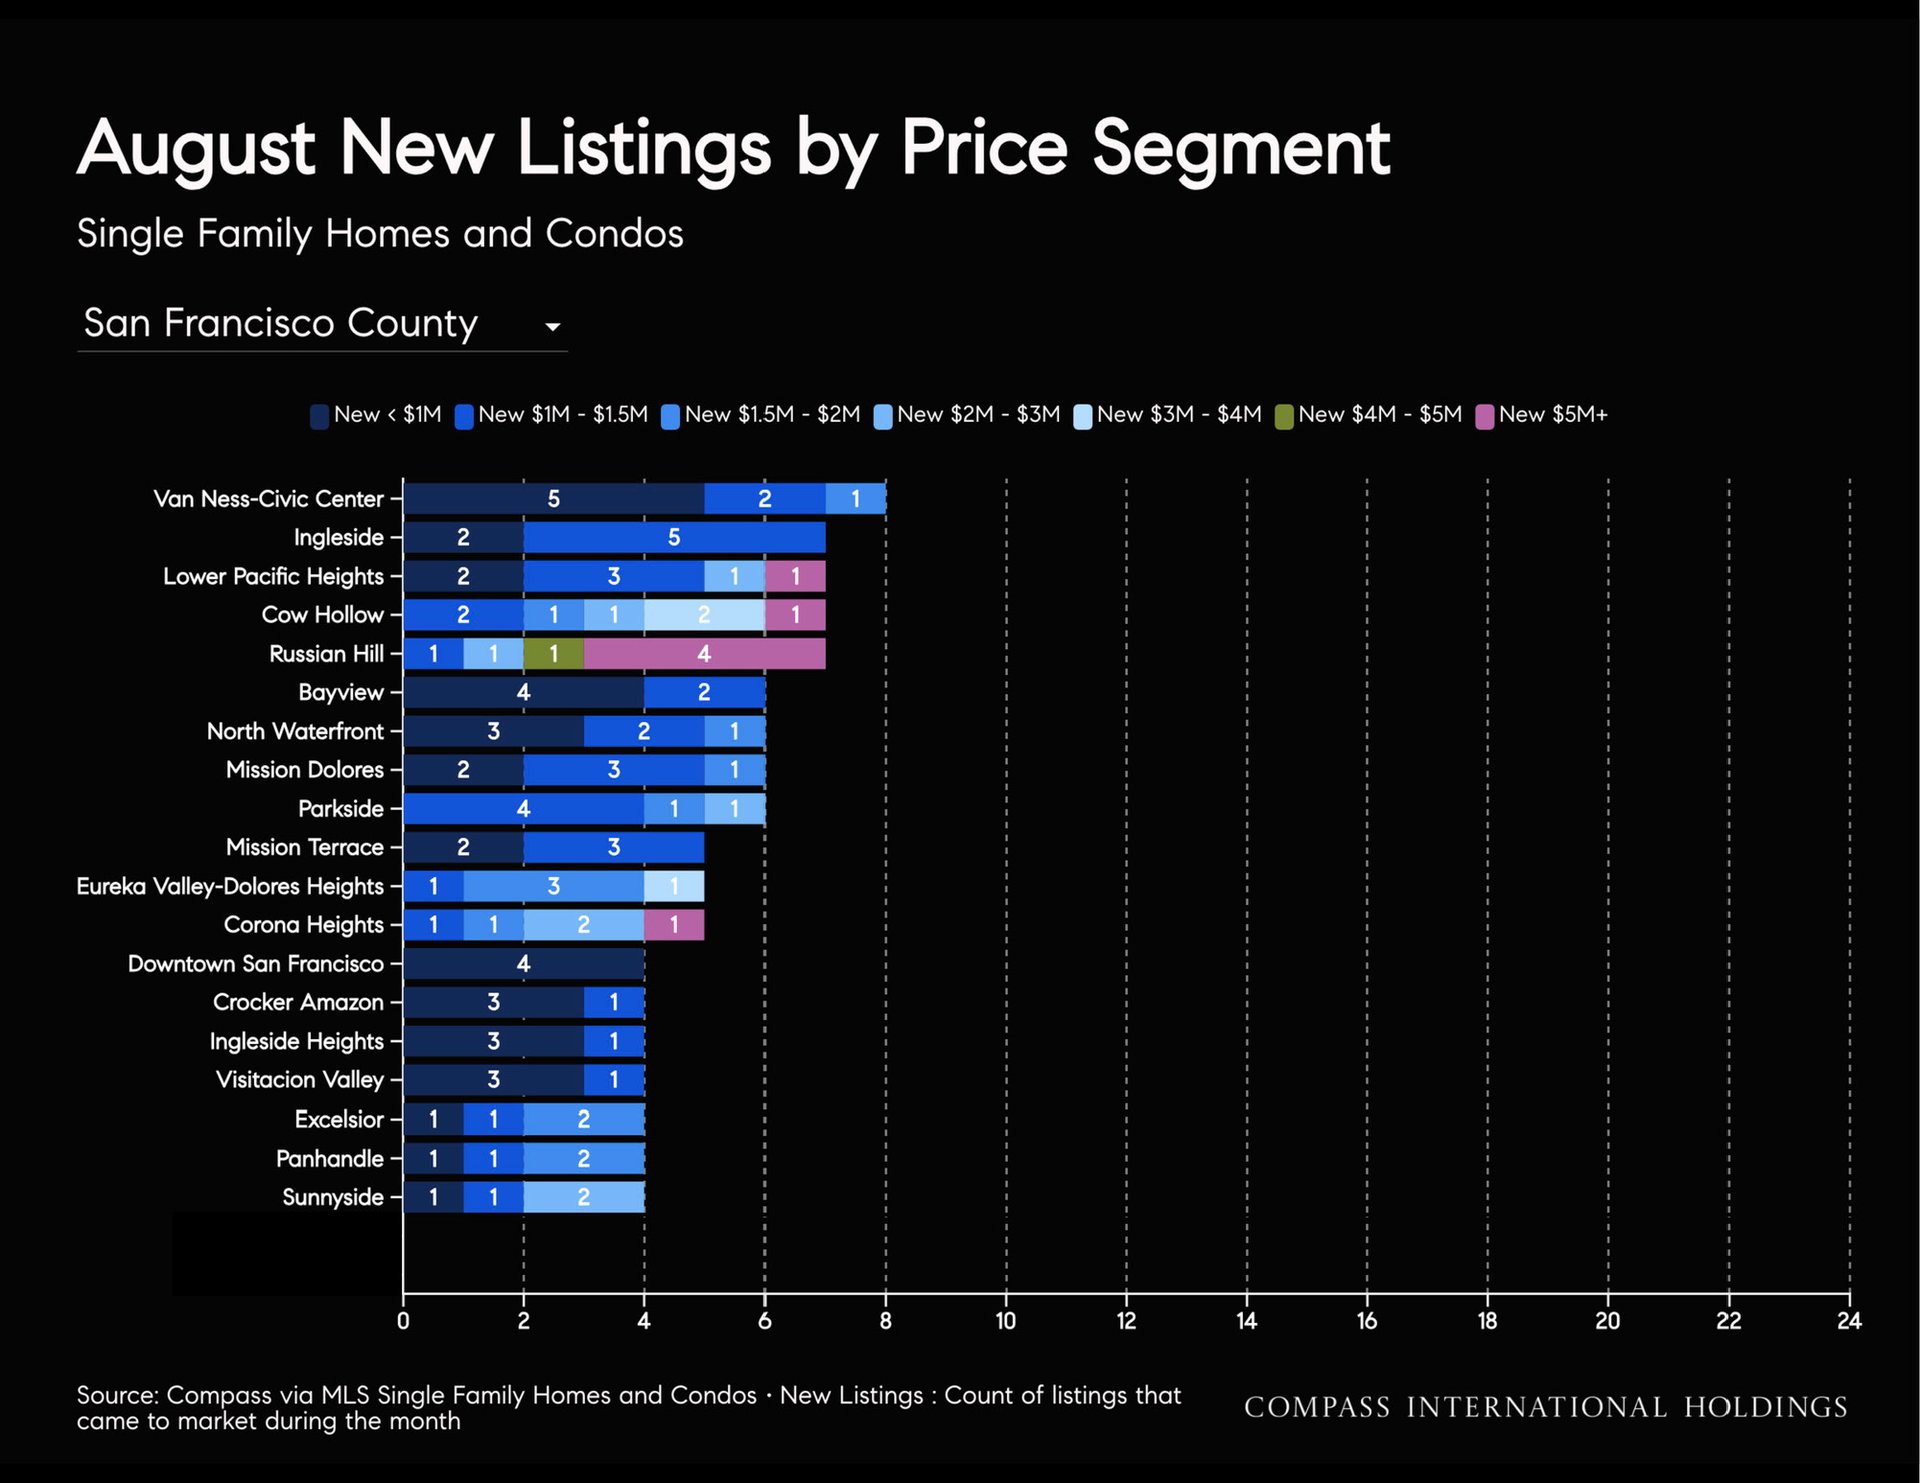
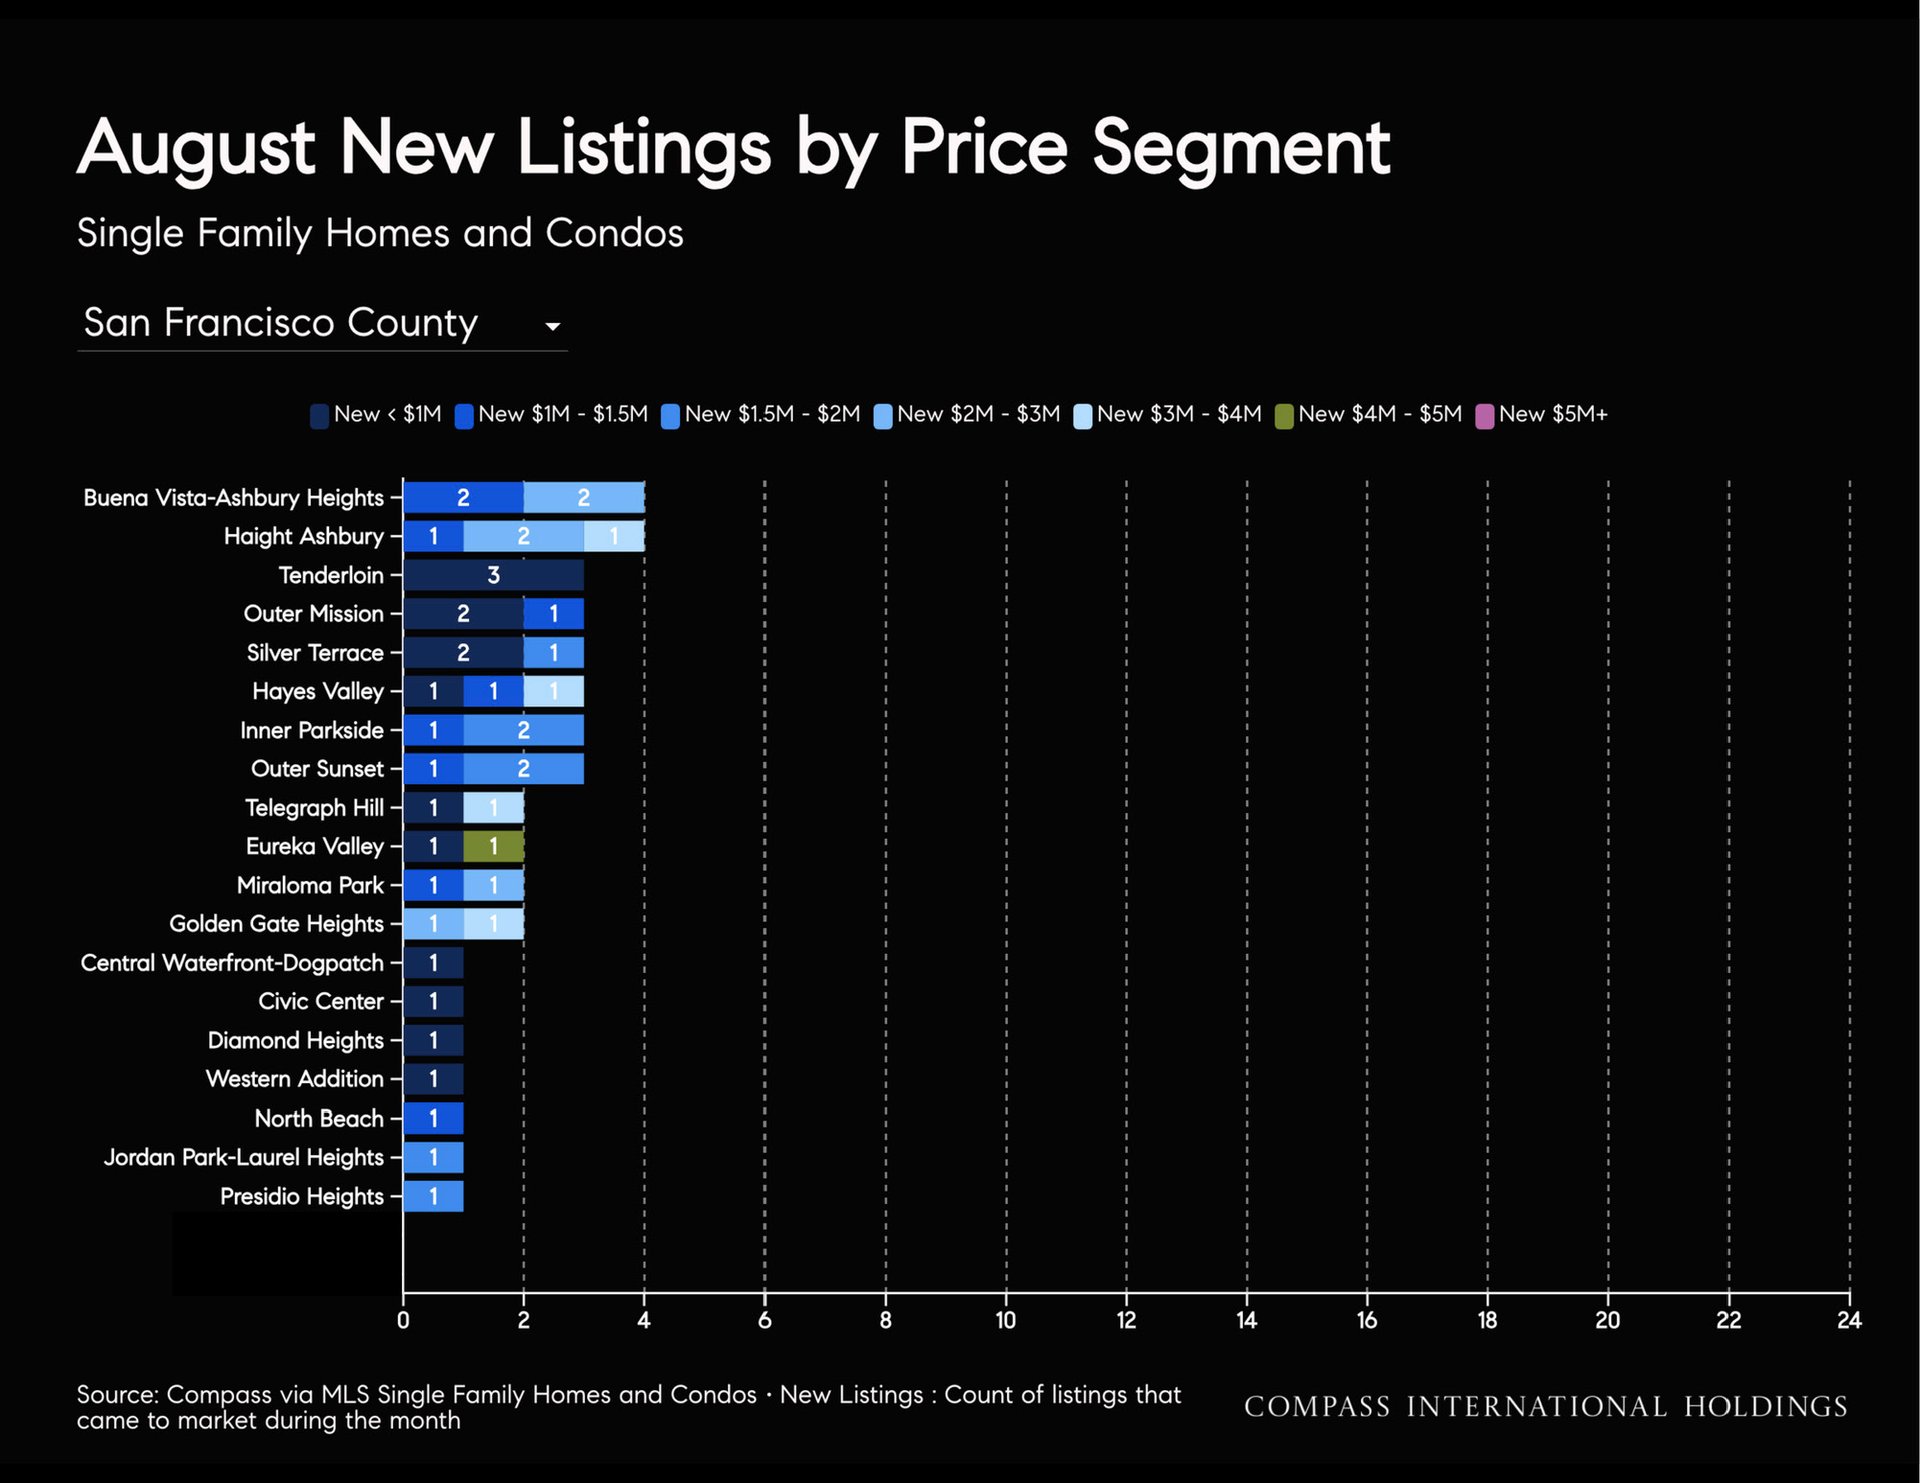
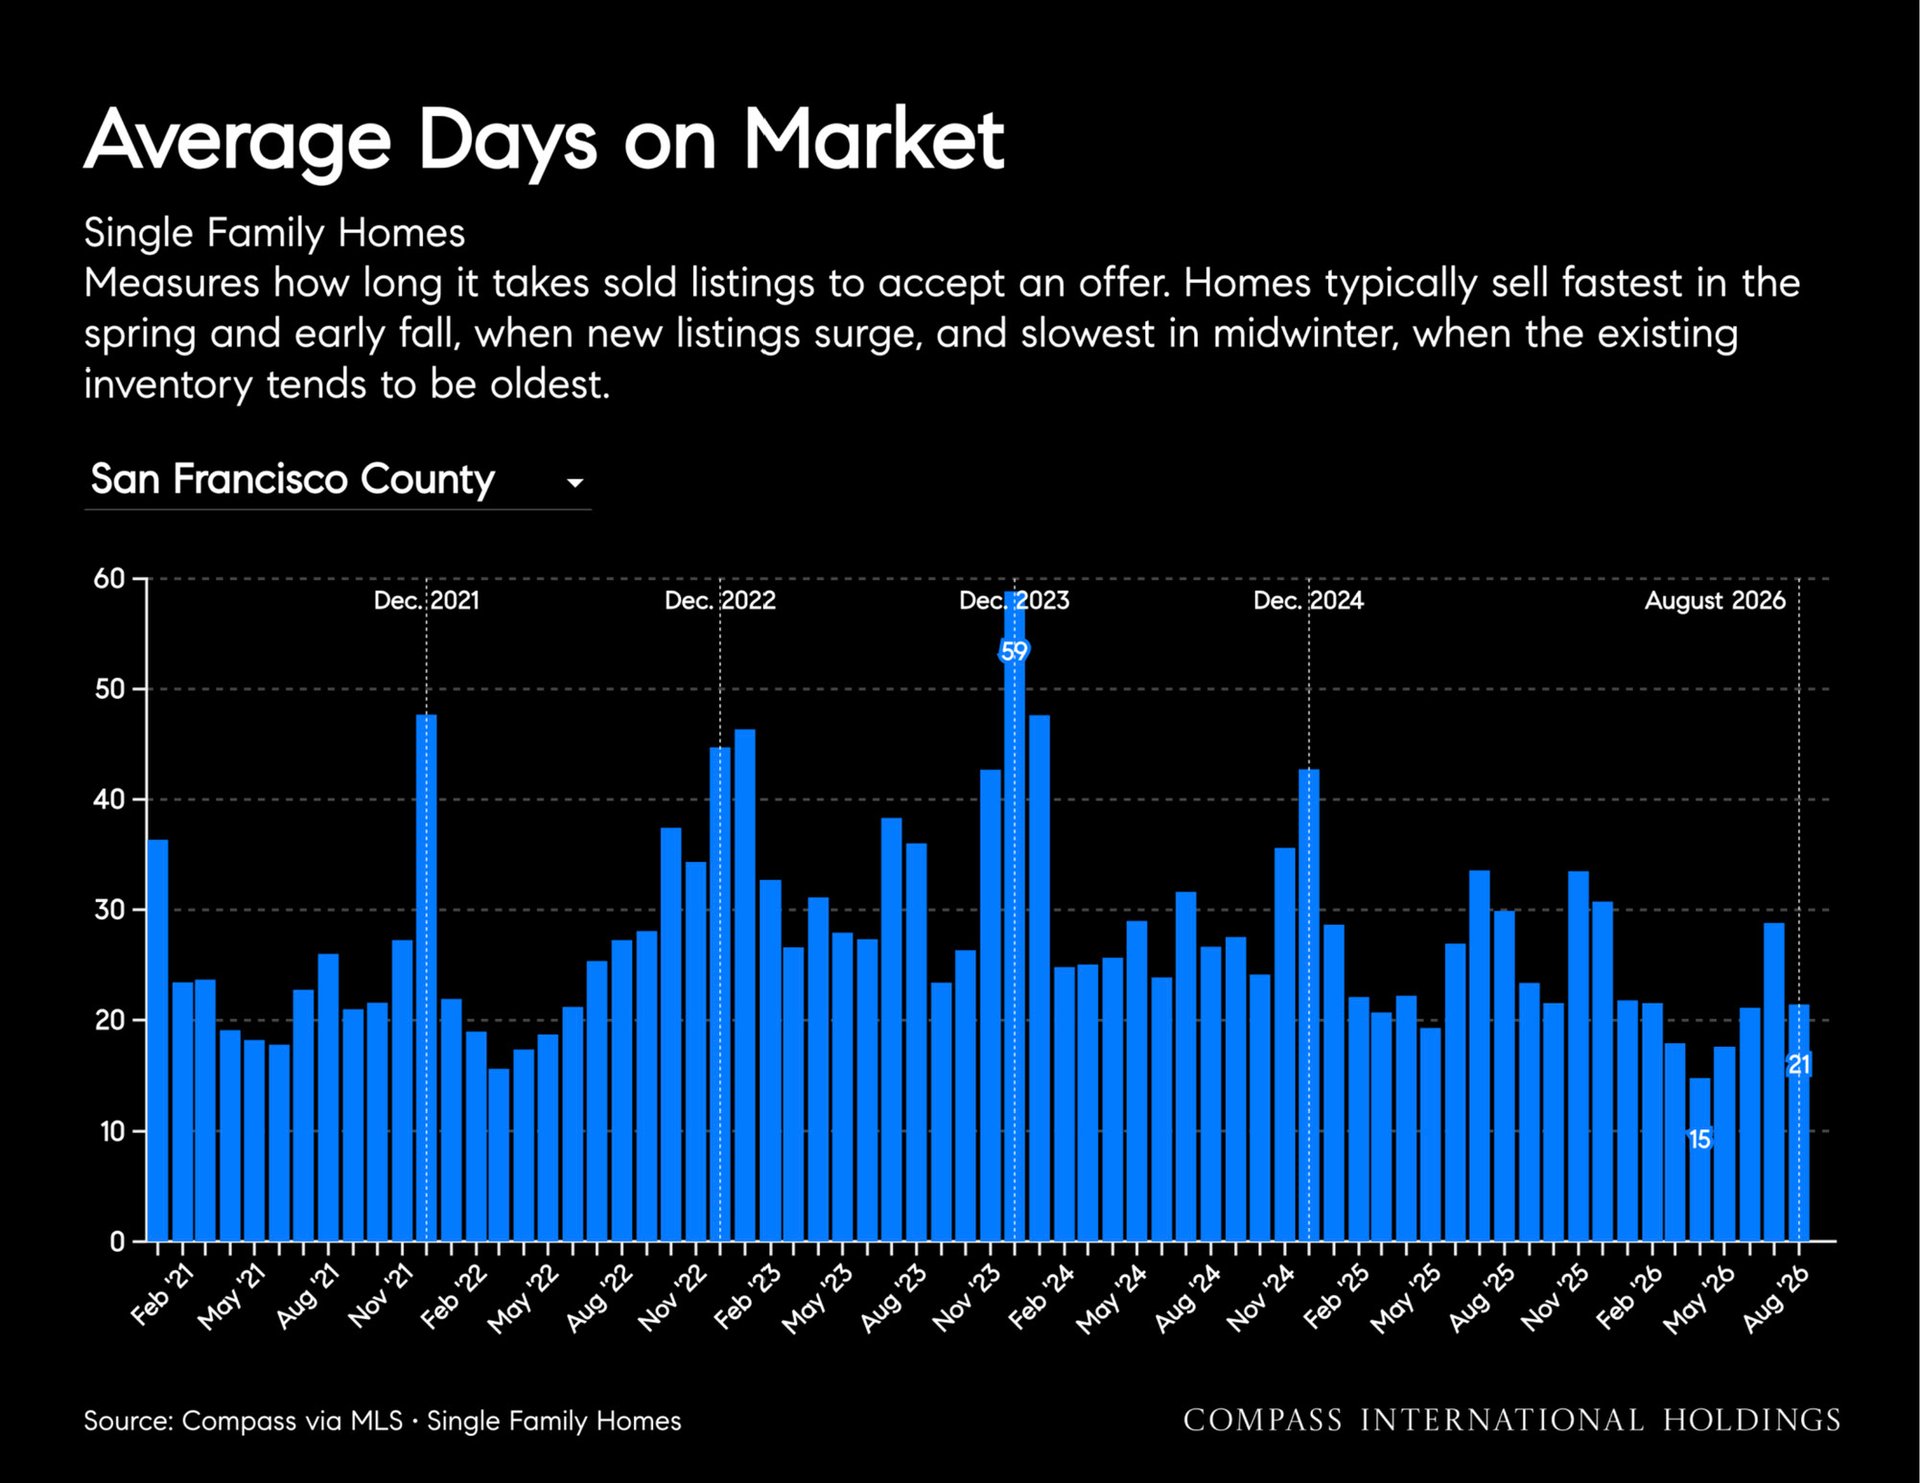
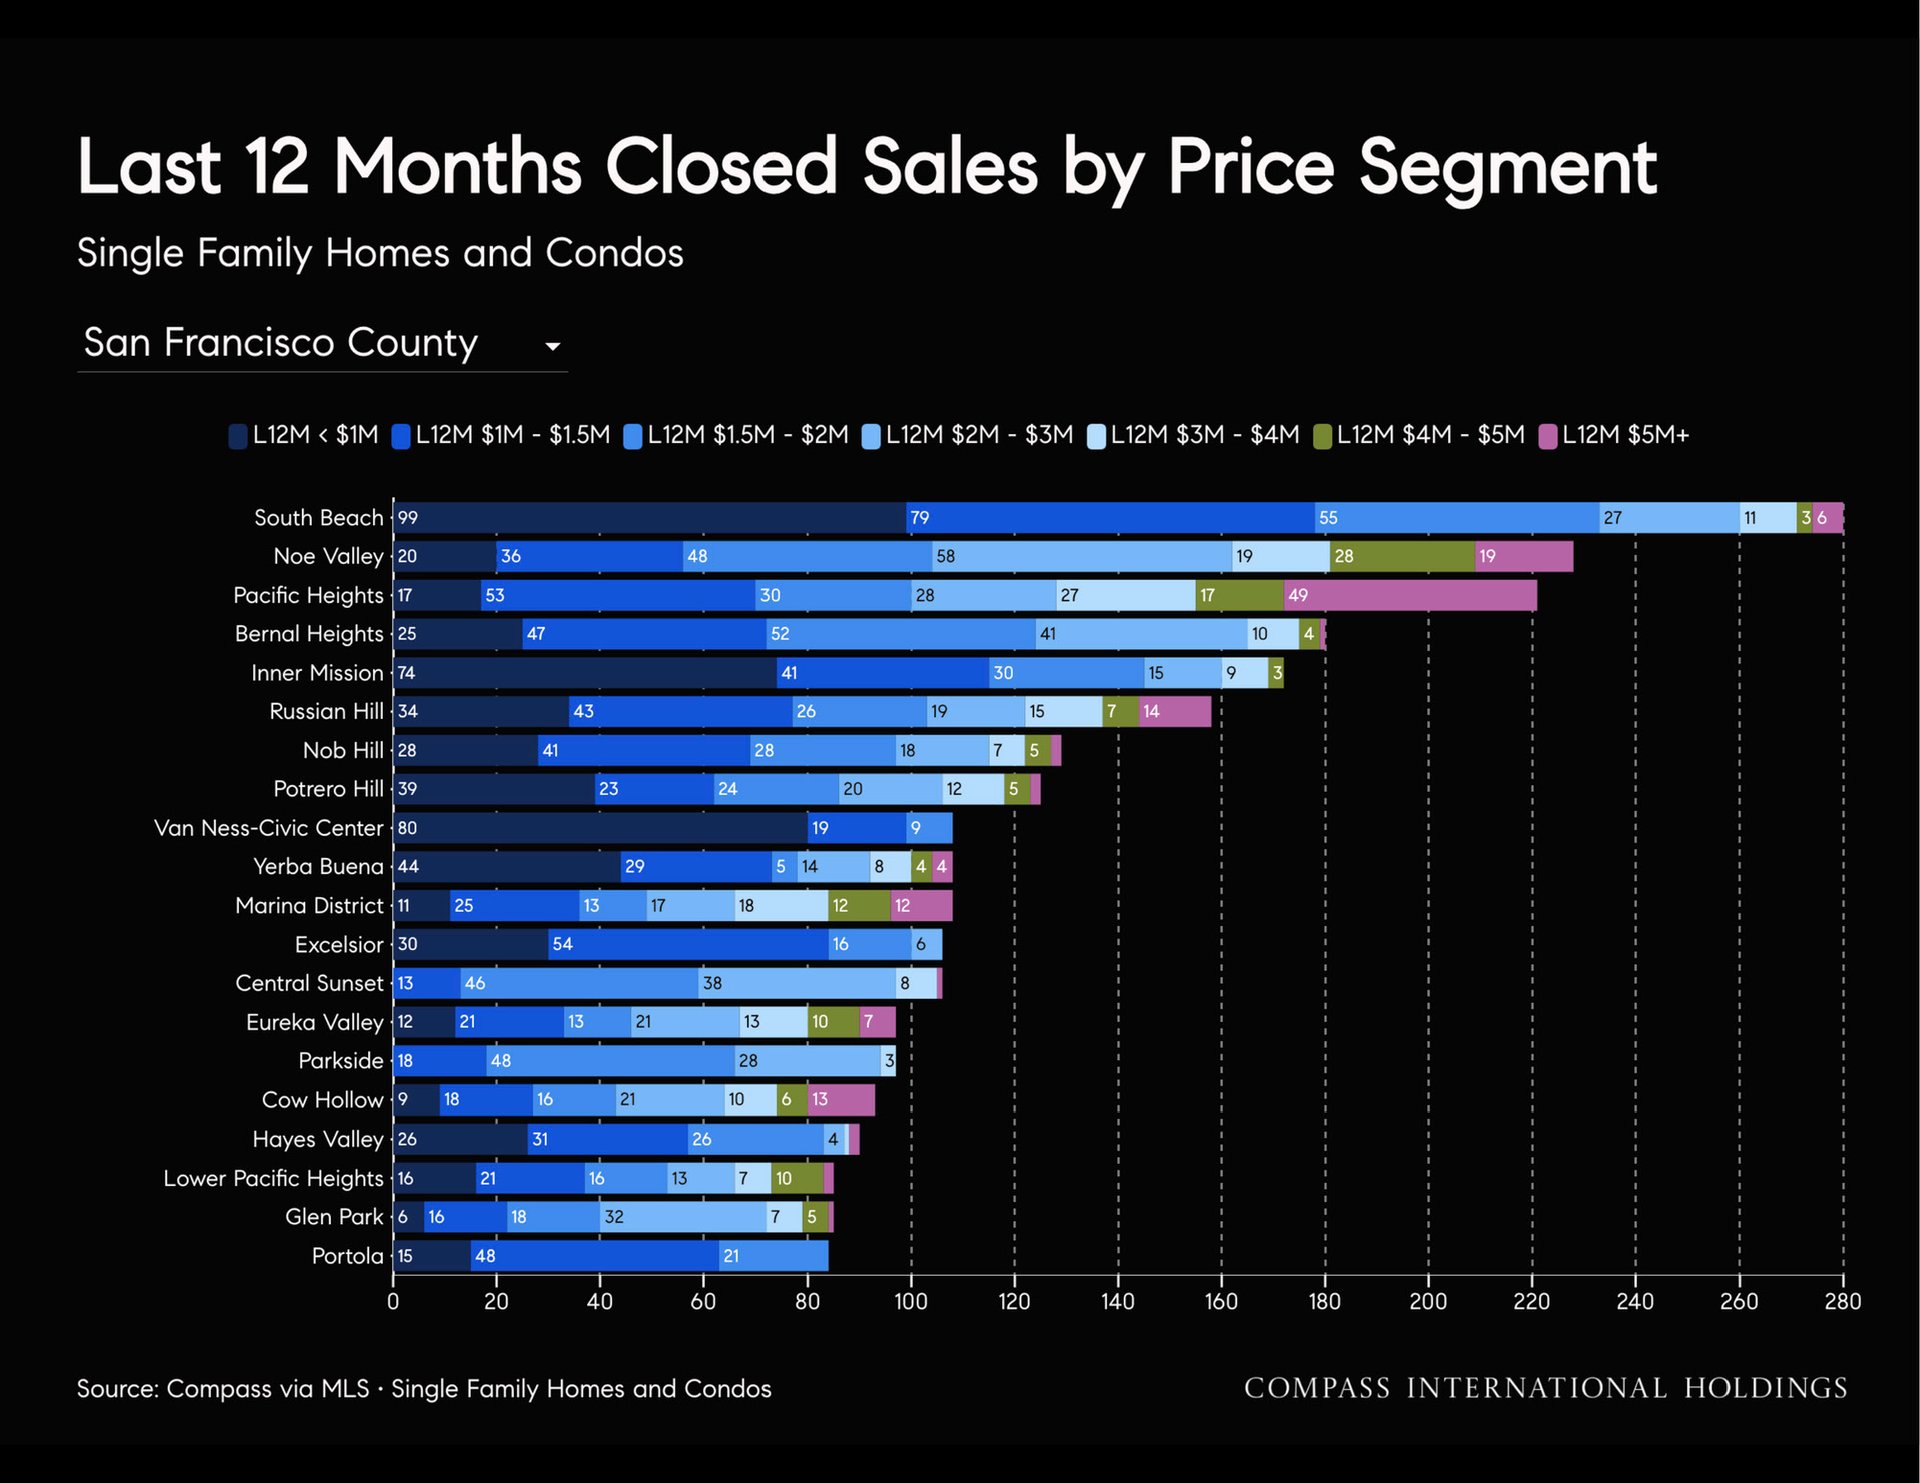
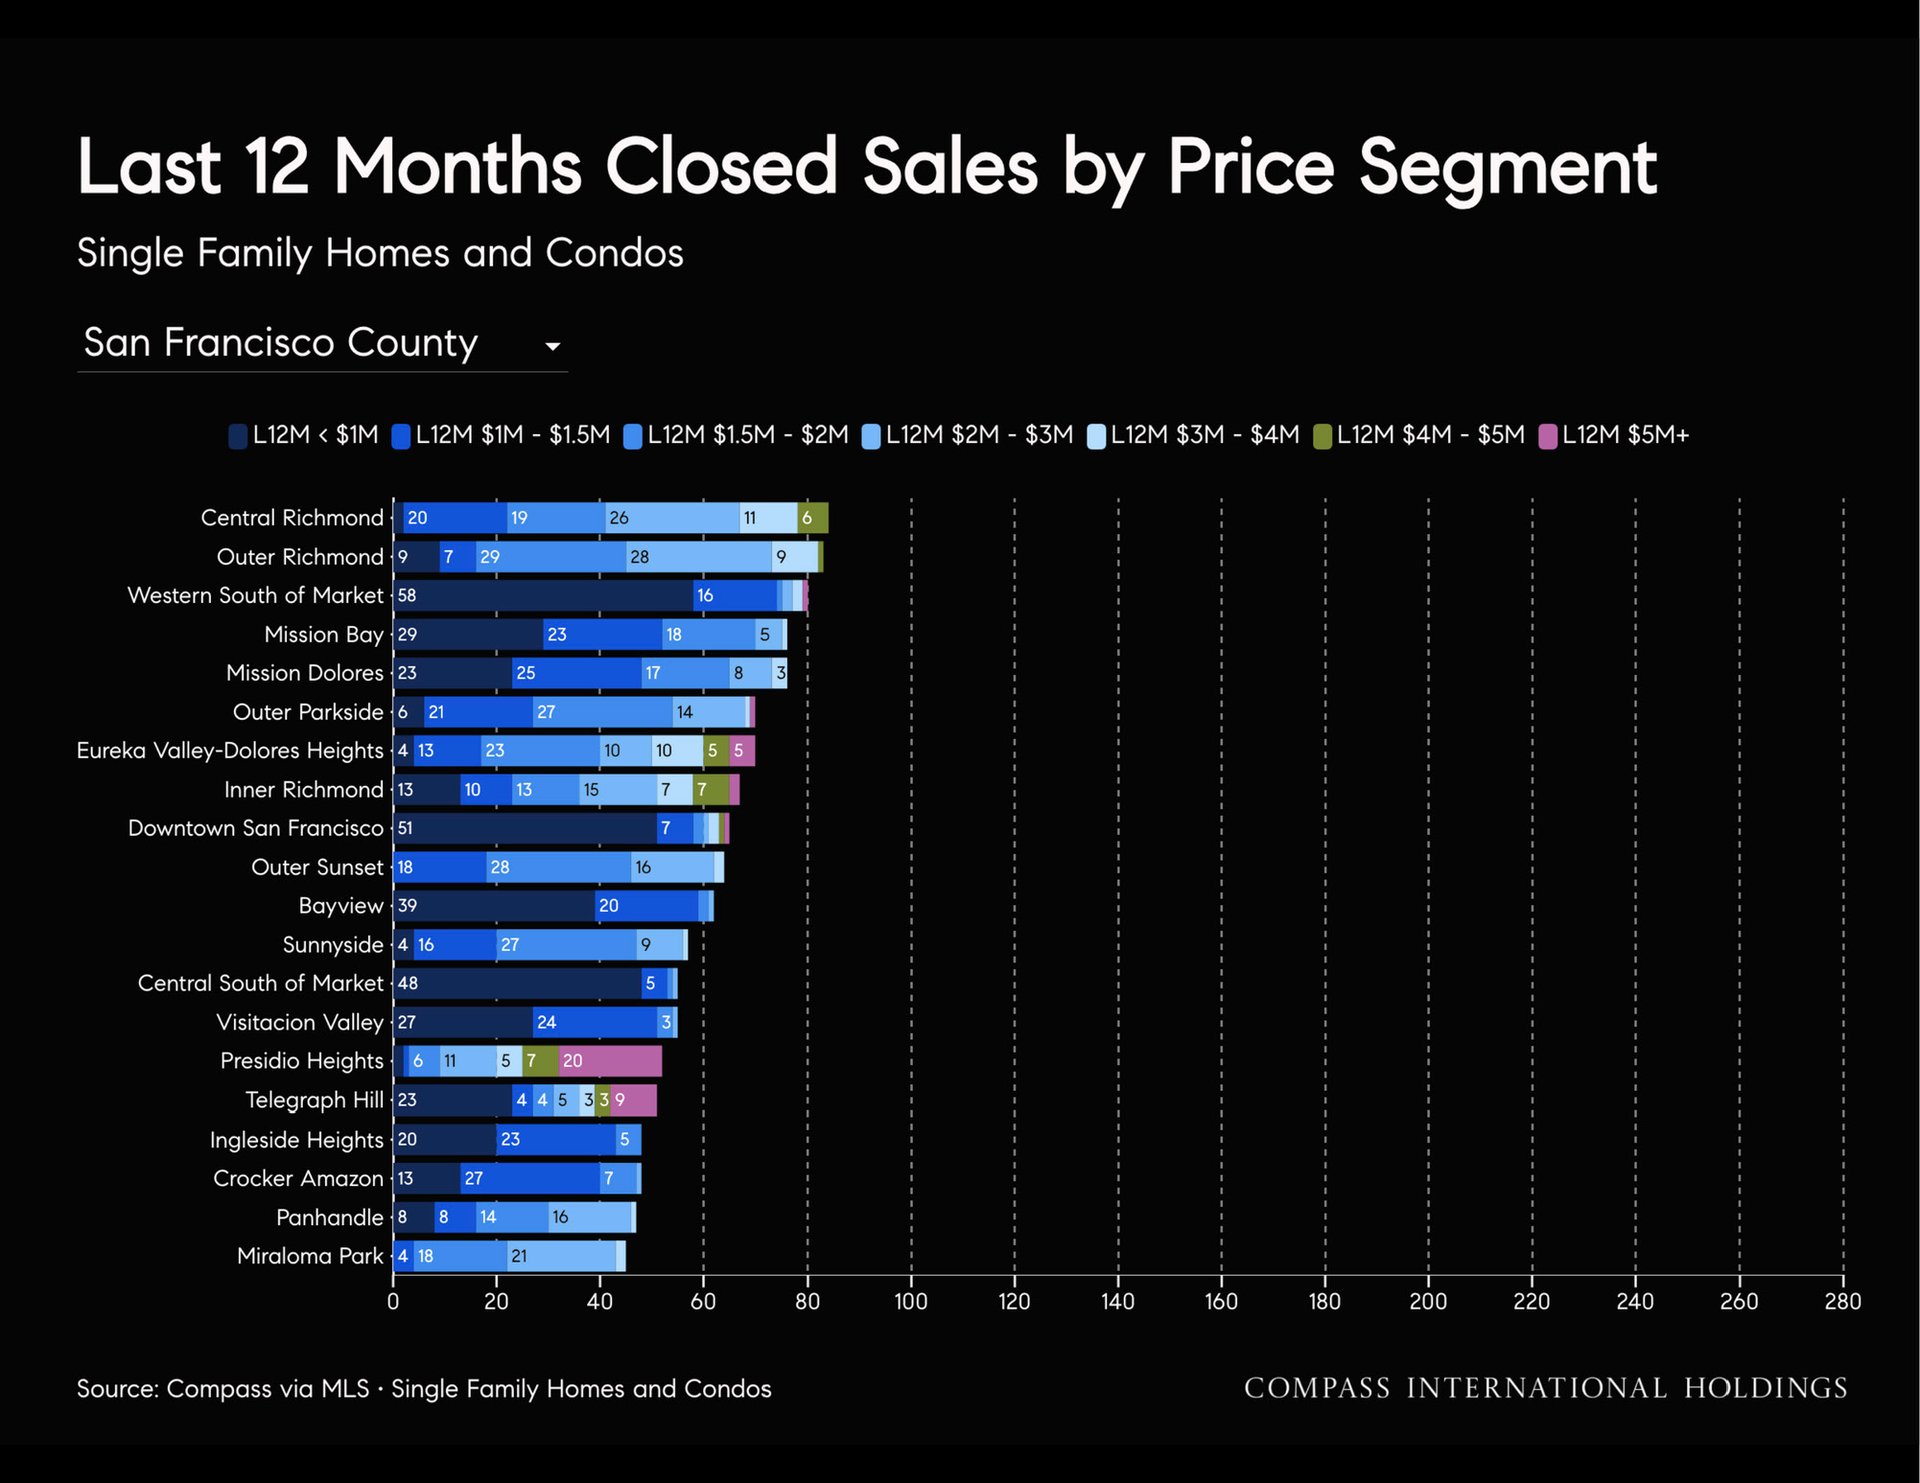
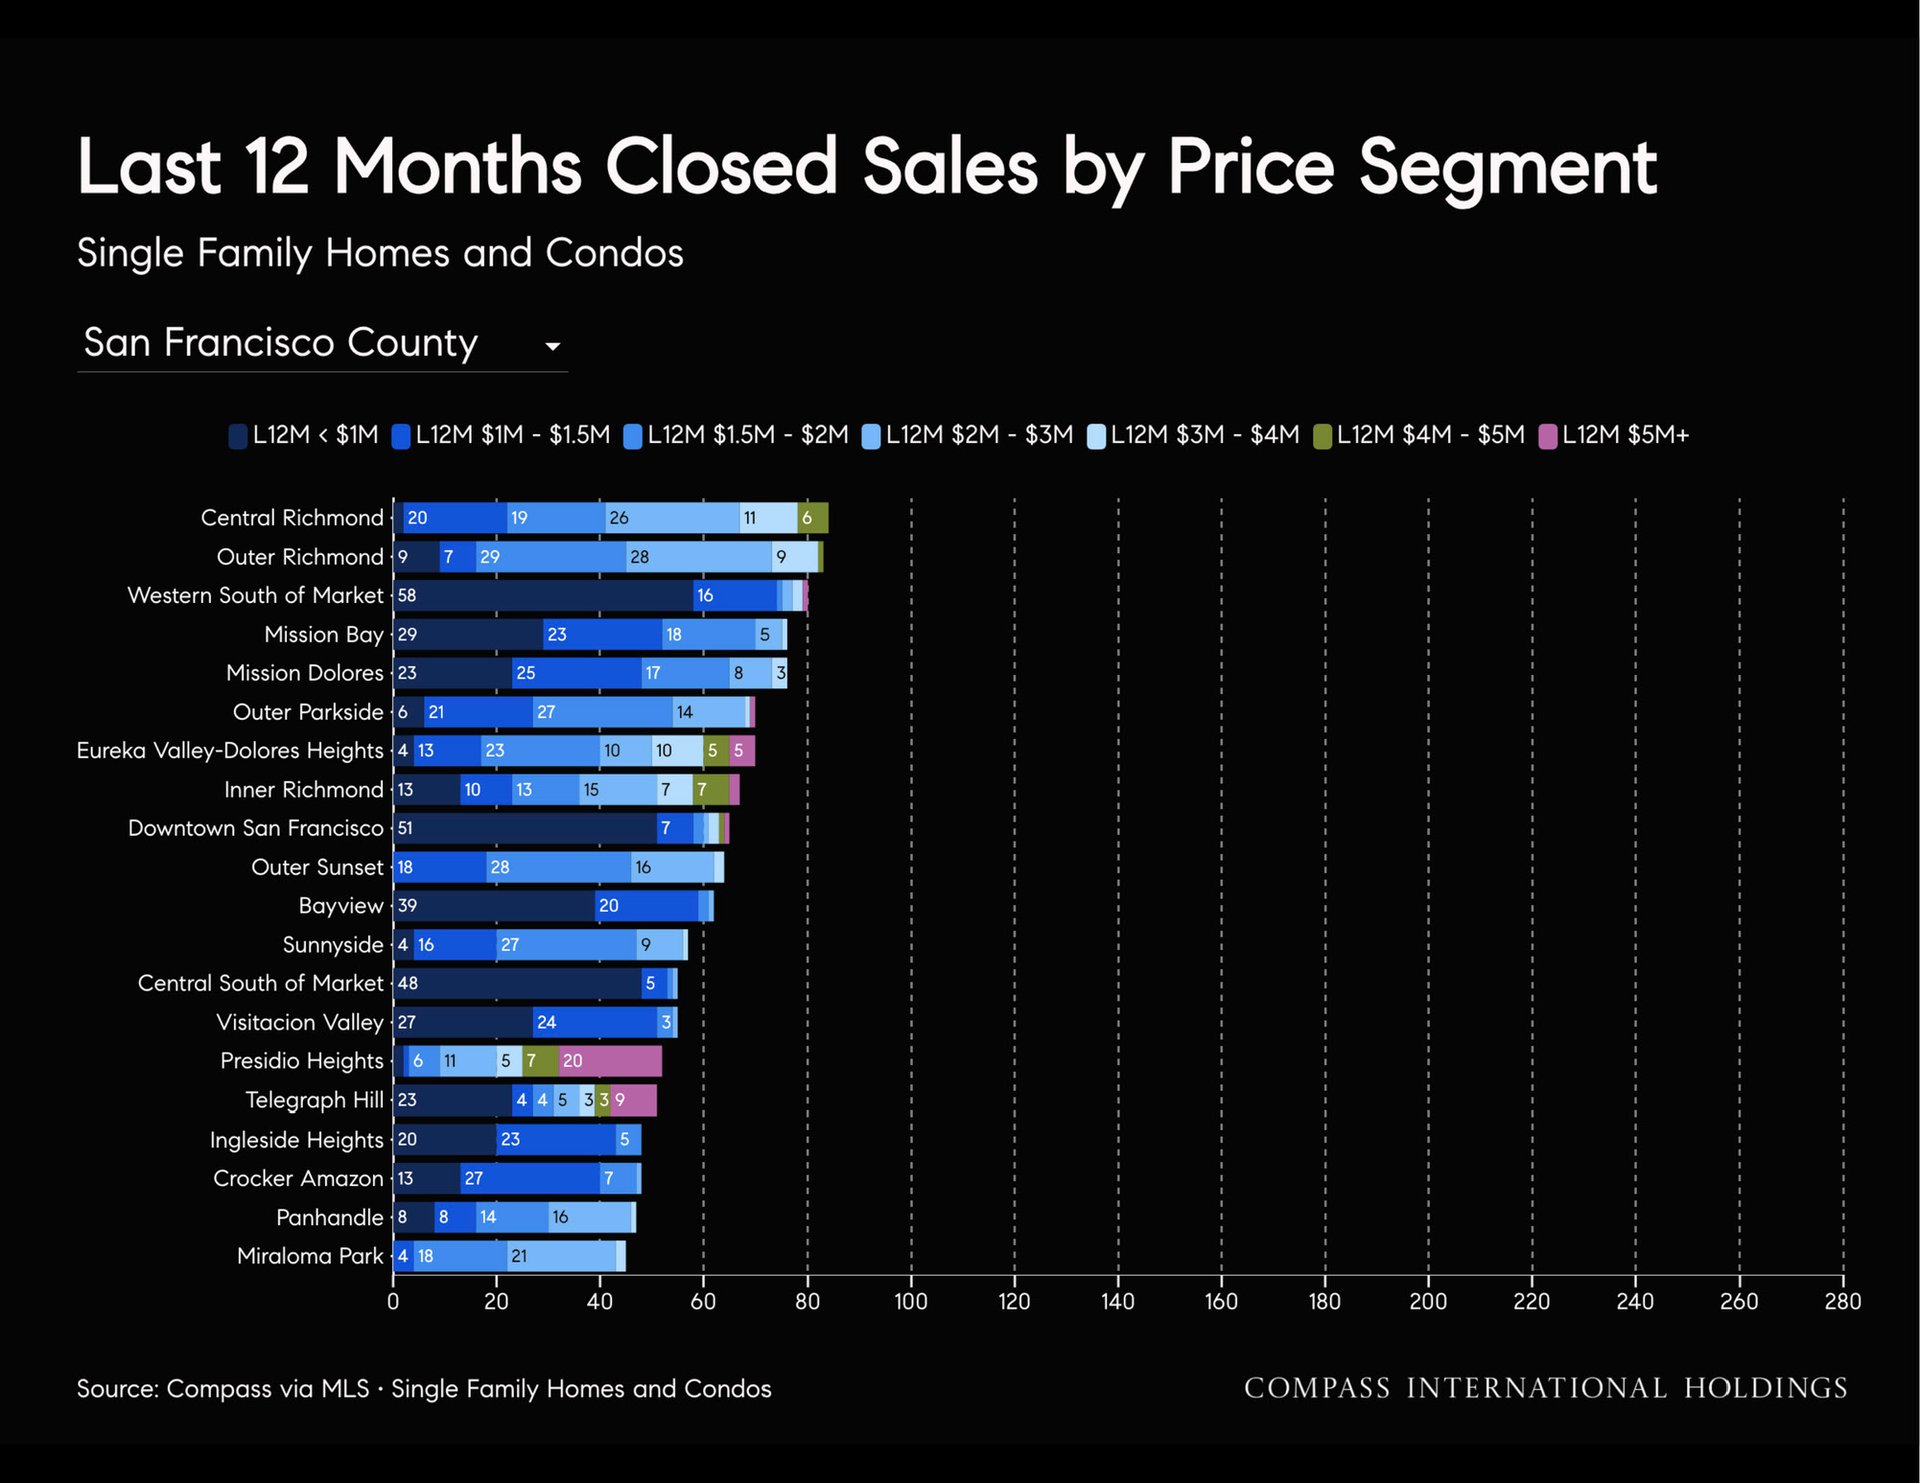
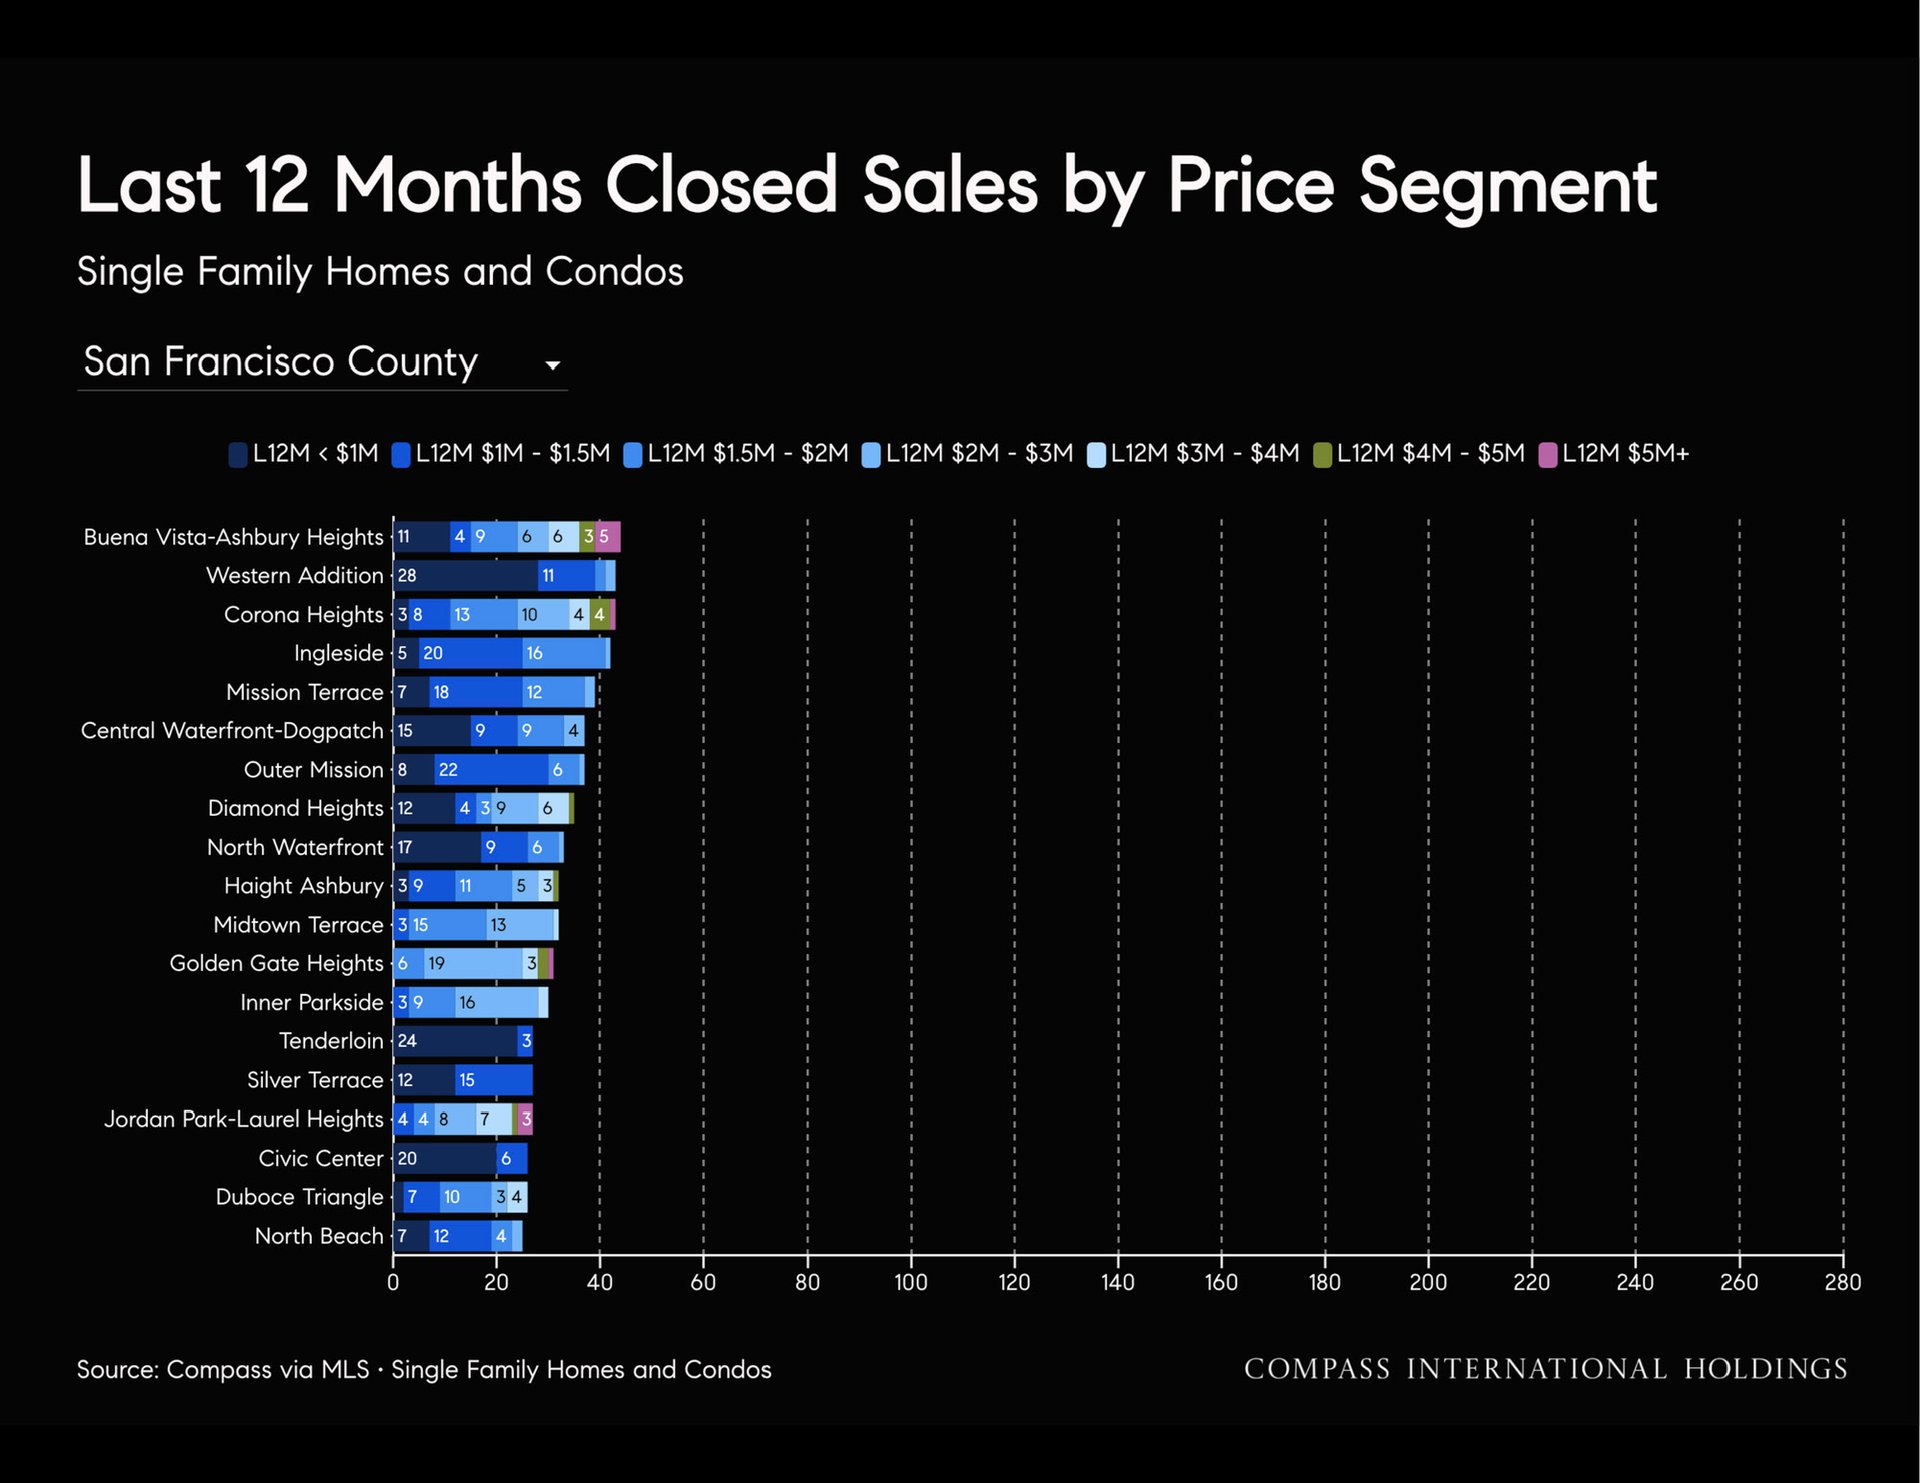
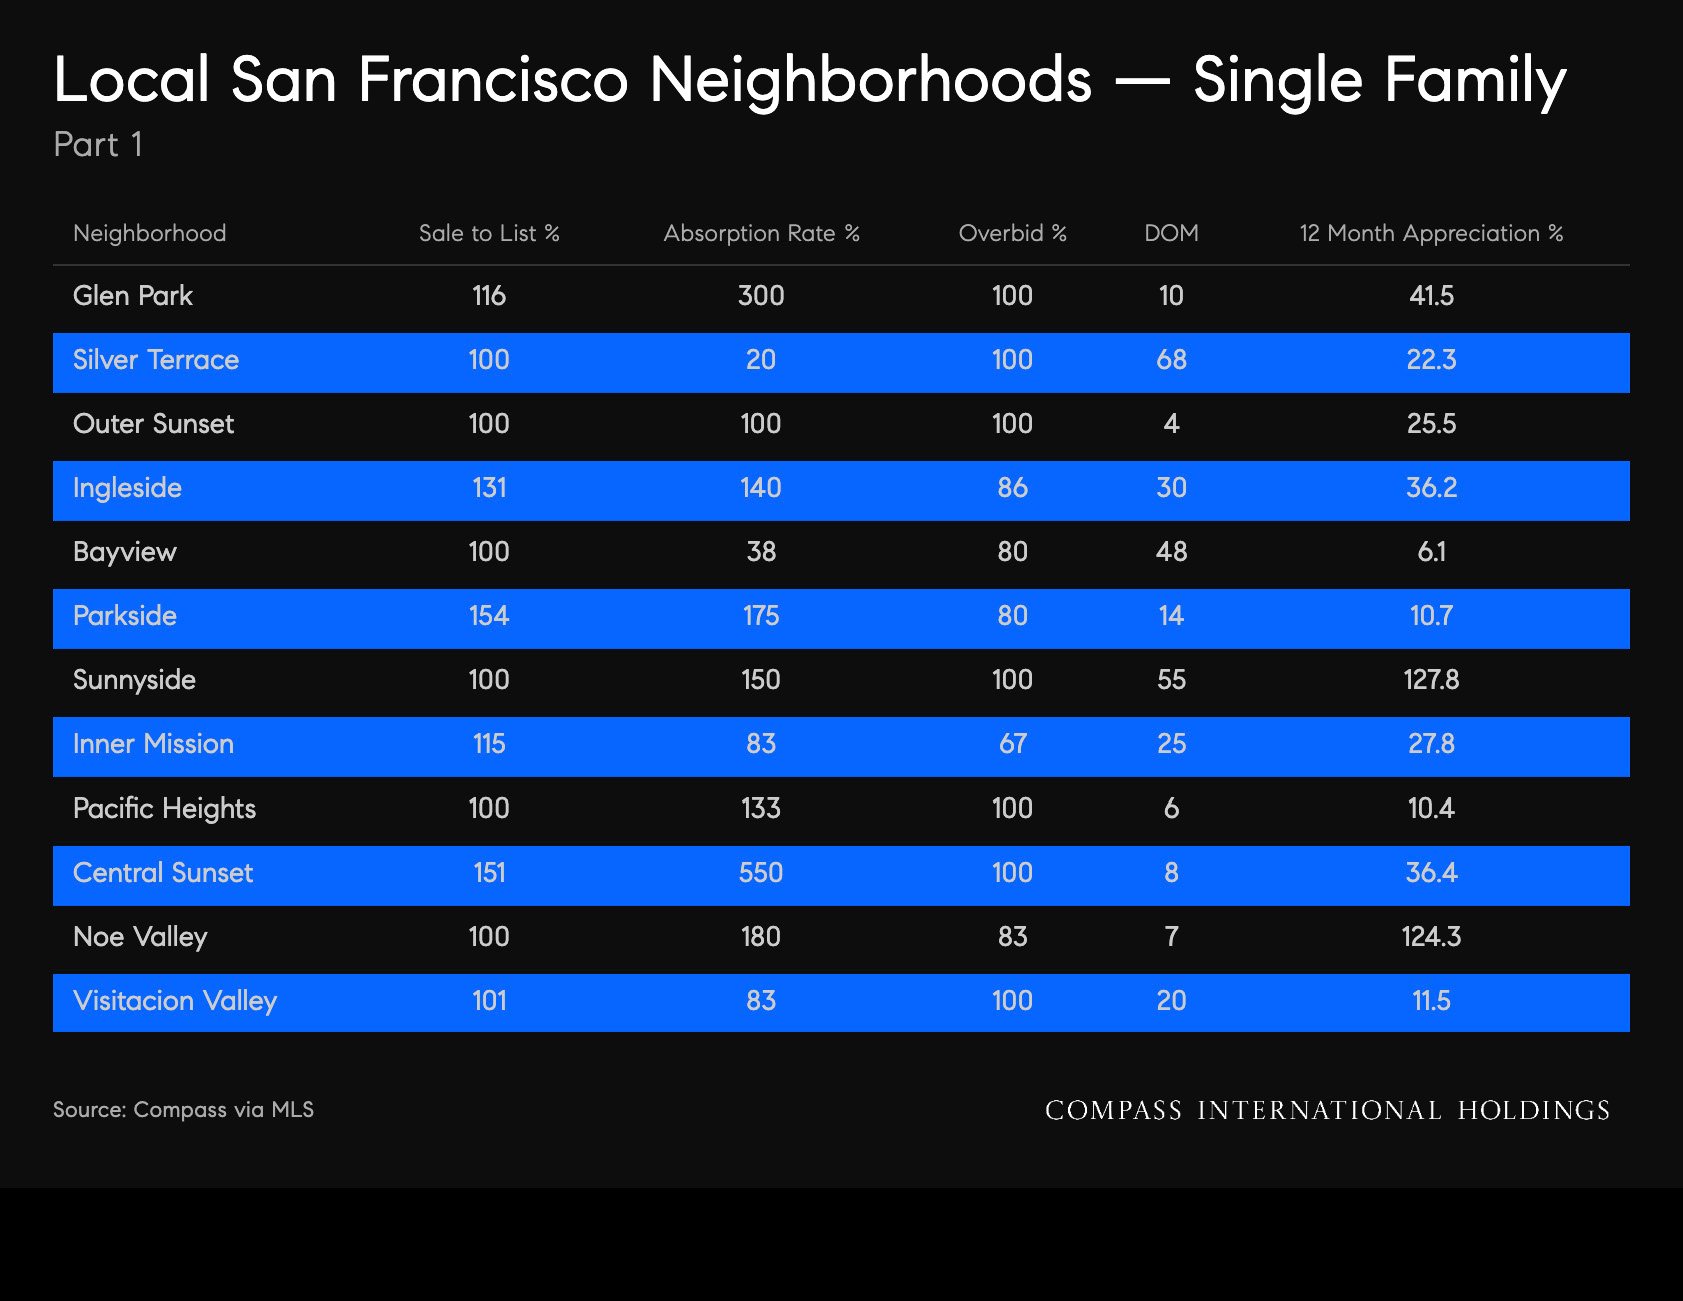
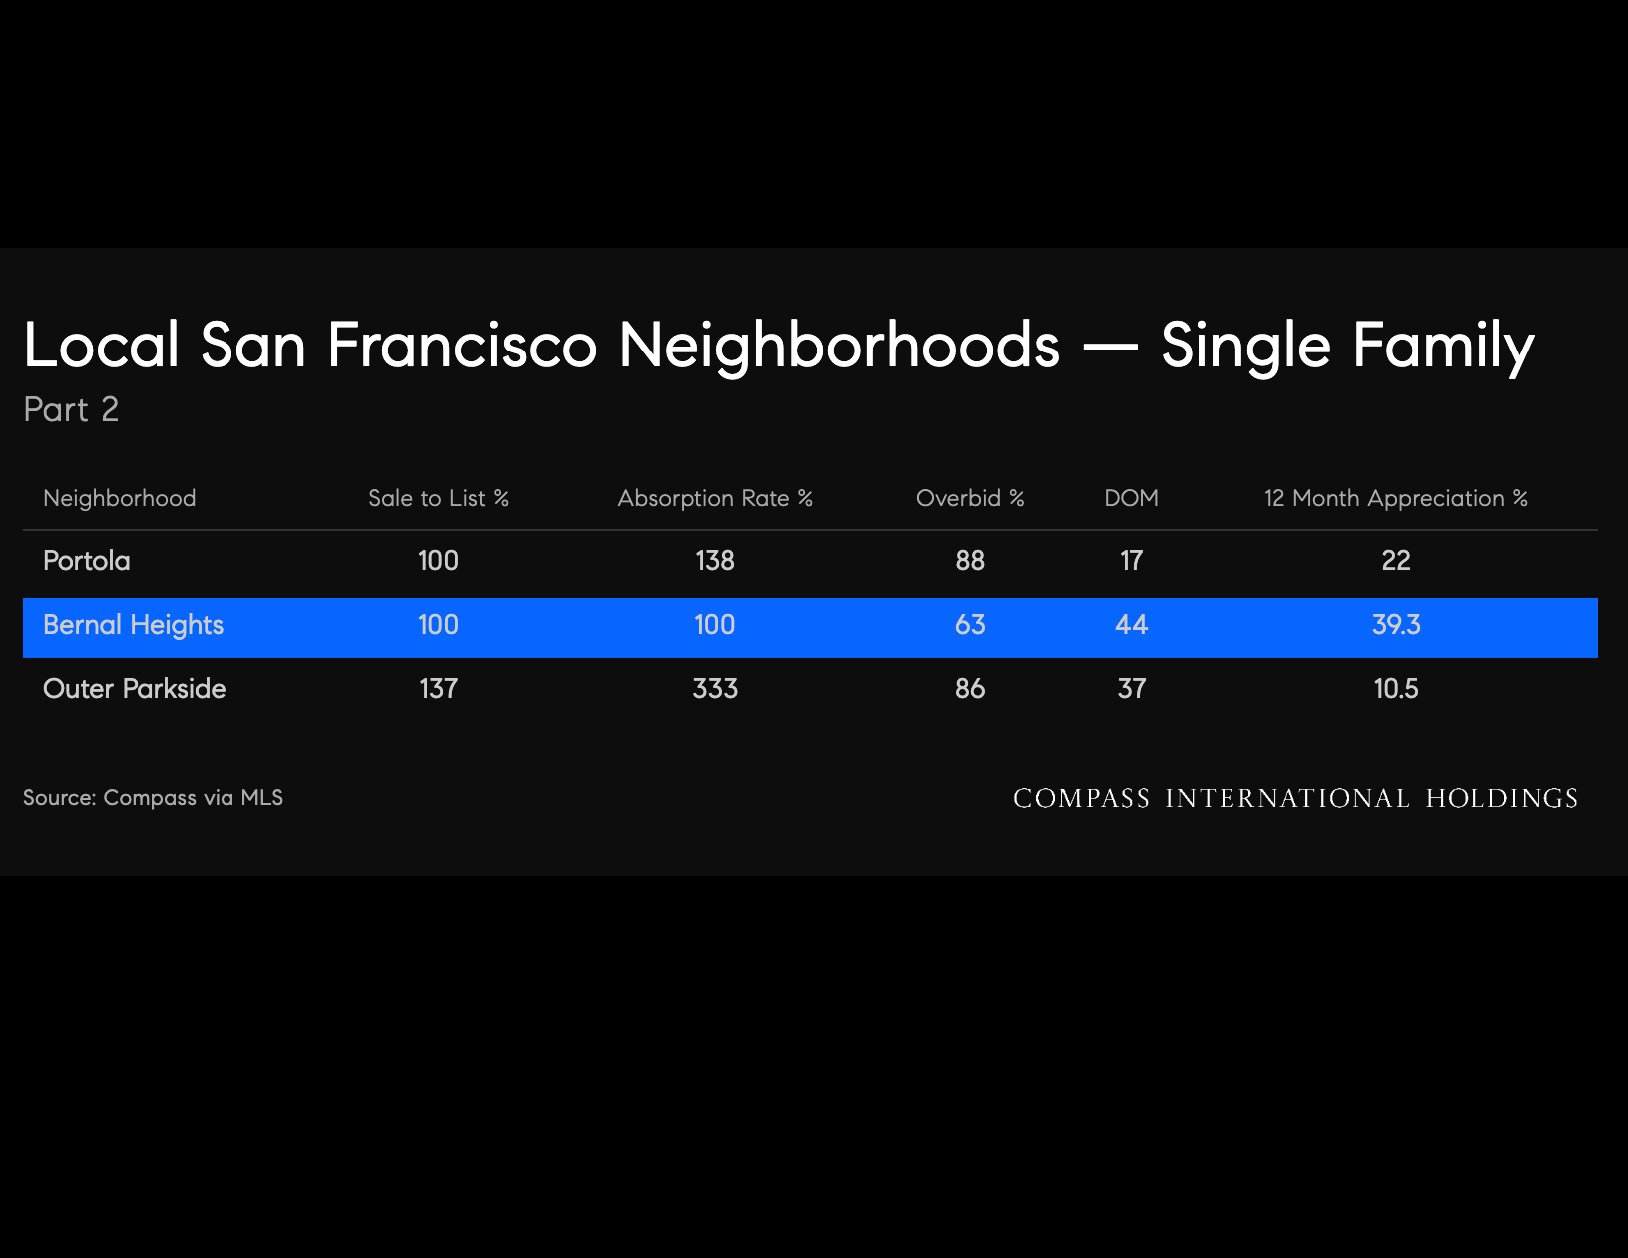
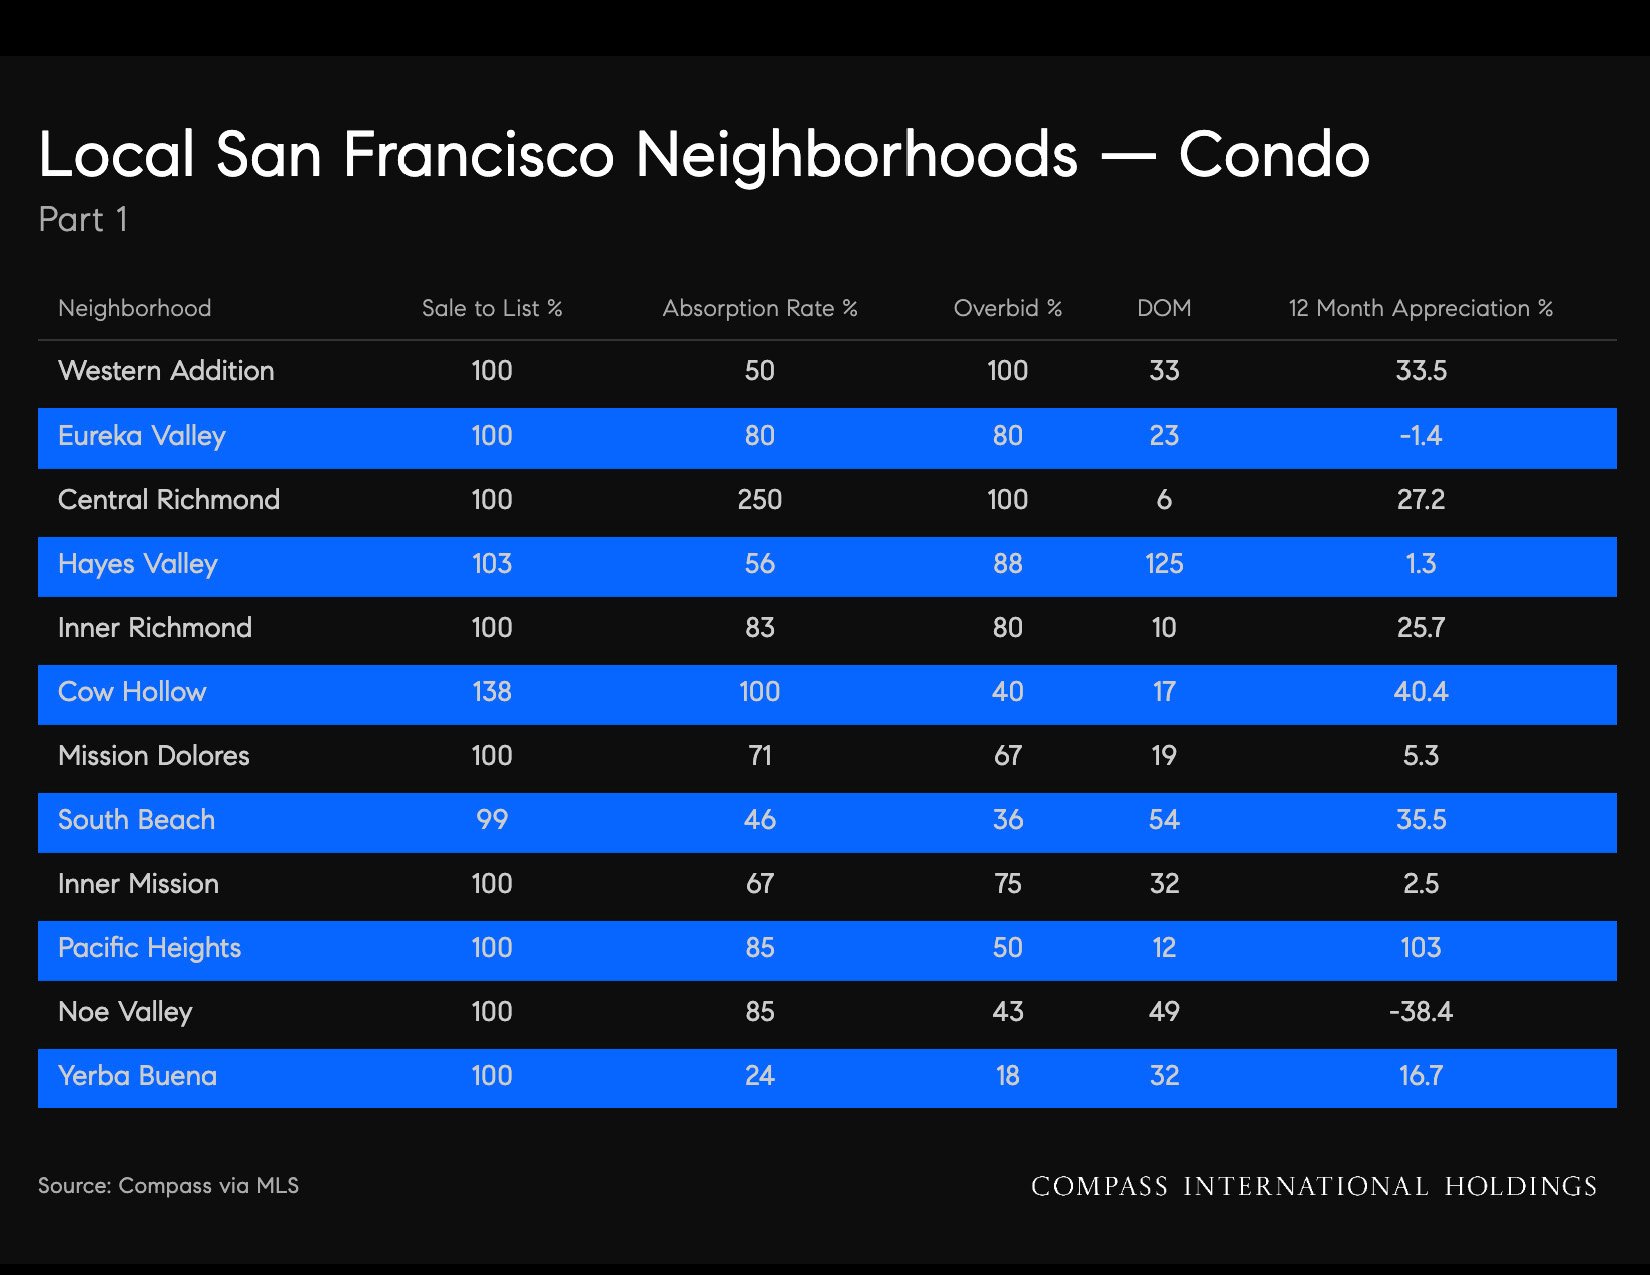
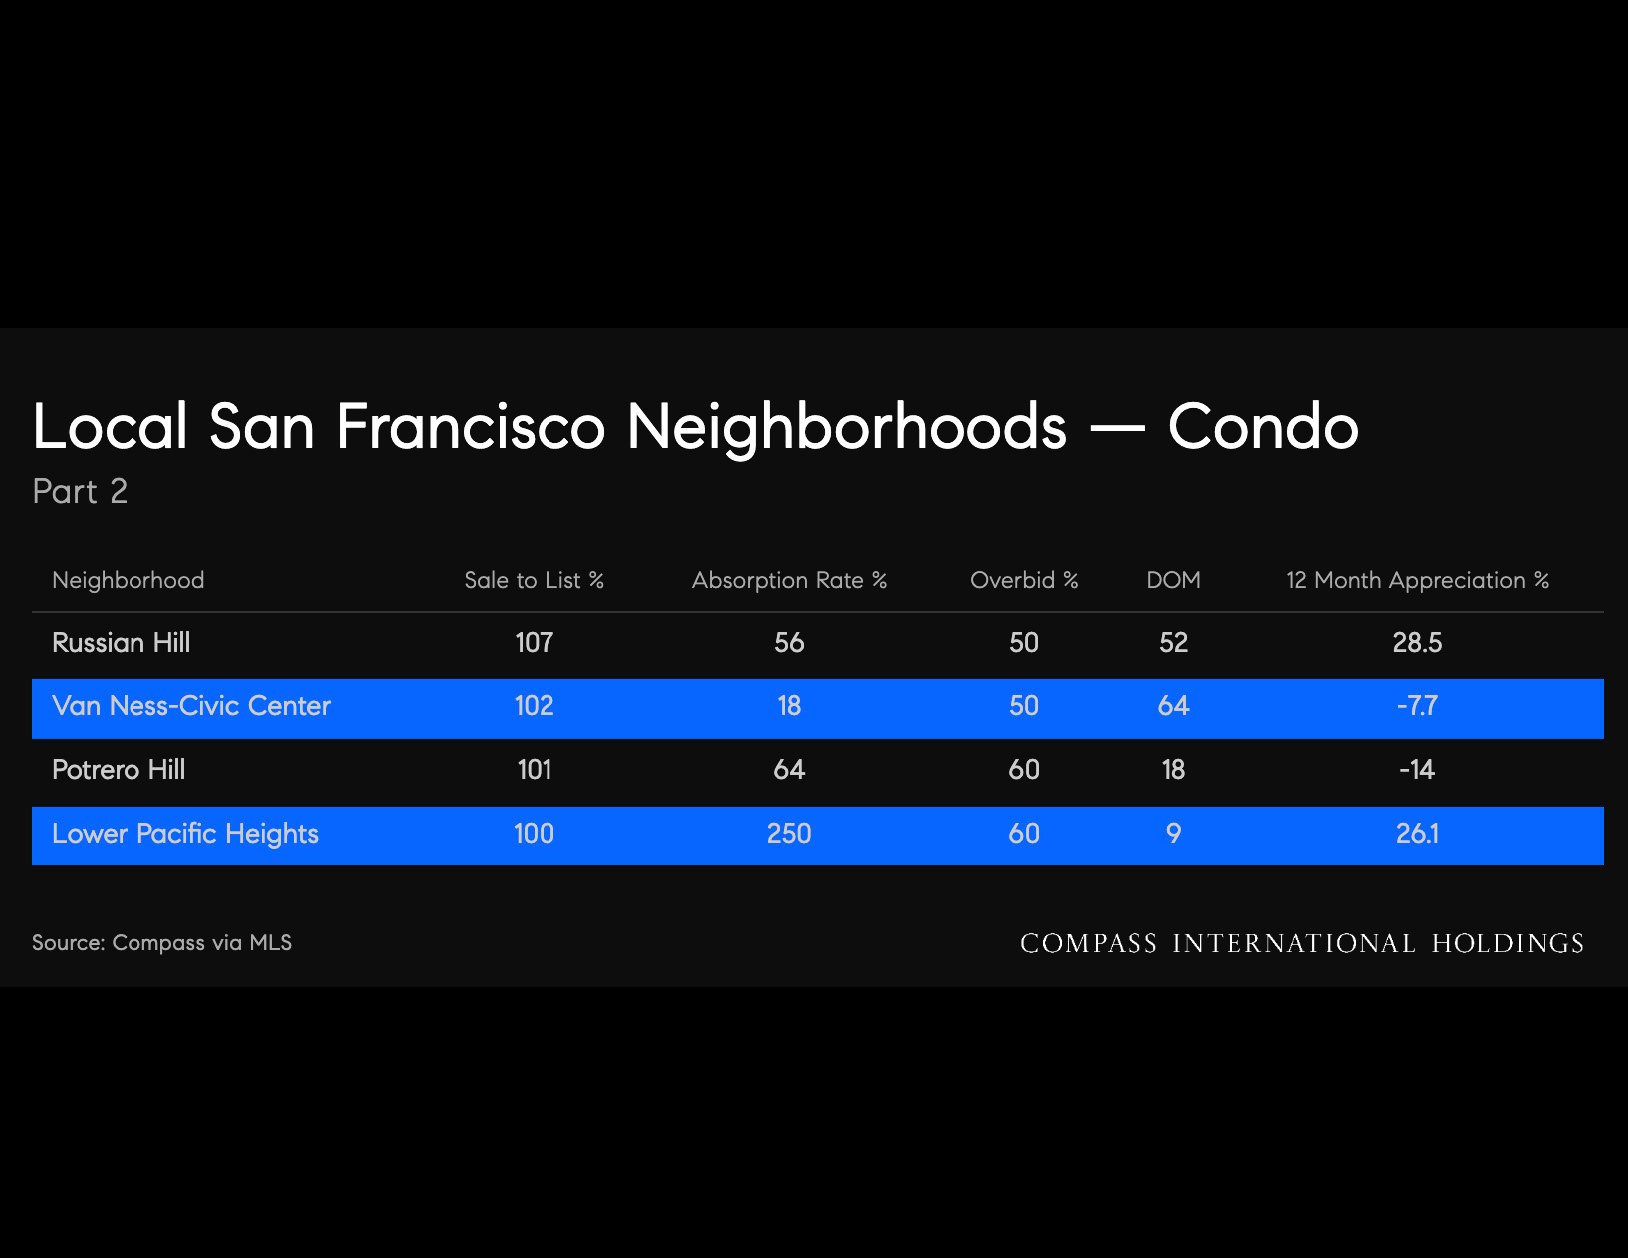
Data quality. San Francisco closed 150 single-family sales and 218 condo sales in August—strong bases for both cohorts. Single-family data are reliable. Condo data (218 closings) are robust for county-level analysis. However, the report notes that no single San Francisco neighborhood cleared ten single-family closings in both August 2026 and August 2025; neighborhood-level detail is condo-only and should not be read as a complete neighborhood market picture. Inventory collapse. San Francisco's active inventory fell 35% year-over-year (570 combined listings) and 36% for condos (411 vs 642). This is the sharpest inventory decline in the region and is directional and real—the market tightened dramatically. The decline is consistent with the city's tight housing, high prices, and constrained supply. Price strength amid tightness. The condo median rose 22.3% ($1.23M vs $1.01M)—one of the largest YoY gains in the region. This suggests that despite lower inventory and slower sales (-23.5% MoM), prices held firm and climbed, a pattern consistent with sustained demand overwhelming tight supply. Do not interpret lower sales velocity as weak demand; interpret it as a thin market where fewer deals transact at higher prices. Single-family scarcity. Single-family closed sales fell 35% YoY (150 vs 232), and the median rose 4% to $1.755M. Days-on-market fell from 35 to 27 days—faster liquidity despite lower volume. This is consistent with a high-priced, low-volume market where scarcity and wealth concentrate demand. Neighborhood complexity. San Francisco's 59 neighborhoods vary sharply in composition, price, and character. Aggregate metrics mask this dispersion. The condo-only neighborhood analysis is more reliable than county totals for understanding micro-markets. Omissions. Single-family neighborhood analysis are avoided due to insufficient closings; only condo neighborhoods meet the 10 closing per month threshold. This reflects the city's composition: most single-family sales are custom/renovation properties, fewer in number but larger in price. Condo sales are higher-volume. Guidance. San Francisco's tightening inventory and price strength are genuine. The sales-velocity decline does not indicate weakness—it reflects a constrained market. Use the condo neighborhood data for granular analysis; treat the county single-family figures as indices of a small, expensive market.
9/20/2026, 2:59:16 PM
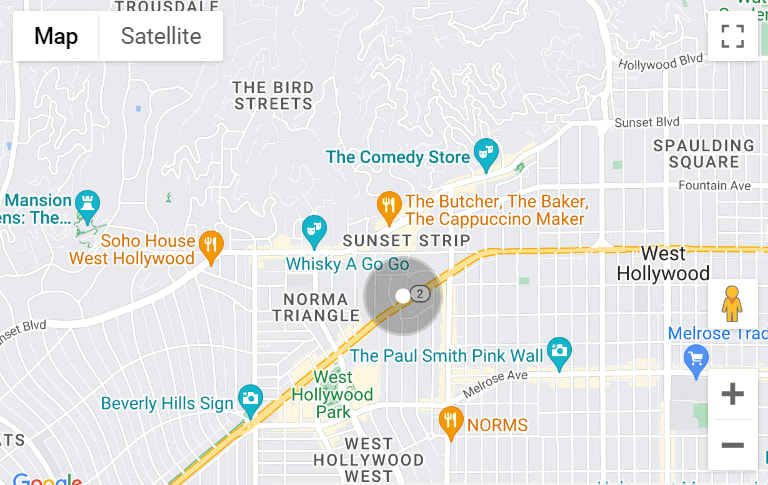
Address
891 Beach Street
San Francisco, CA 94109
Sabrina Gee-Shin | CA DRE# 01457747
Embrace SF Team