Blog

San Francisco 2025 August Market Update

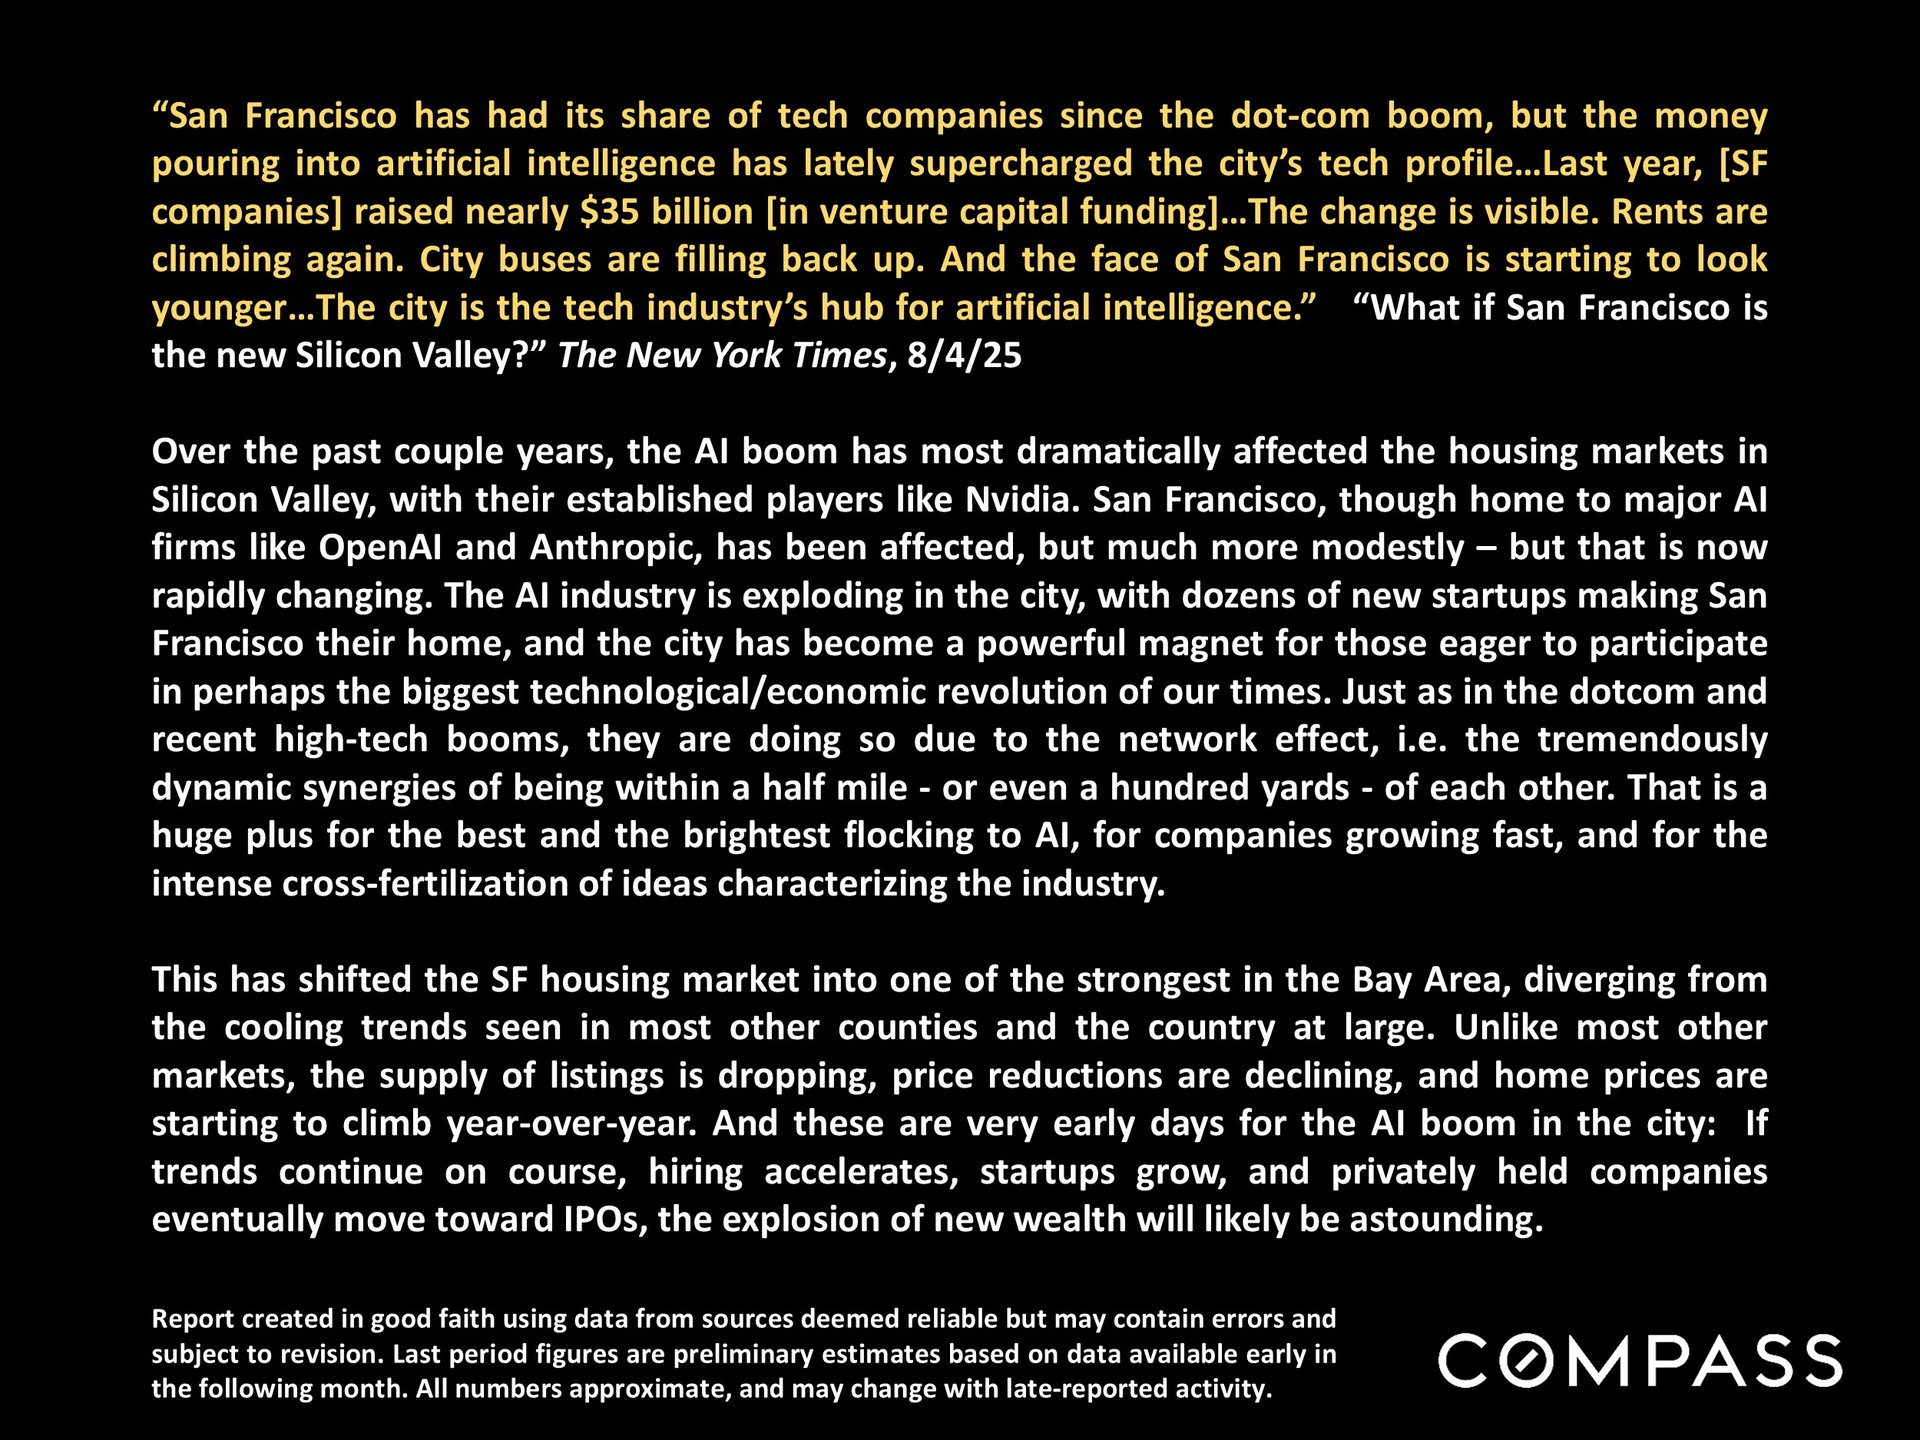
San Francisco has had its share of tech companies since the dot-com boom, but the money pouring into artificial intelligence has lately supercharged the city s tech profile...Last year, [SF companies] raised nearly $35 billion [in venture capital funding]...The change is visible. Rents are climbing again. City buses are filling back up. And the face of San Francisco is starting to look younger...The city is the tech industry s hub for artificial intelligence. What if San Francisco is the new Silicon Valley? The New York Times, 8/4/25 Over the past couple years, the AI boom has most dramatically affected the housing markets in Silicon Valley, with their established players like Nvidia. San Francisco, though home to major AI firms like OpenAI and Anthropic, has been affected, but much more modestly – but that is now rapidly changing. The AI industry is exploding in the city, with dozens of new startups making San Francisco their home, and the city has become a powerful magnet for those eager to participate in perhaps the biggest technological/economic revolution of our times. Just as in the dotcom and recent high-tech booms, they are doing so due to the network effect, i.e. the tremendously dynamic synergies of being within a half mile - or even a hundred yards - of each other. That is a huge plus for the best and the brightest flocking to AI, for companies growing fast, and for the intense cross-fertilization of ideas characterizing the industry. This has shifted the SF housing market into one of the strongest in the Bay Area, diverging from the cooling trends seen in most other counties and the country at large. Unlike most other markets, the supply of listings is dropping, price reductions are declining, and home prices are starting to climb year-over-year. And these are very early days for the AI boom in the city: If trends continue on course, hiring accelerates, startups grow, and privately held companies eventually move toward IPOs, the explosion of new wealth will likely be astounding

San Francisco real estate August 2025 report cover with a city panorama and Compass branding.


San Francisco market update discussing the AI boom and housing trends, with a New York Times quote and Compass logo.


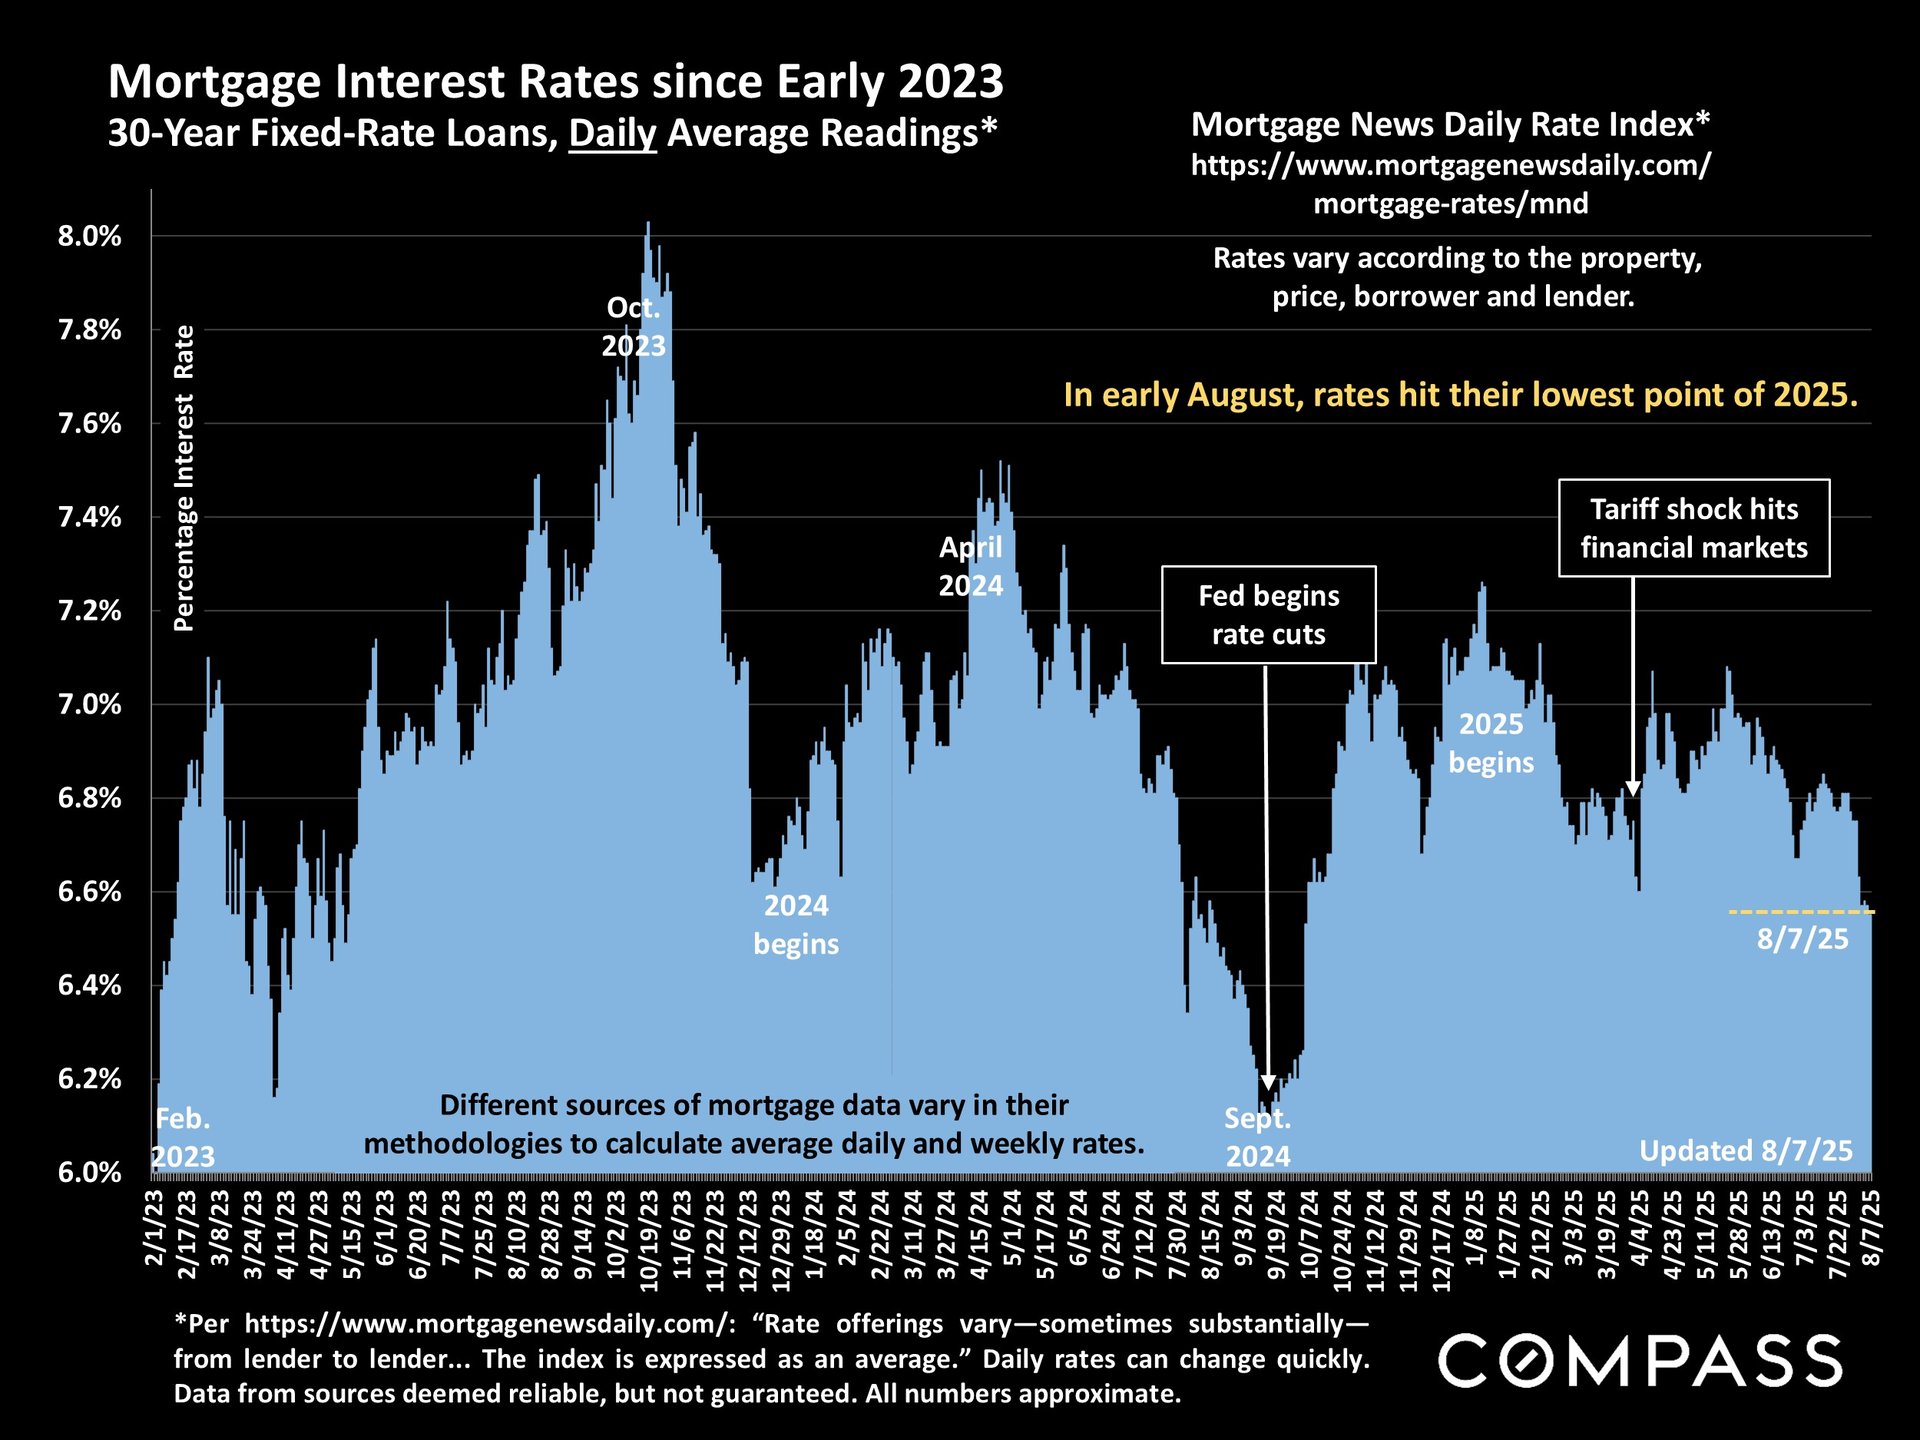
Chart of daily 30-year fixed mortgage rates from February 2023 to August 2025, with key market events annotated.


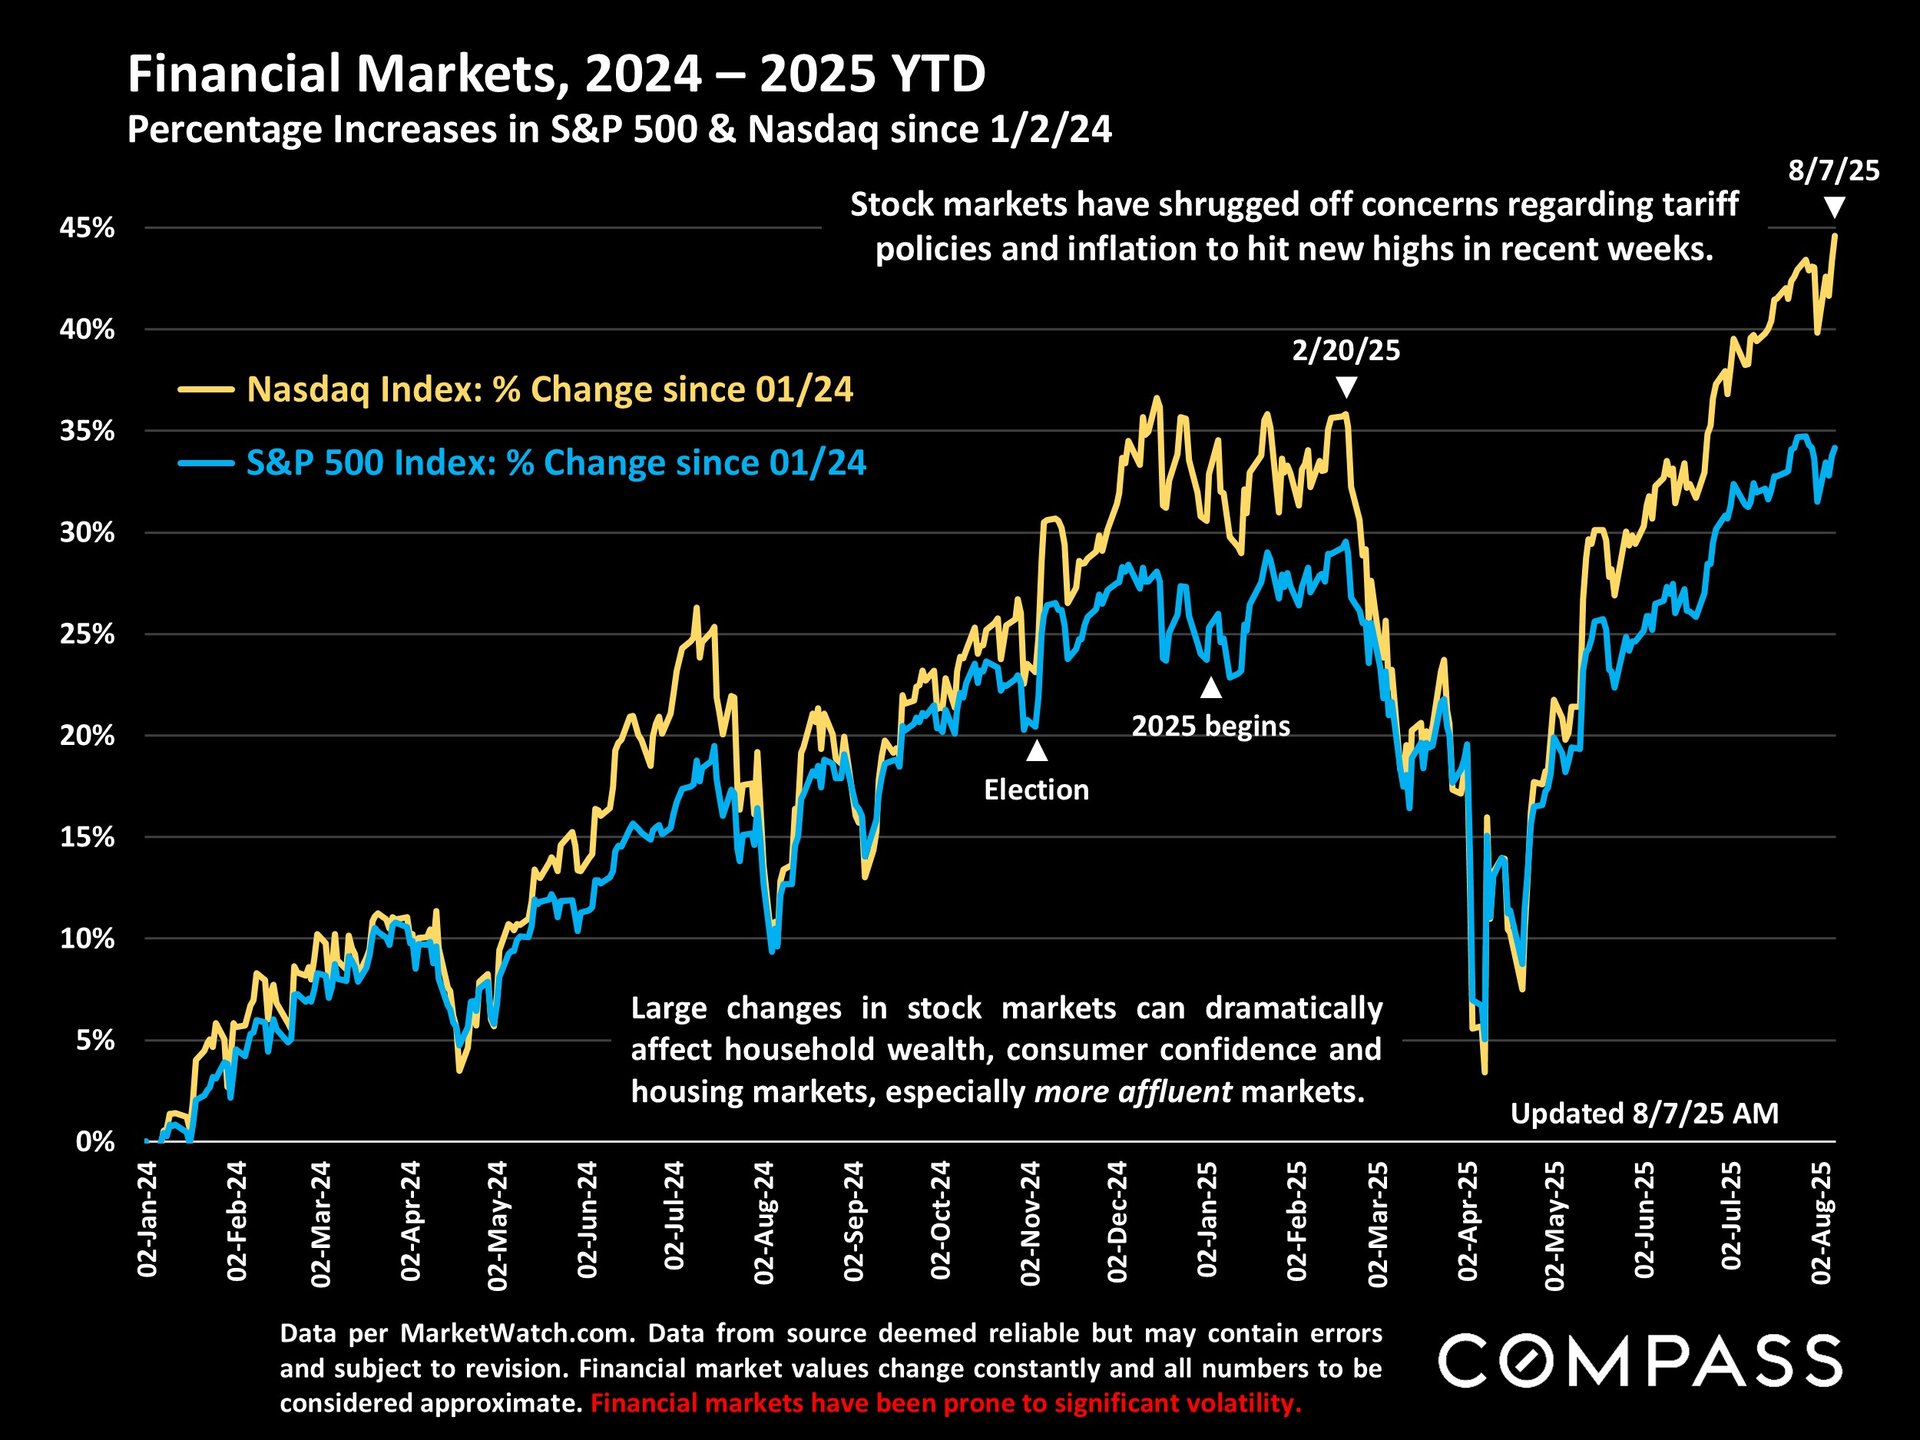
Chart comparing Nasdaq and S&P 500 gains from January 2024 to August 2025.


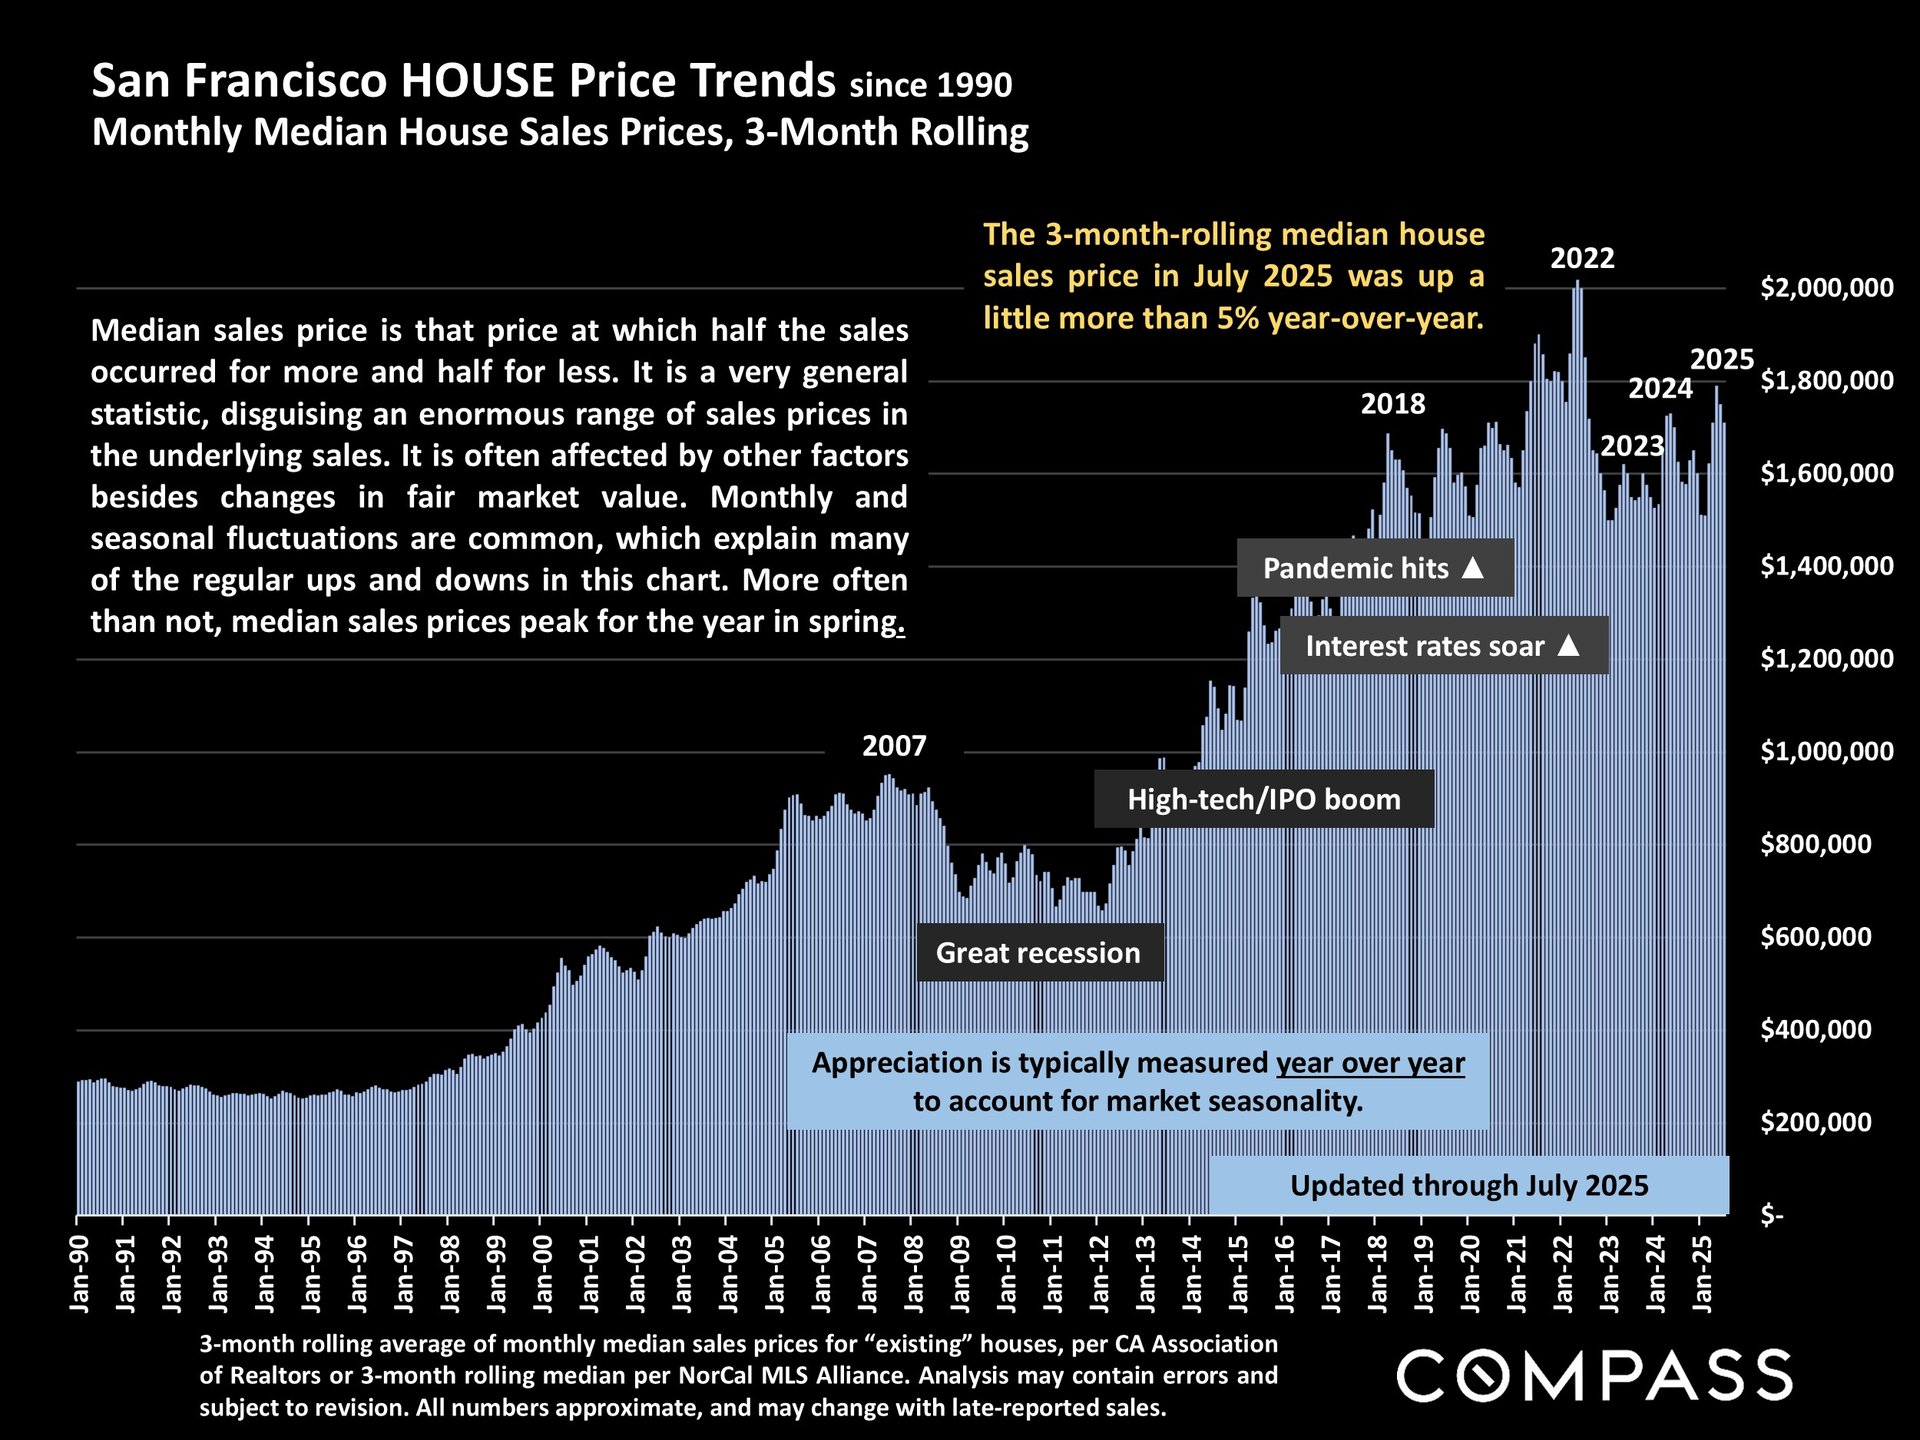
Chart of San Francisco median house sale prices from 1990 through July 2025, with historical market events marked.


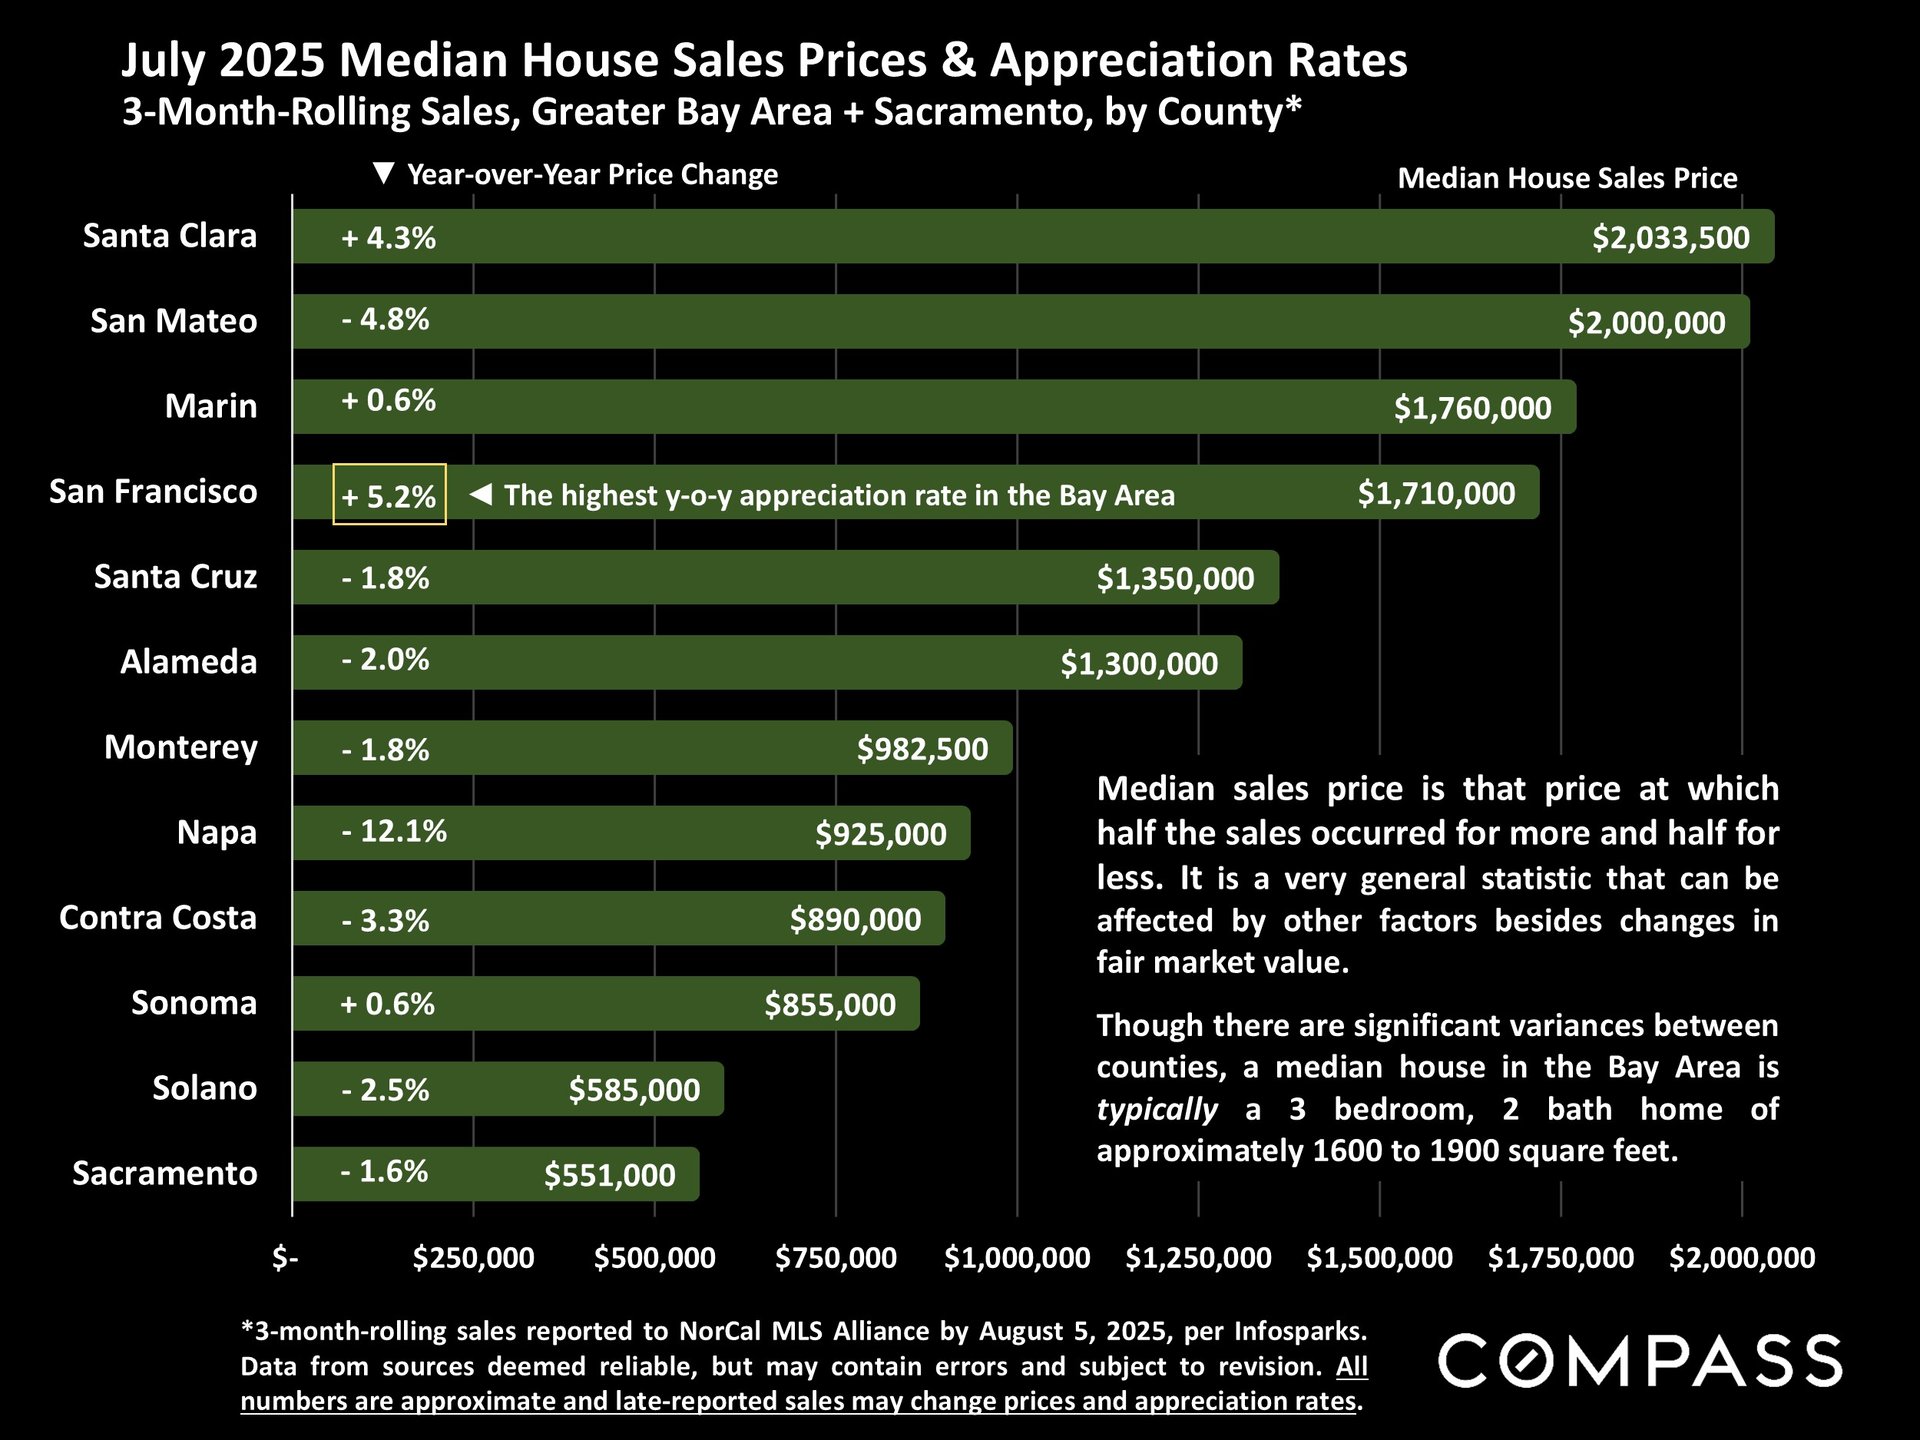
Chart of July 2025 county median home prices and appreciation rates, highlighting San Francisco at $1.71 million and +5.2%.


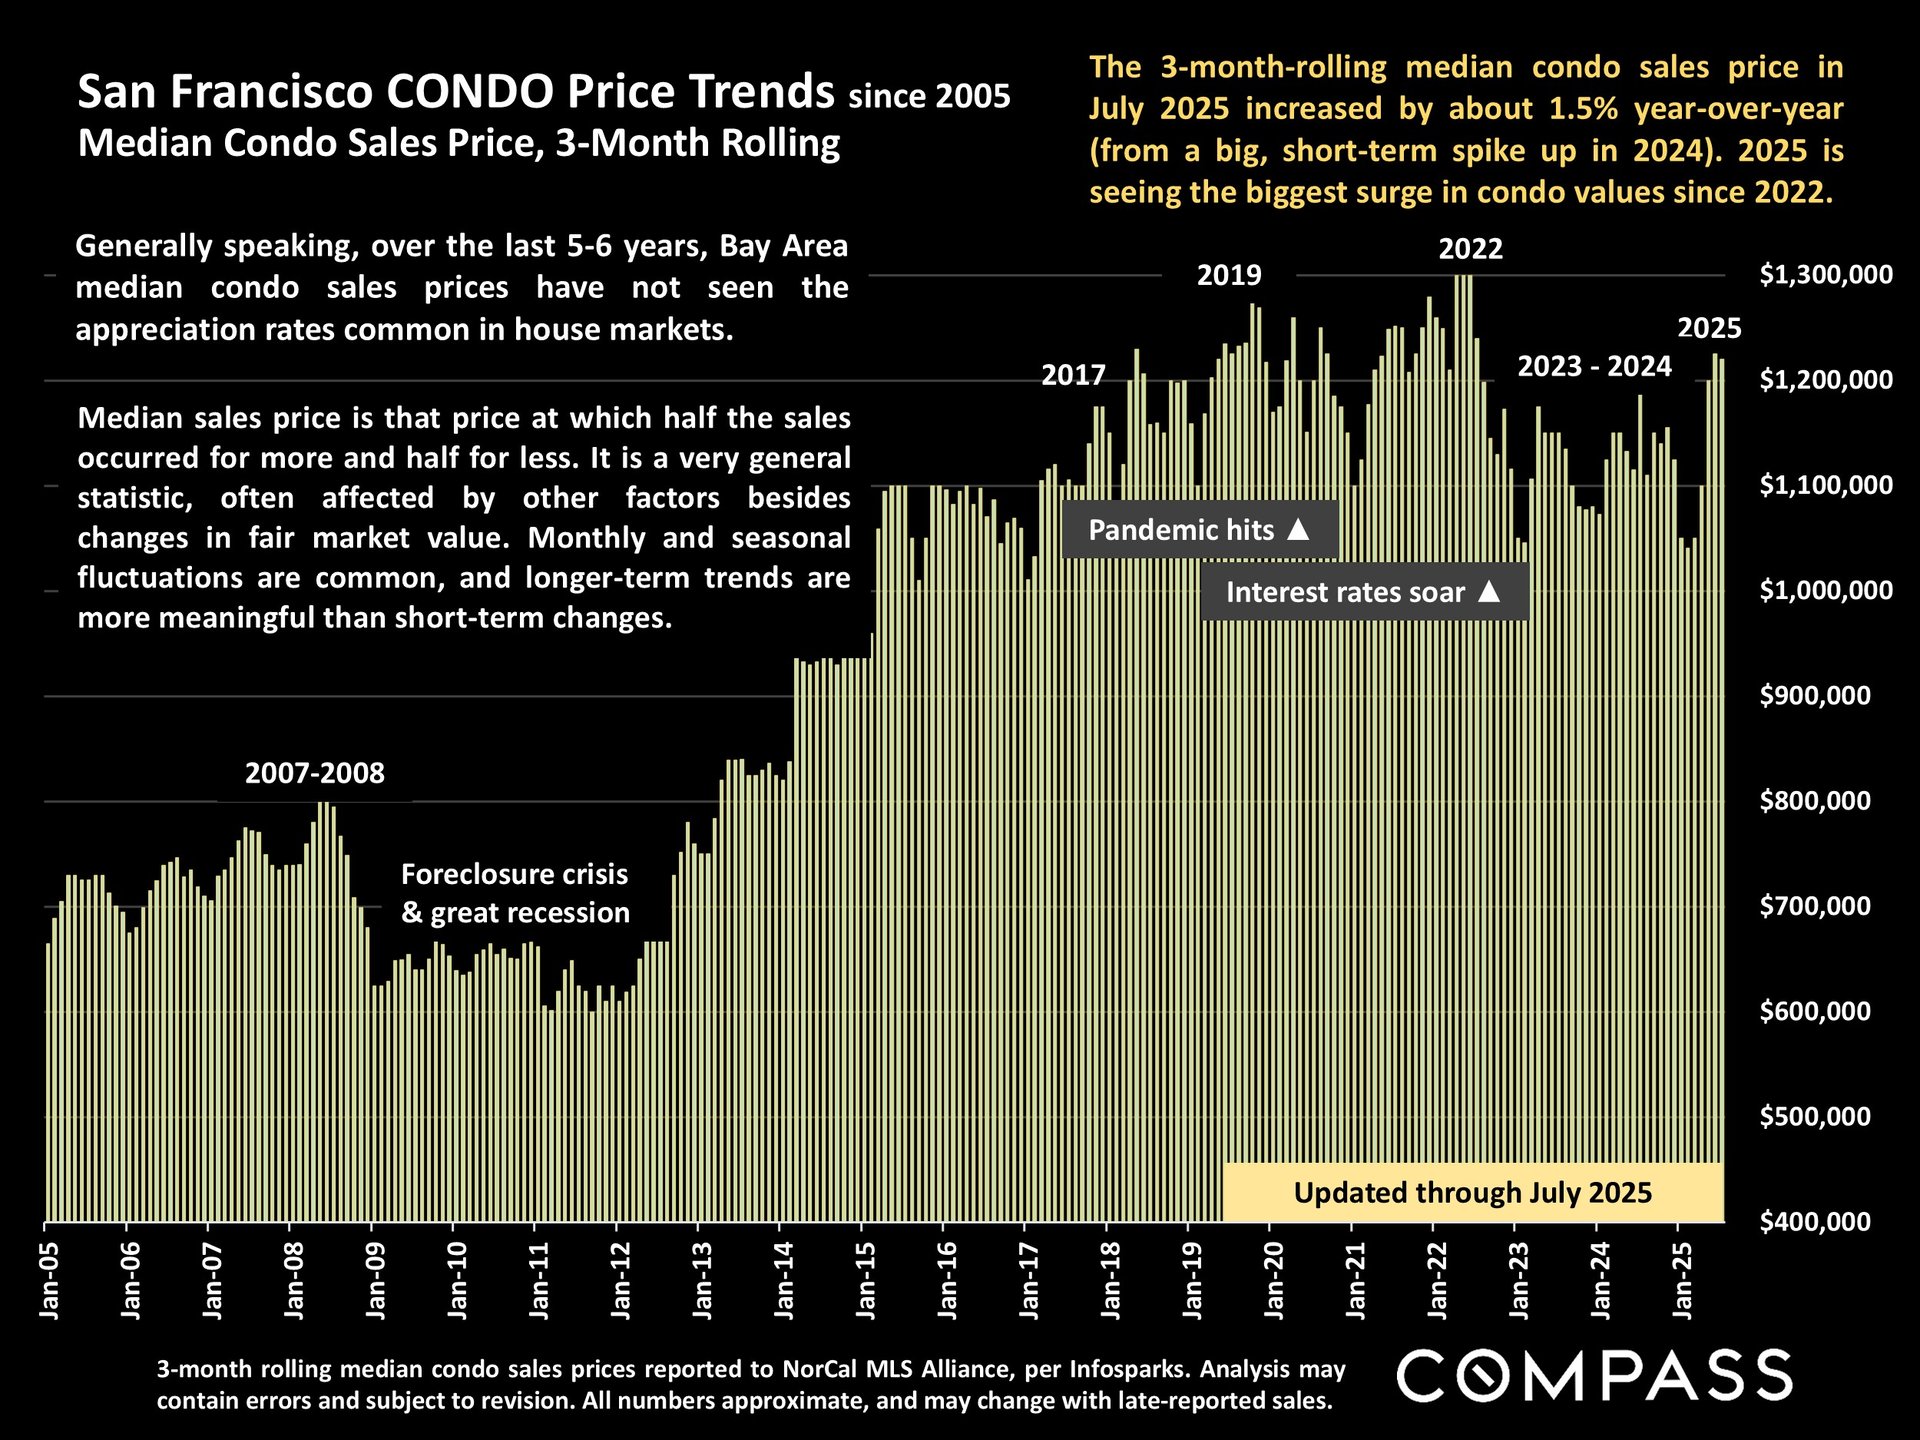
San Francisco condo median sales price chart, 2005–2025, showing a July 2025 update and market milestones.


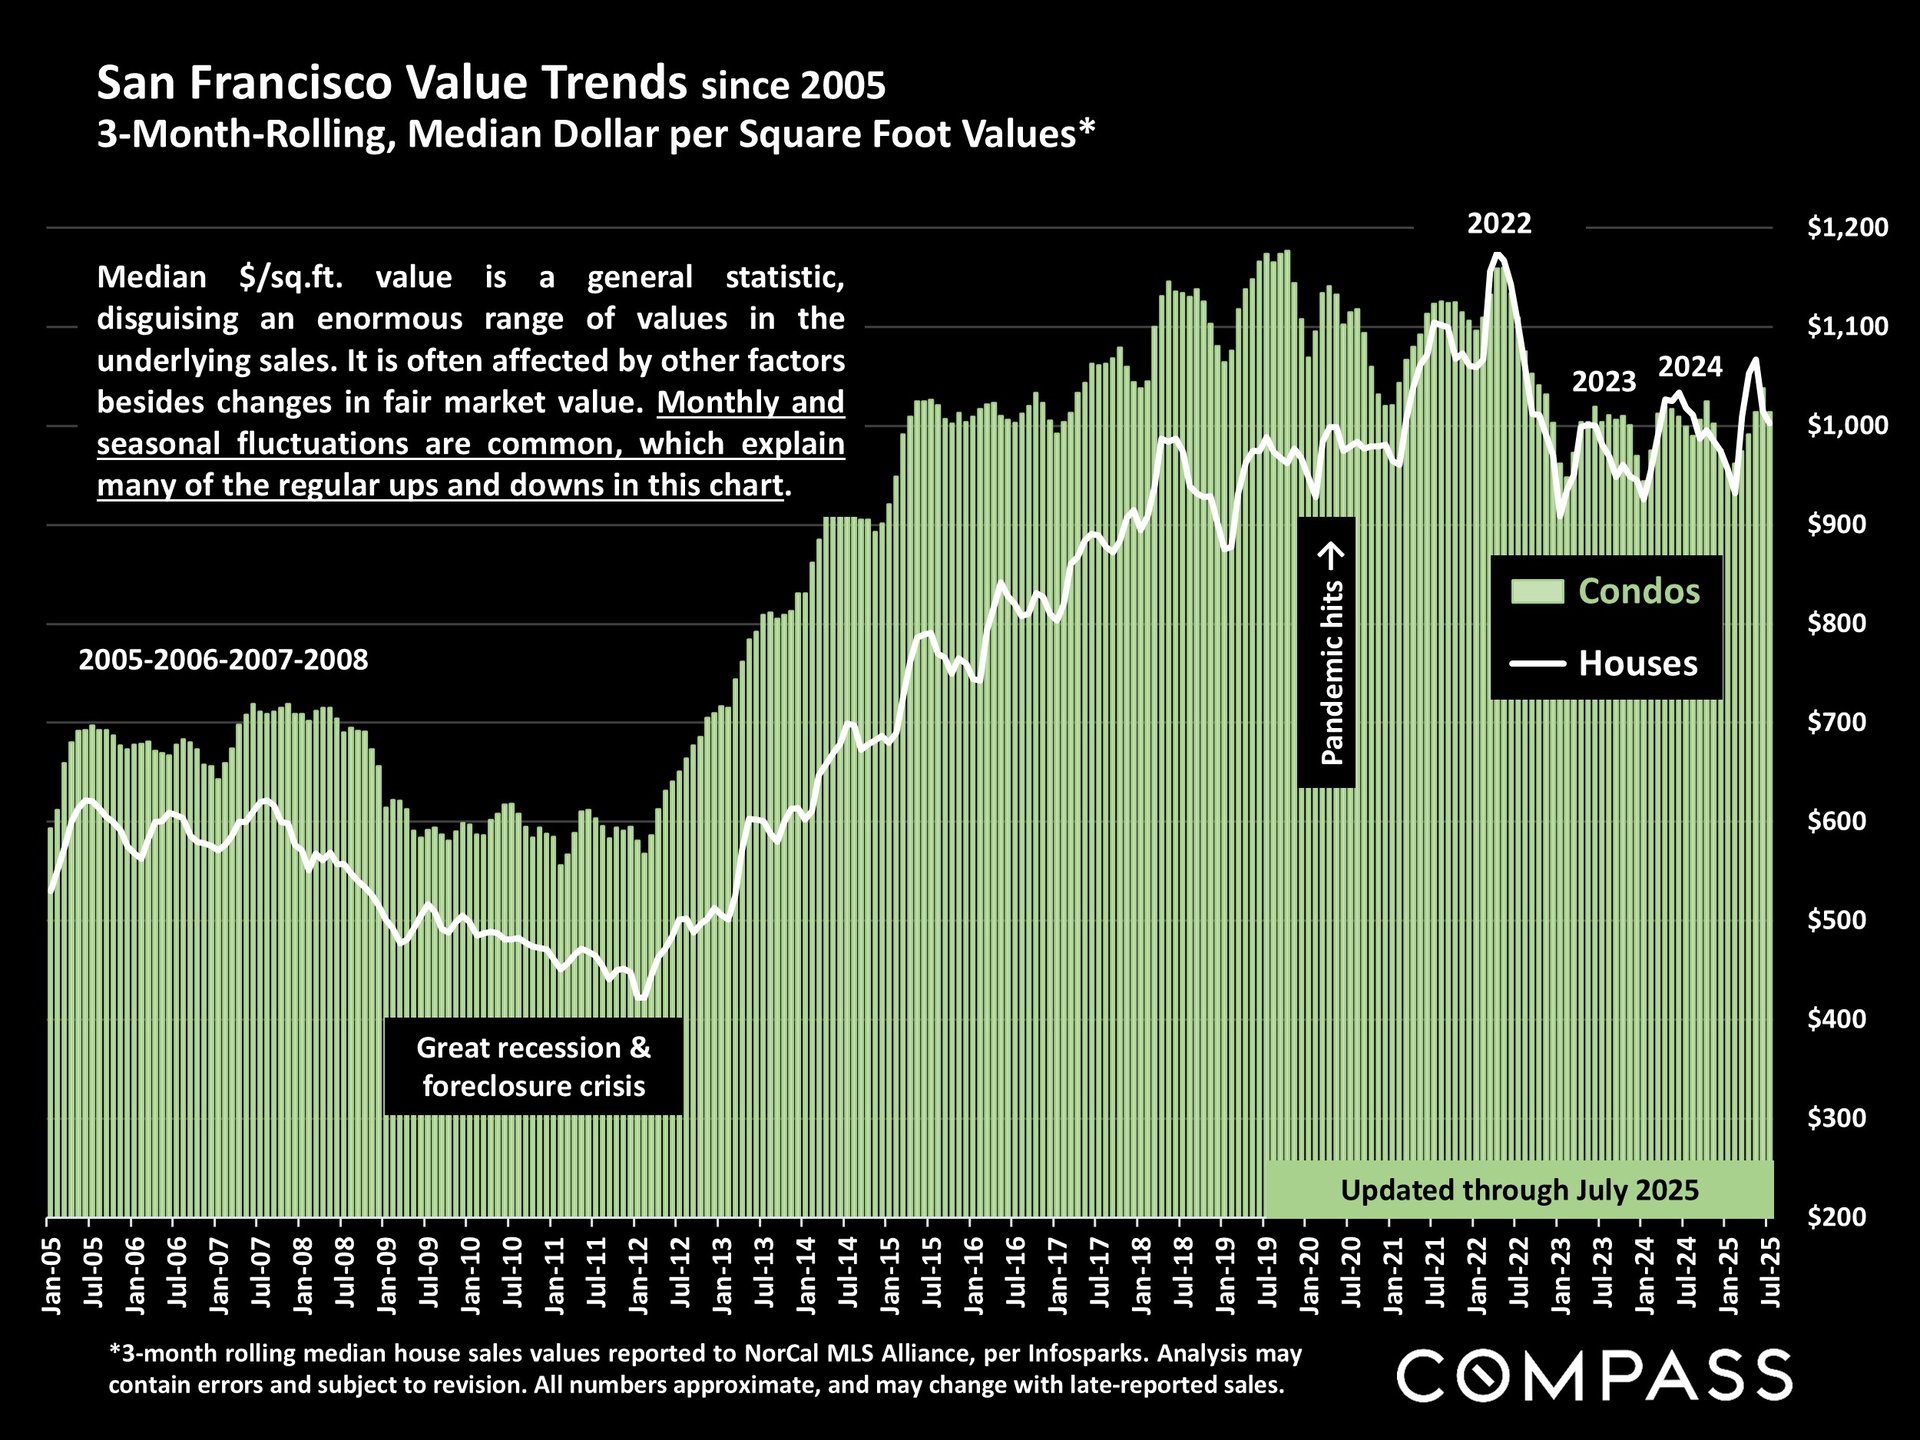
Chart of San Francisco condo and house values per square foot from 2005 to July 2025, with recession and pandemic annotations.


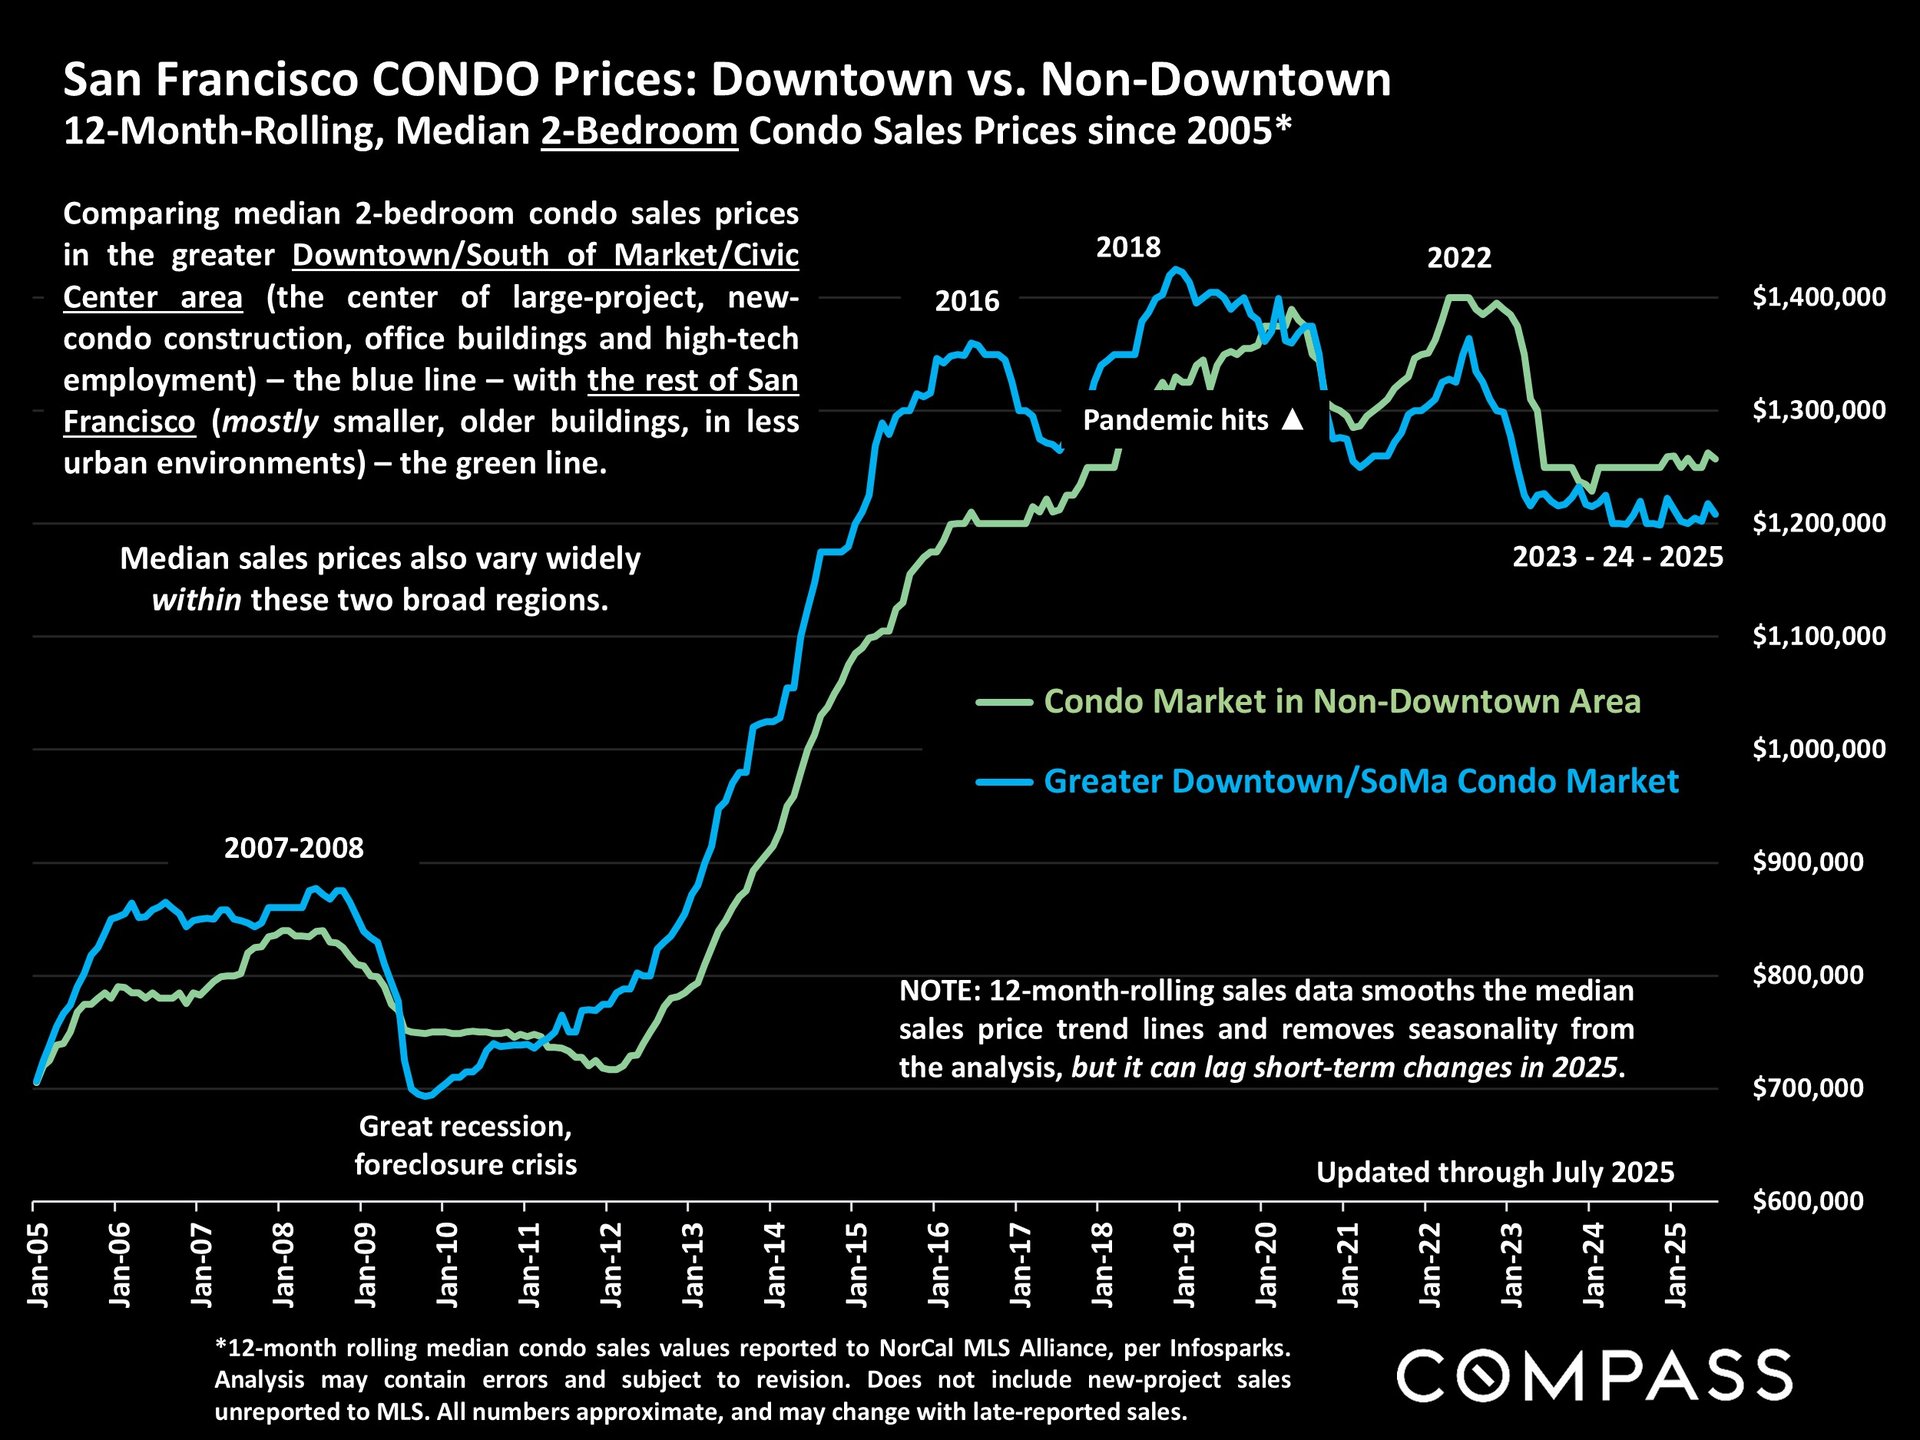
Chart comparing San Francisco downtown and non-downtown two-bedroom condo prices from 2005 to July 2025.


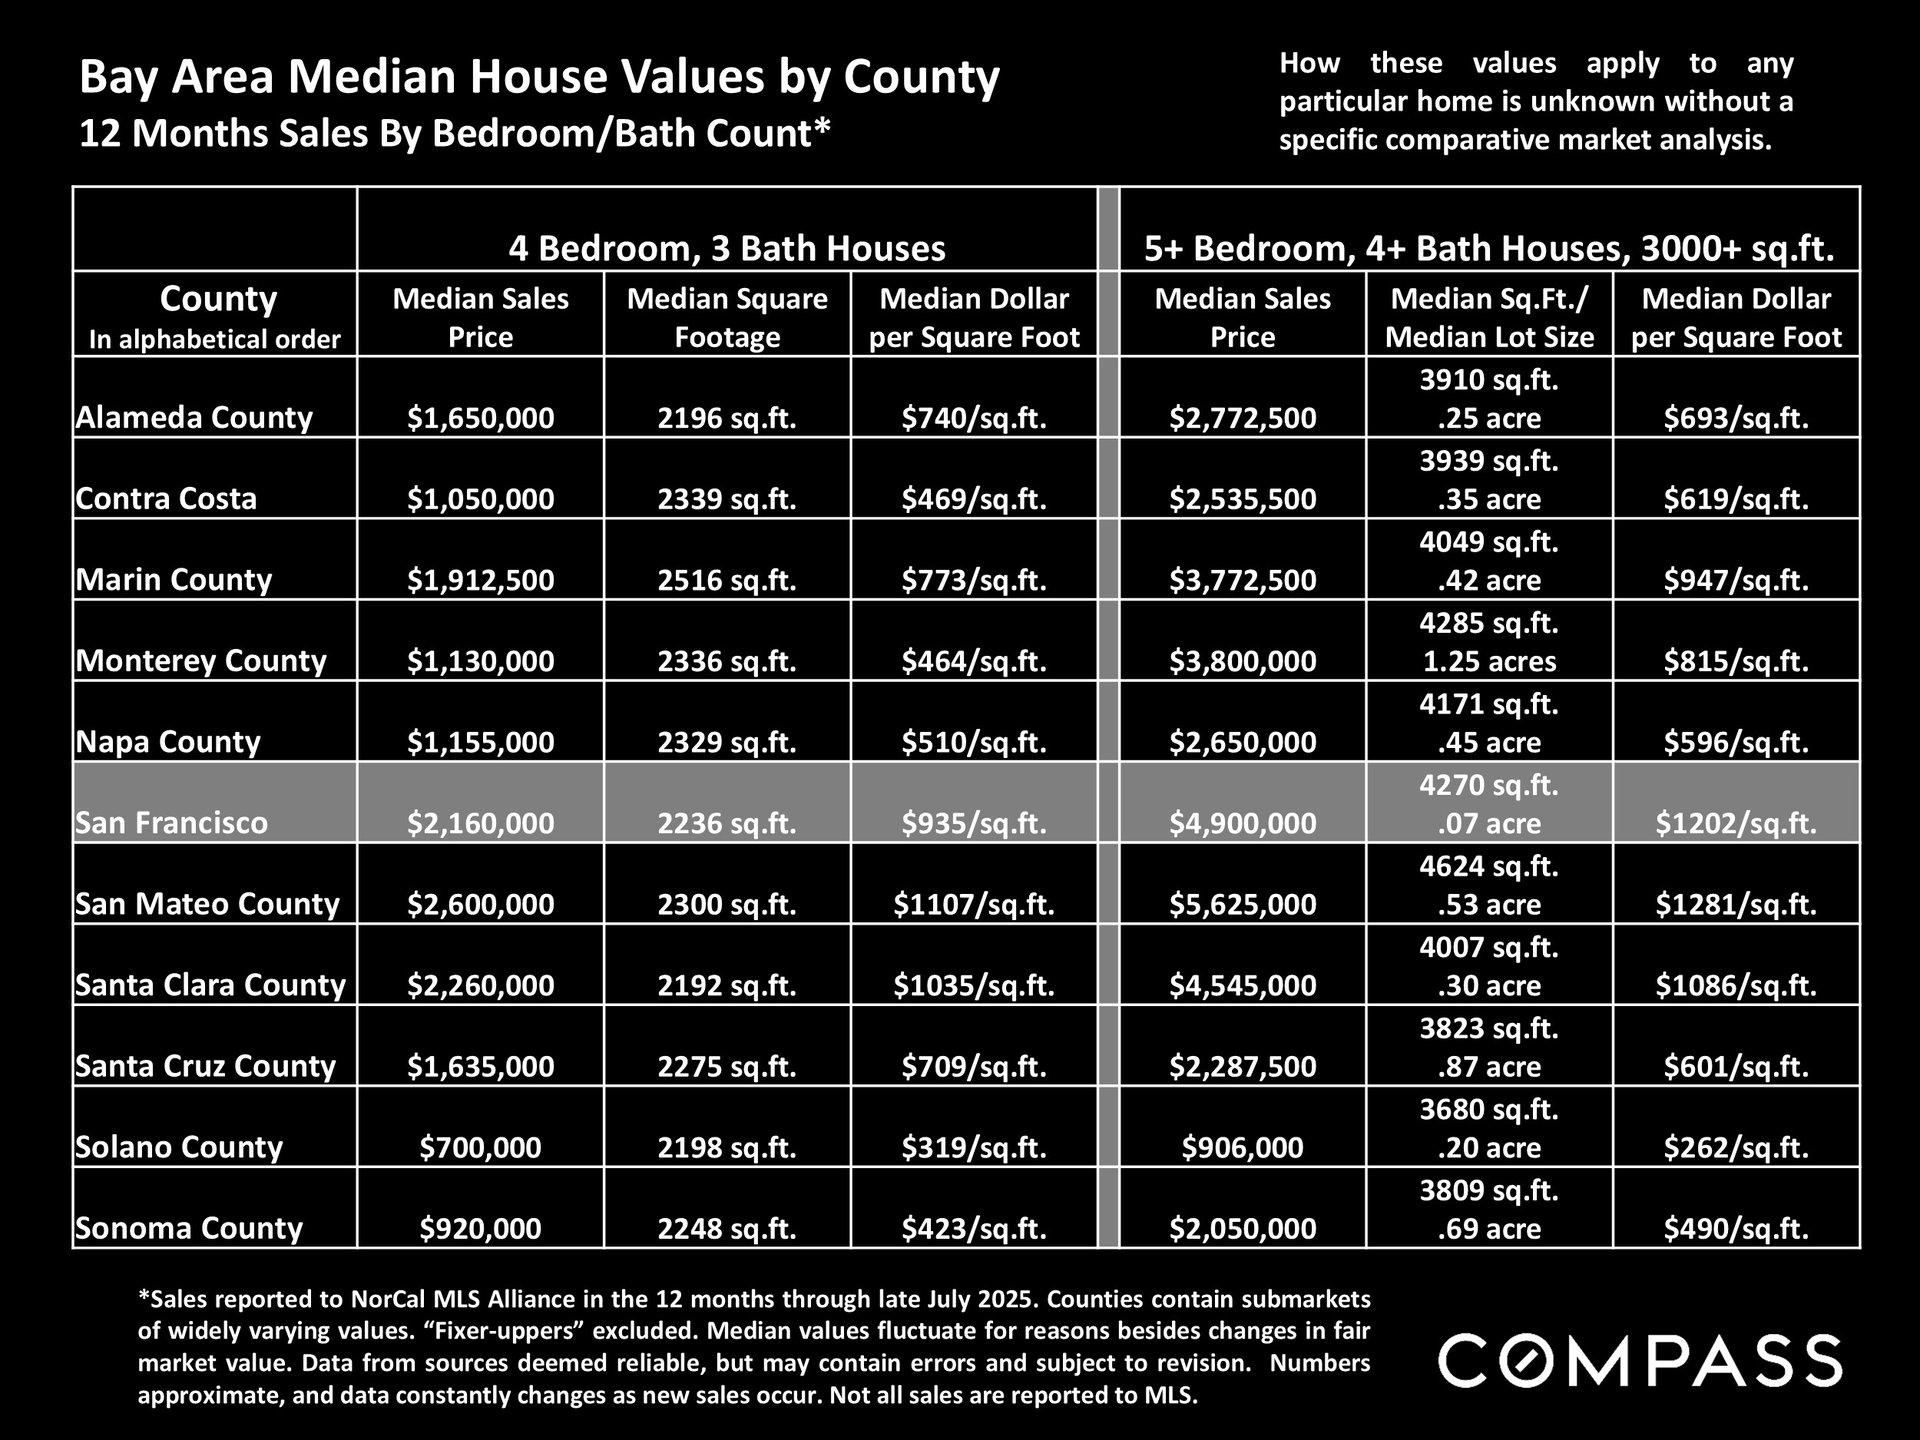
Bay Area median house values table by county, with the San Francisco row highlighted.


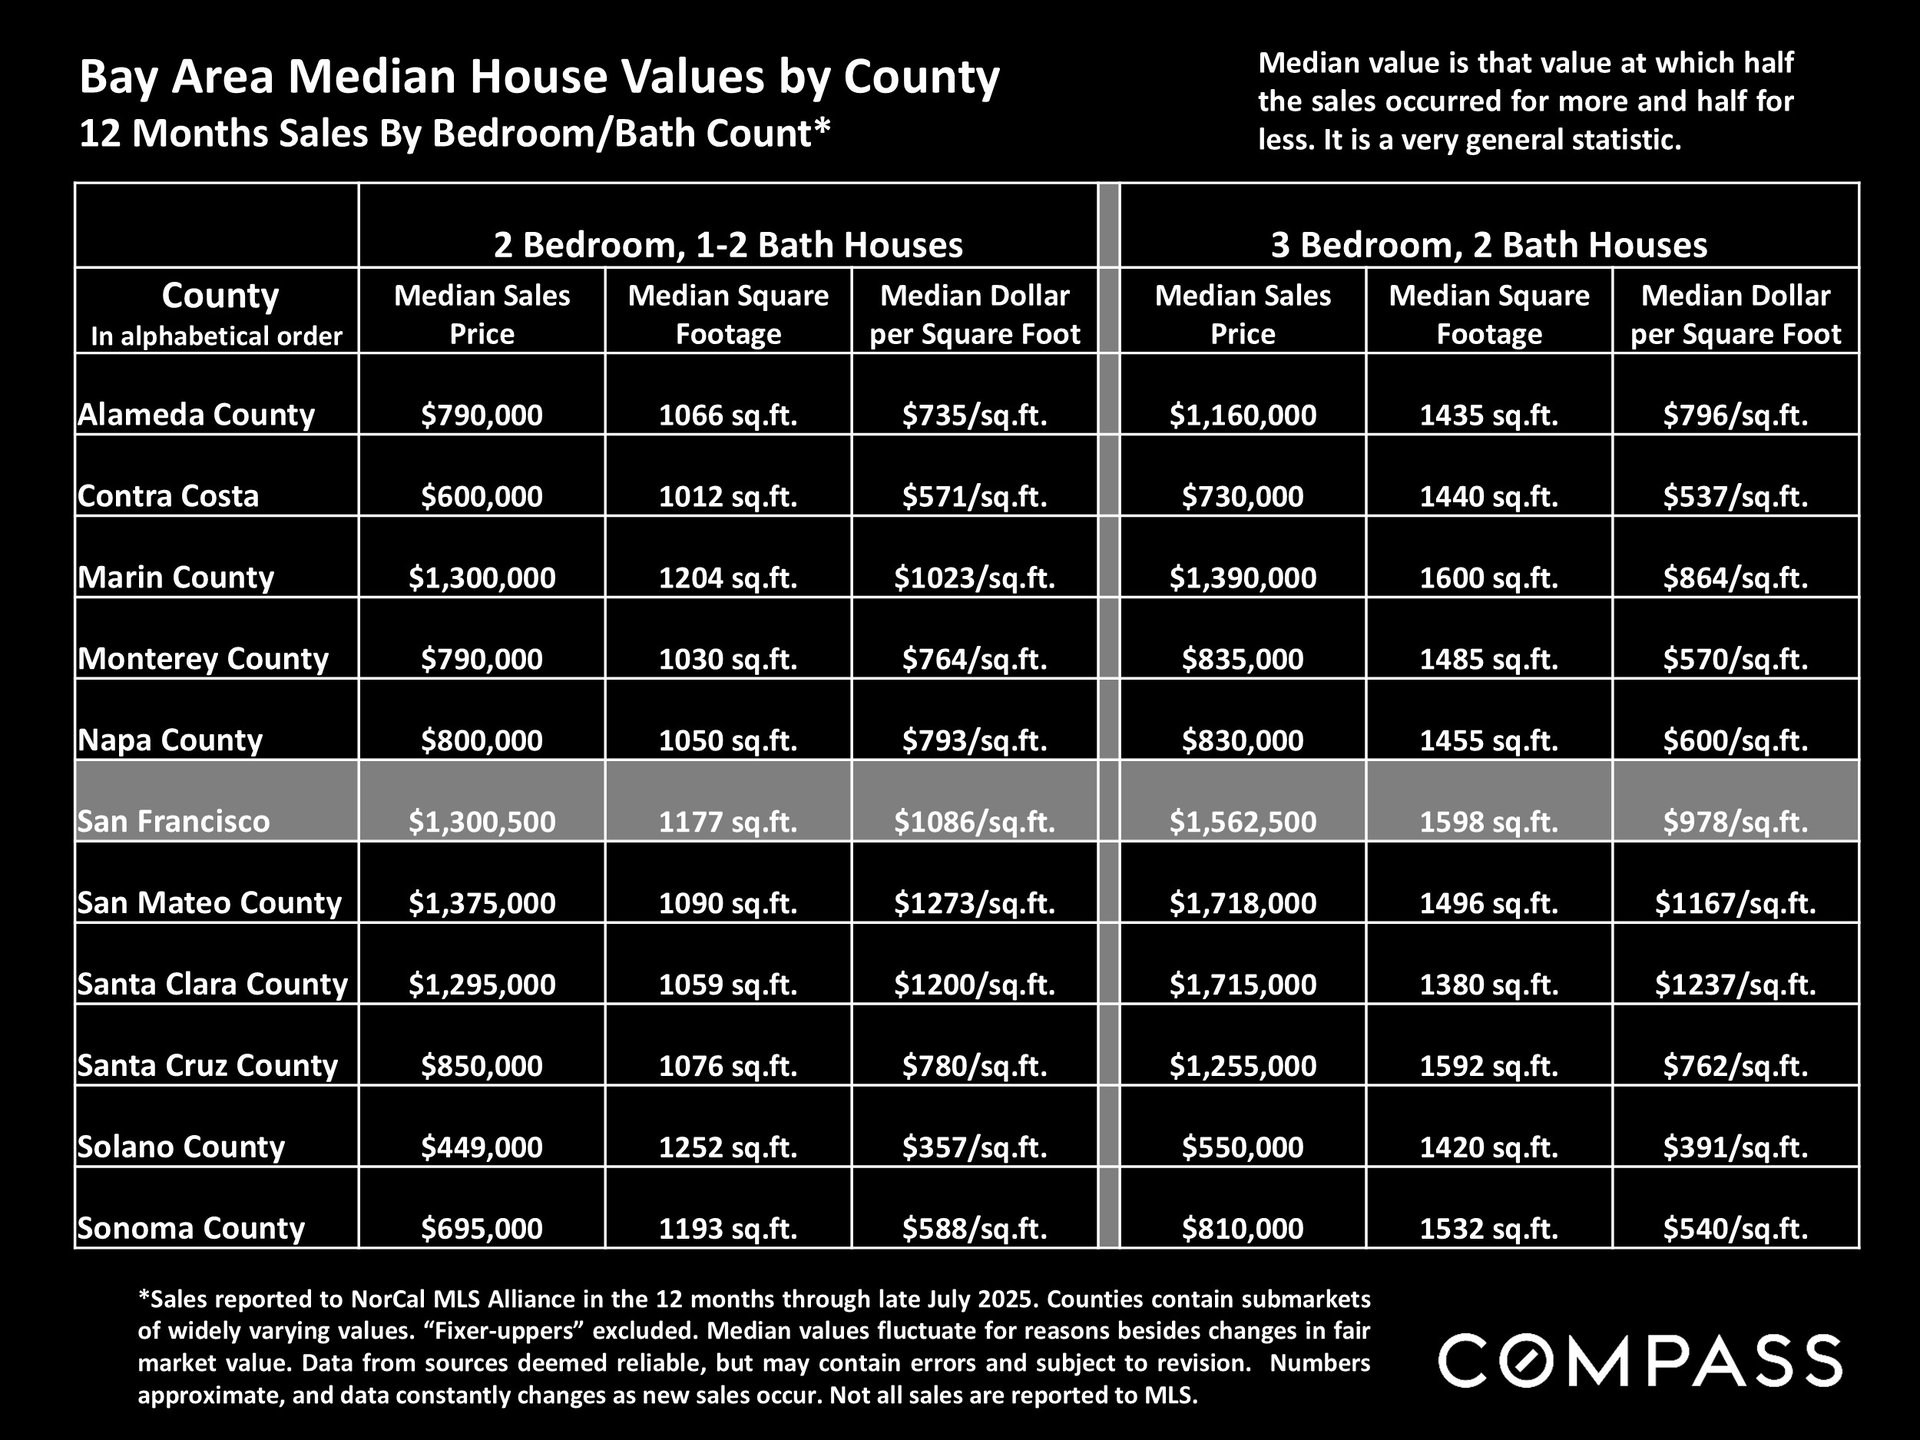
Table comparing median home sale prices, square footage, and price per square foot across 11 Bay Area counties.


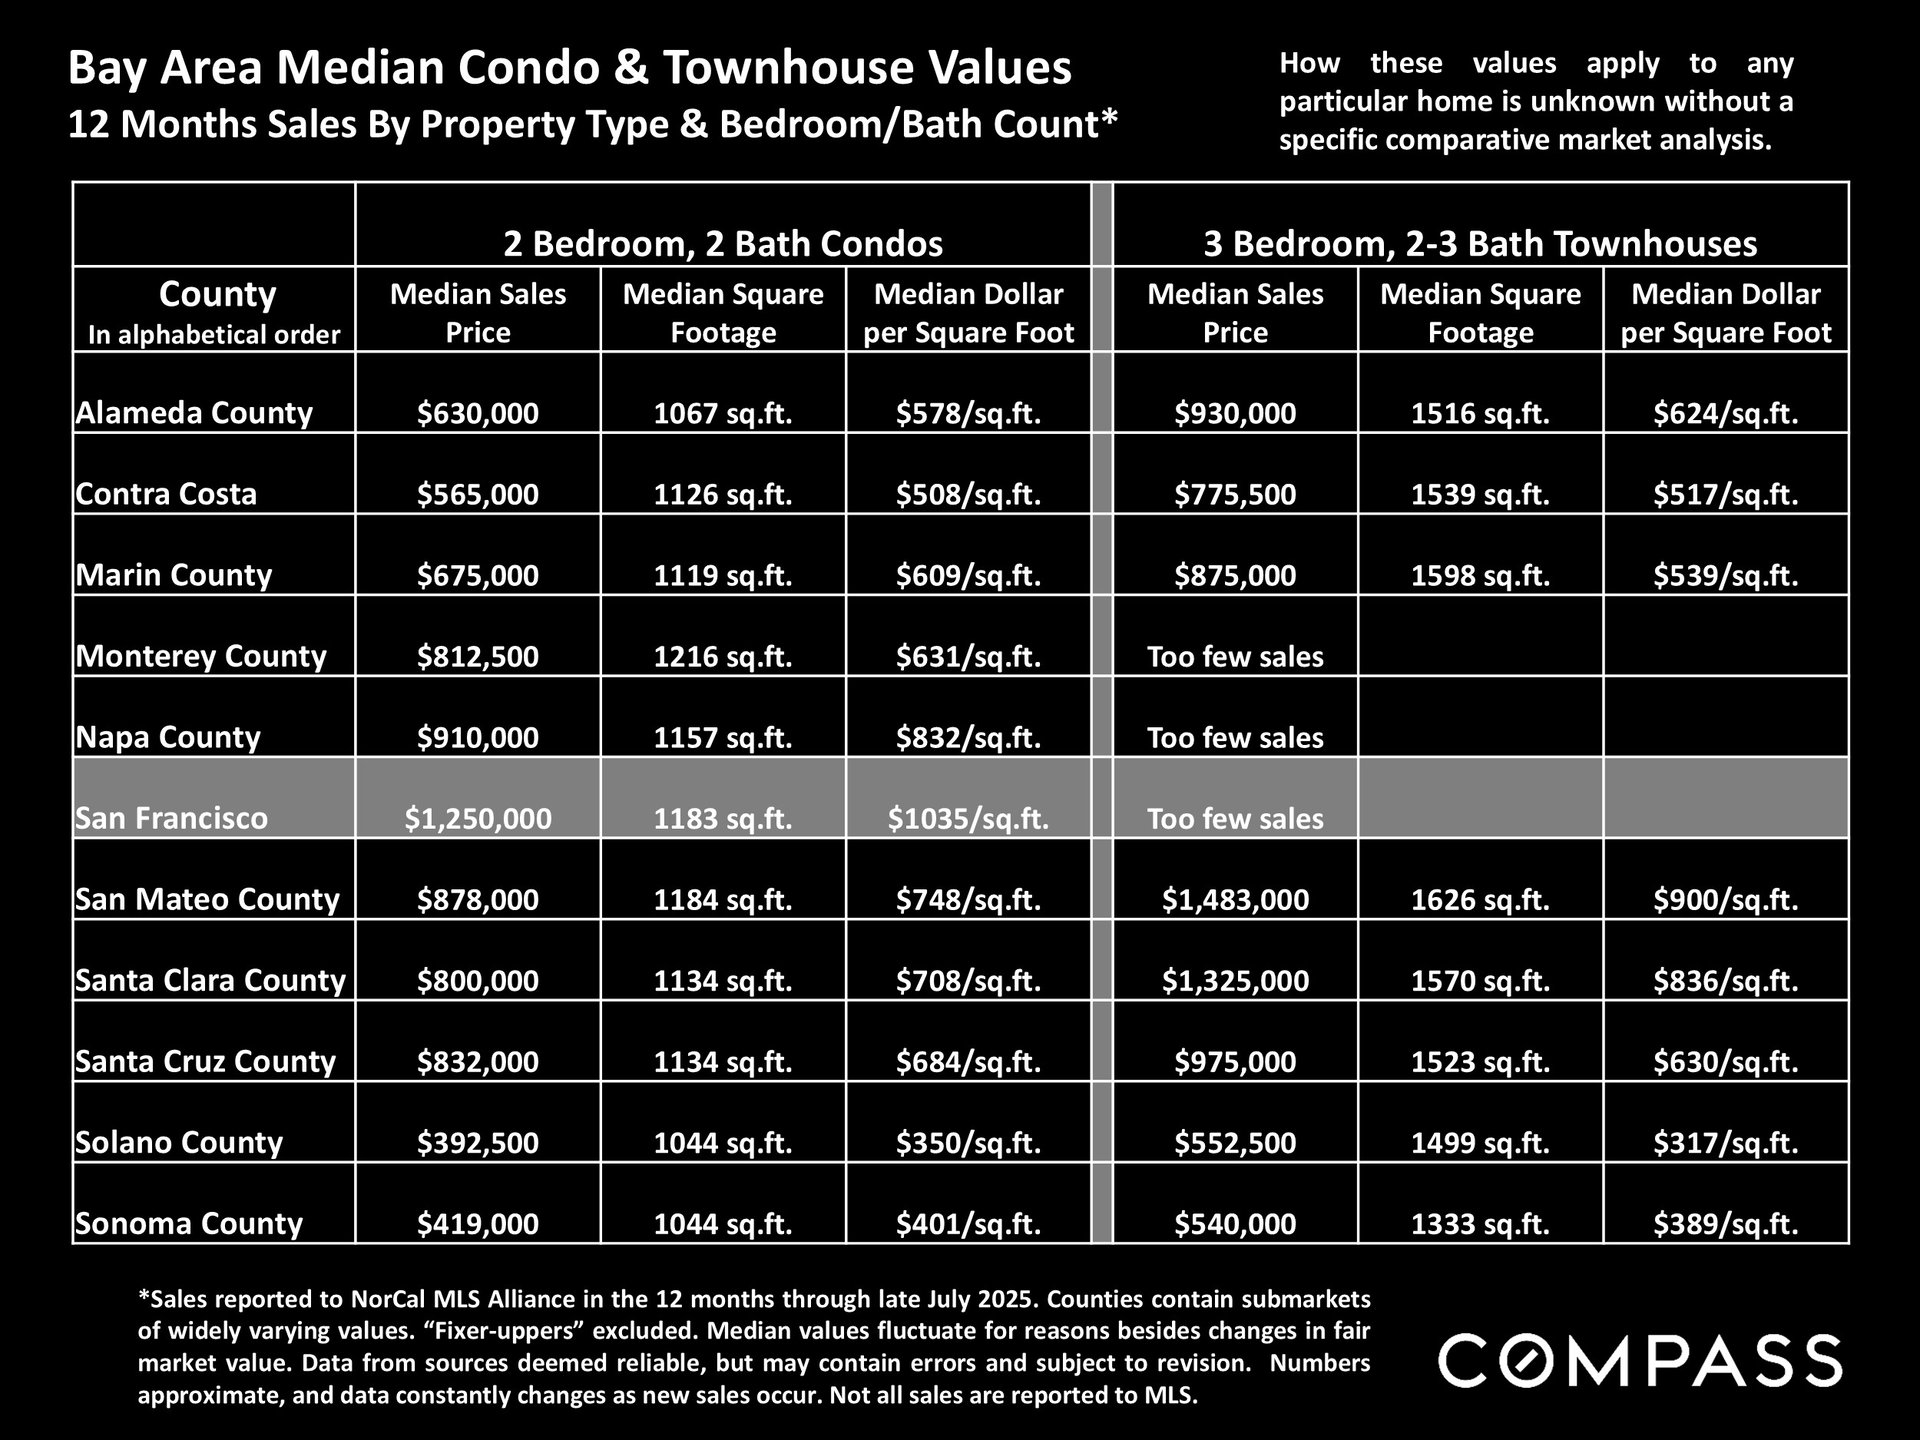
Bay Area county table comparing median condo and townhouse prices, square footage, and price per square foot.


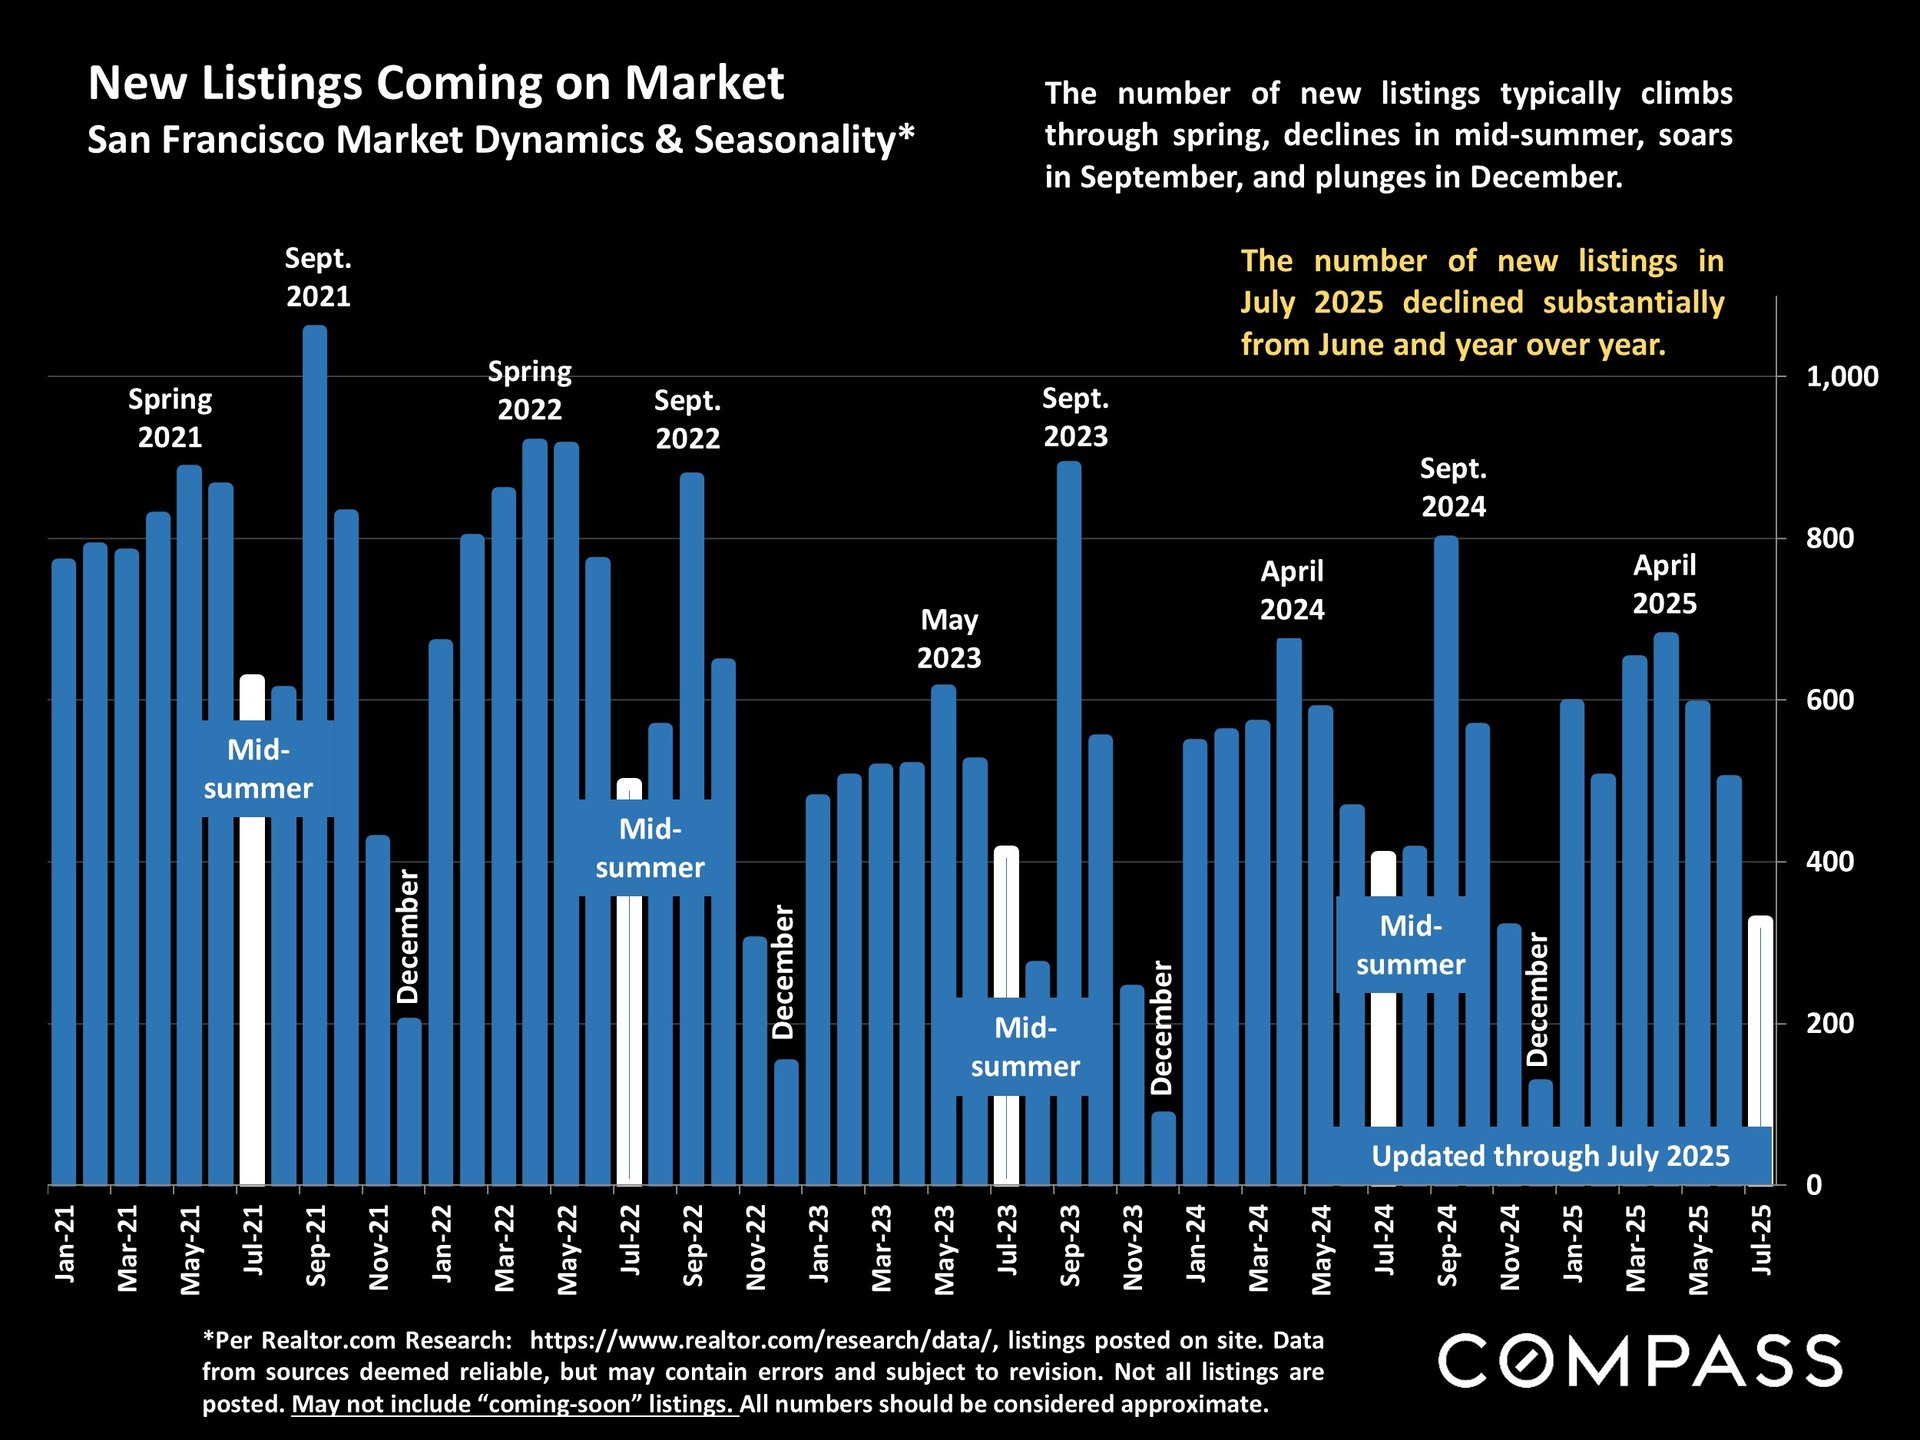
Bar chart of San Francisco new listings, January 2021–July 2025, highlighting seasonal patterns and July 2025 declines.


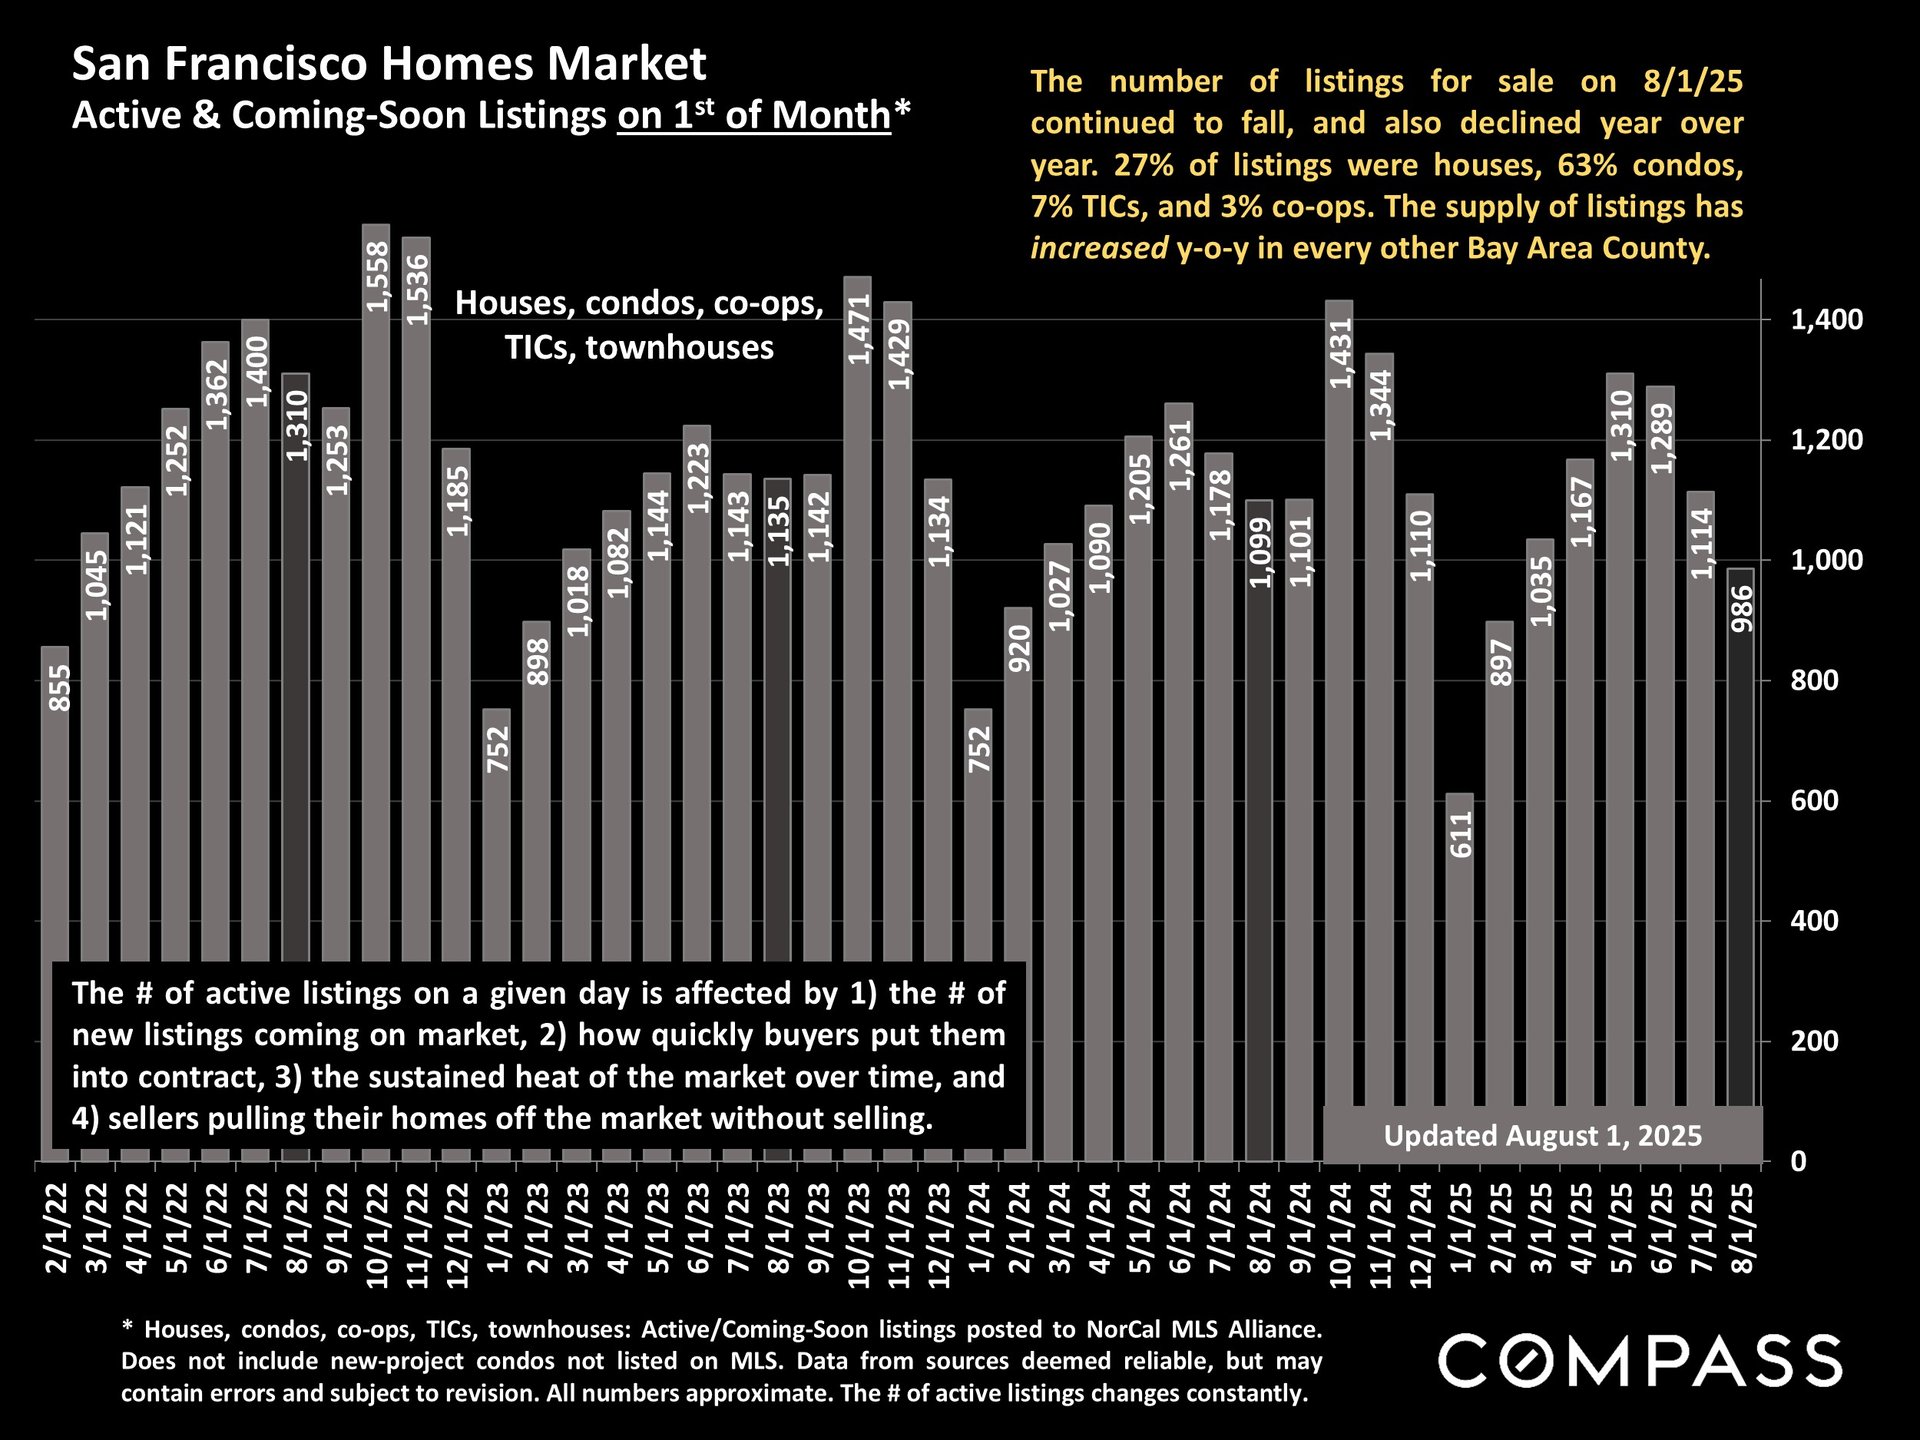
San Francisco active and coming-soon listings chart, January 2022–August 2025, showing 986 listings on August 1, 2025.


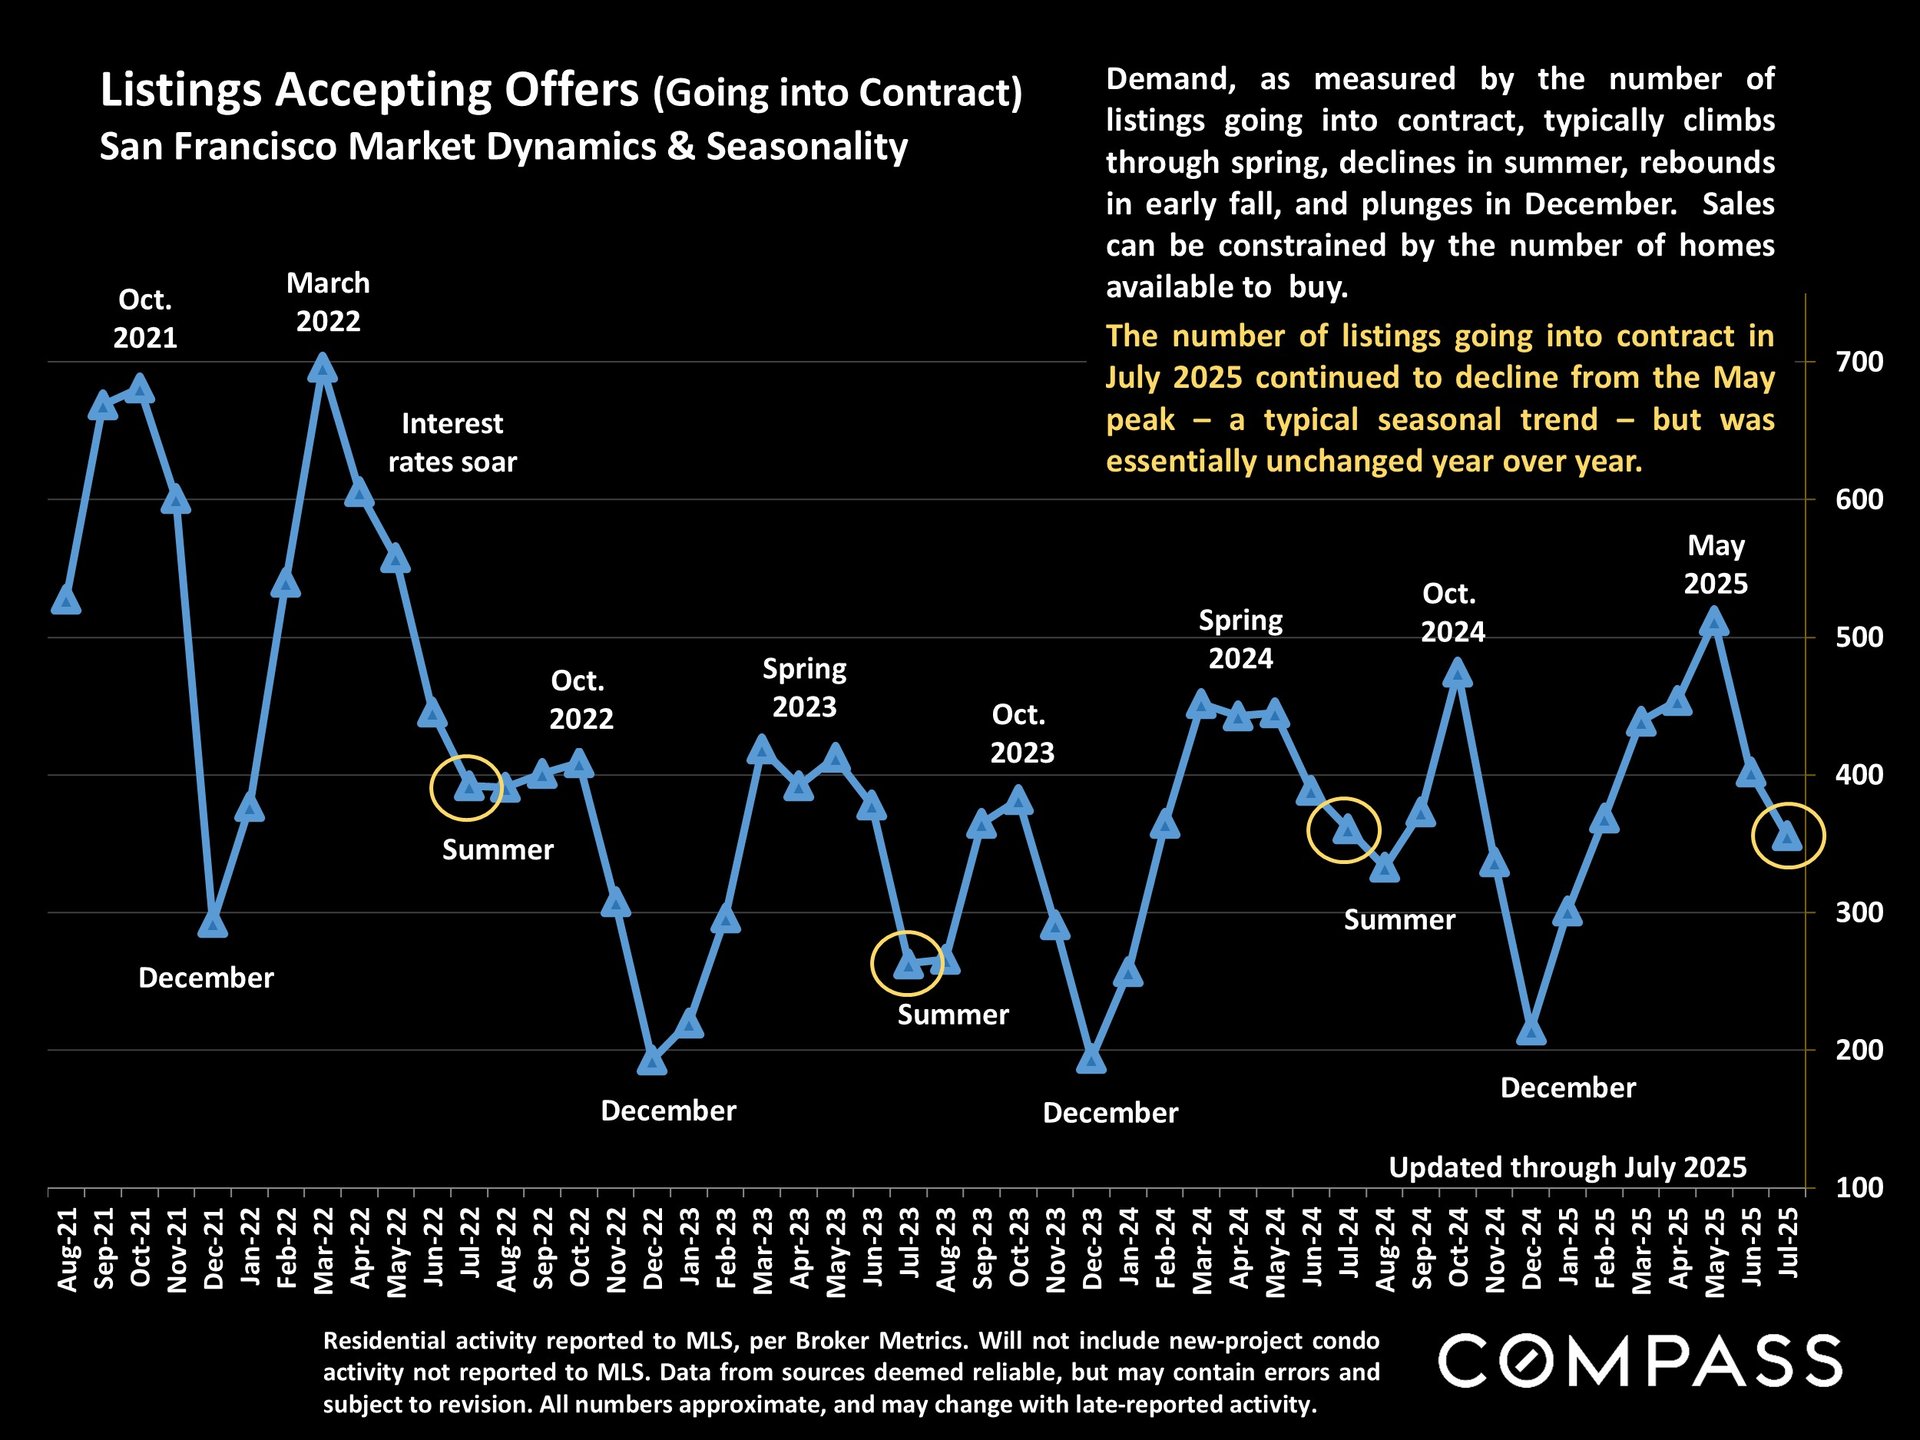
Chart of San Francisco listings going into contract, showing seasonal peaks and dips through July 2025.


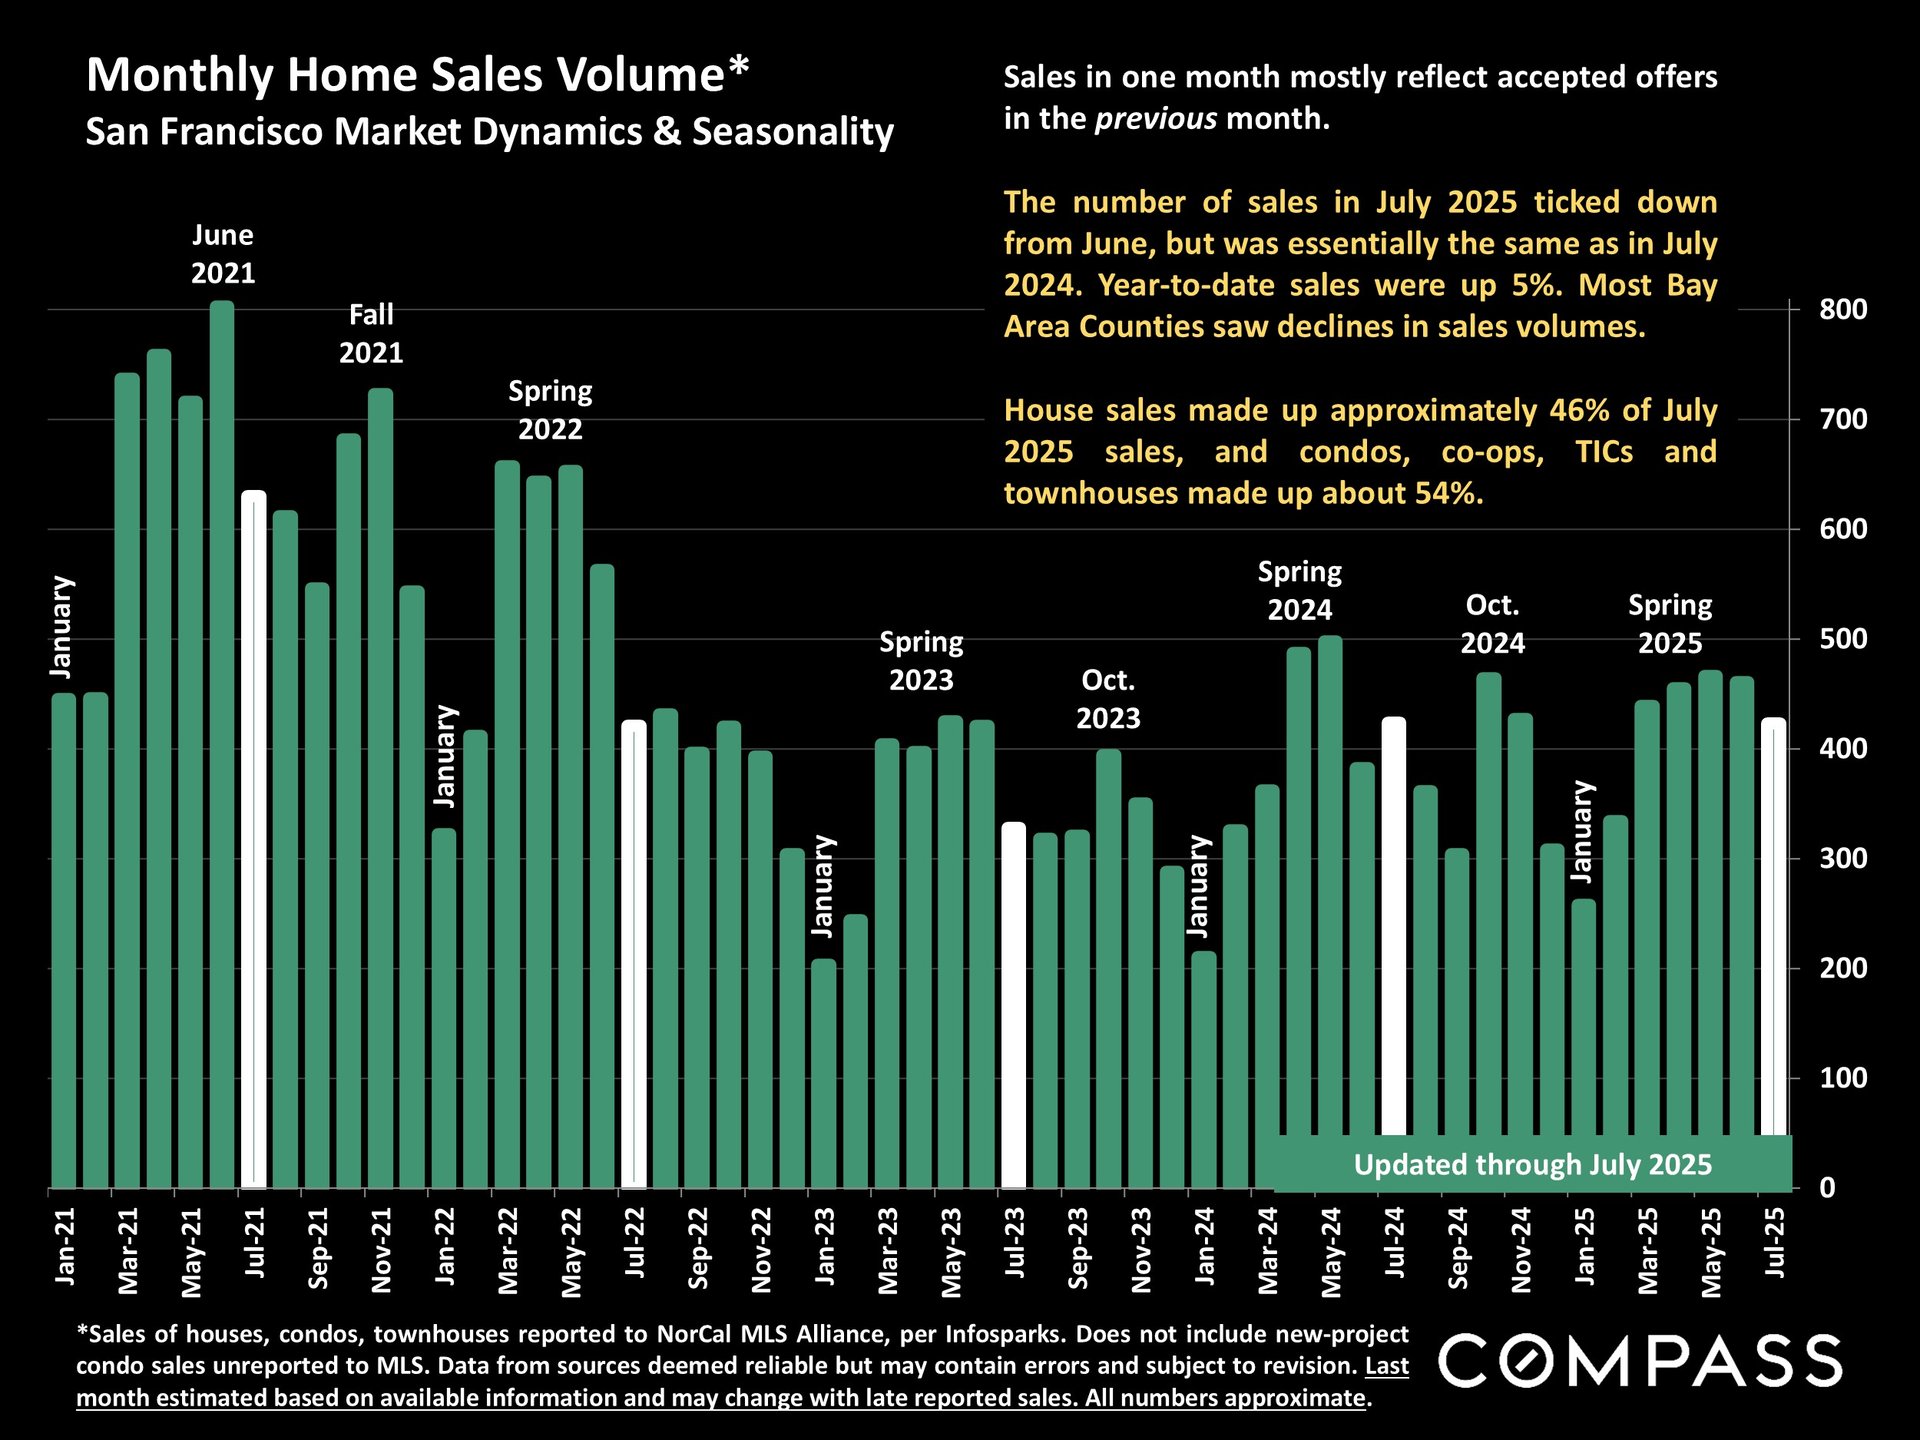
San Francisco monthly home sales chart, January 2021–July 2025, with July 2025 sales nearly unchanged from July 2024.


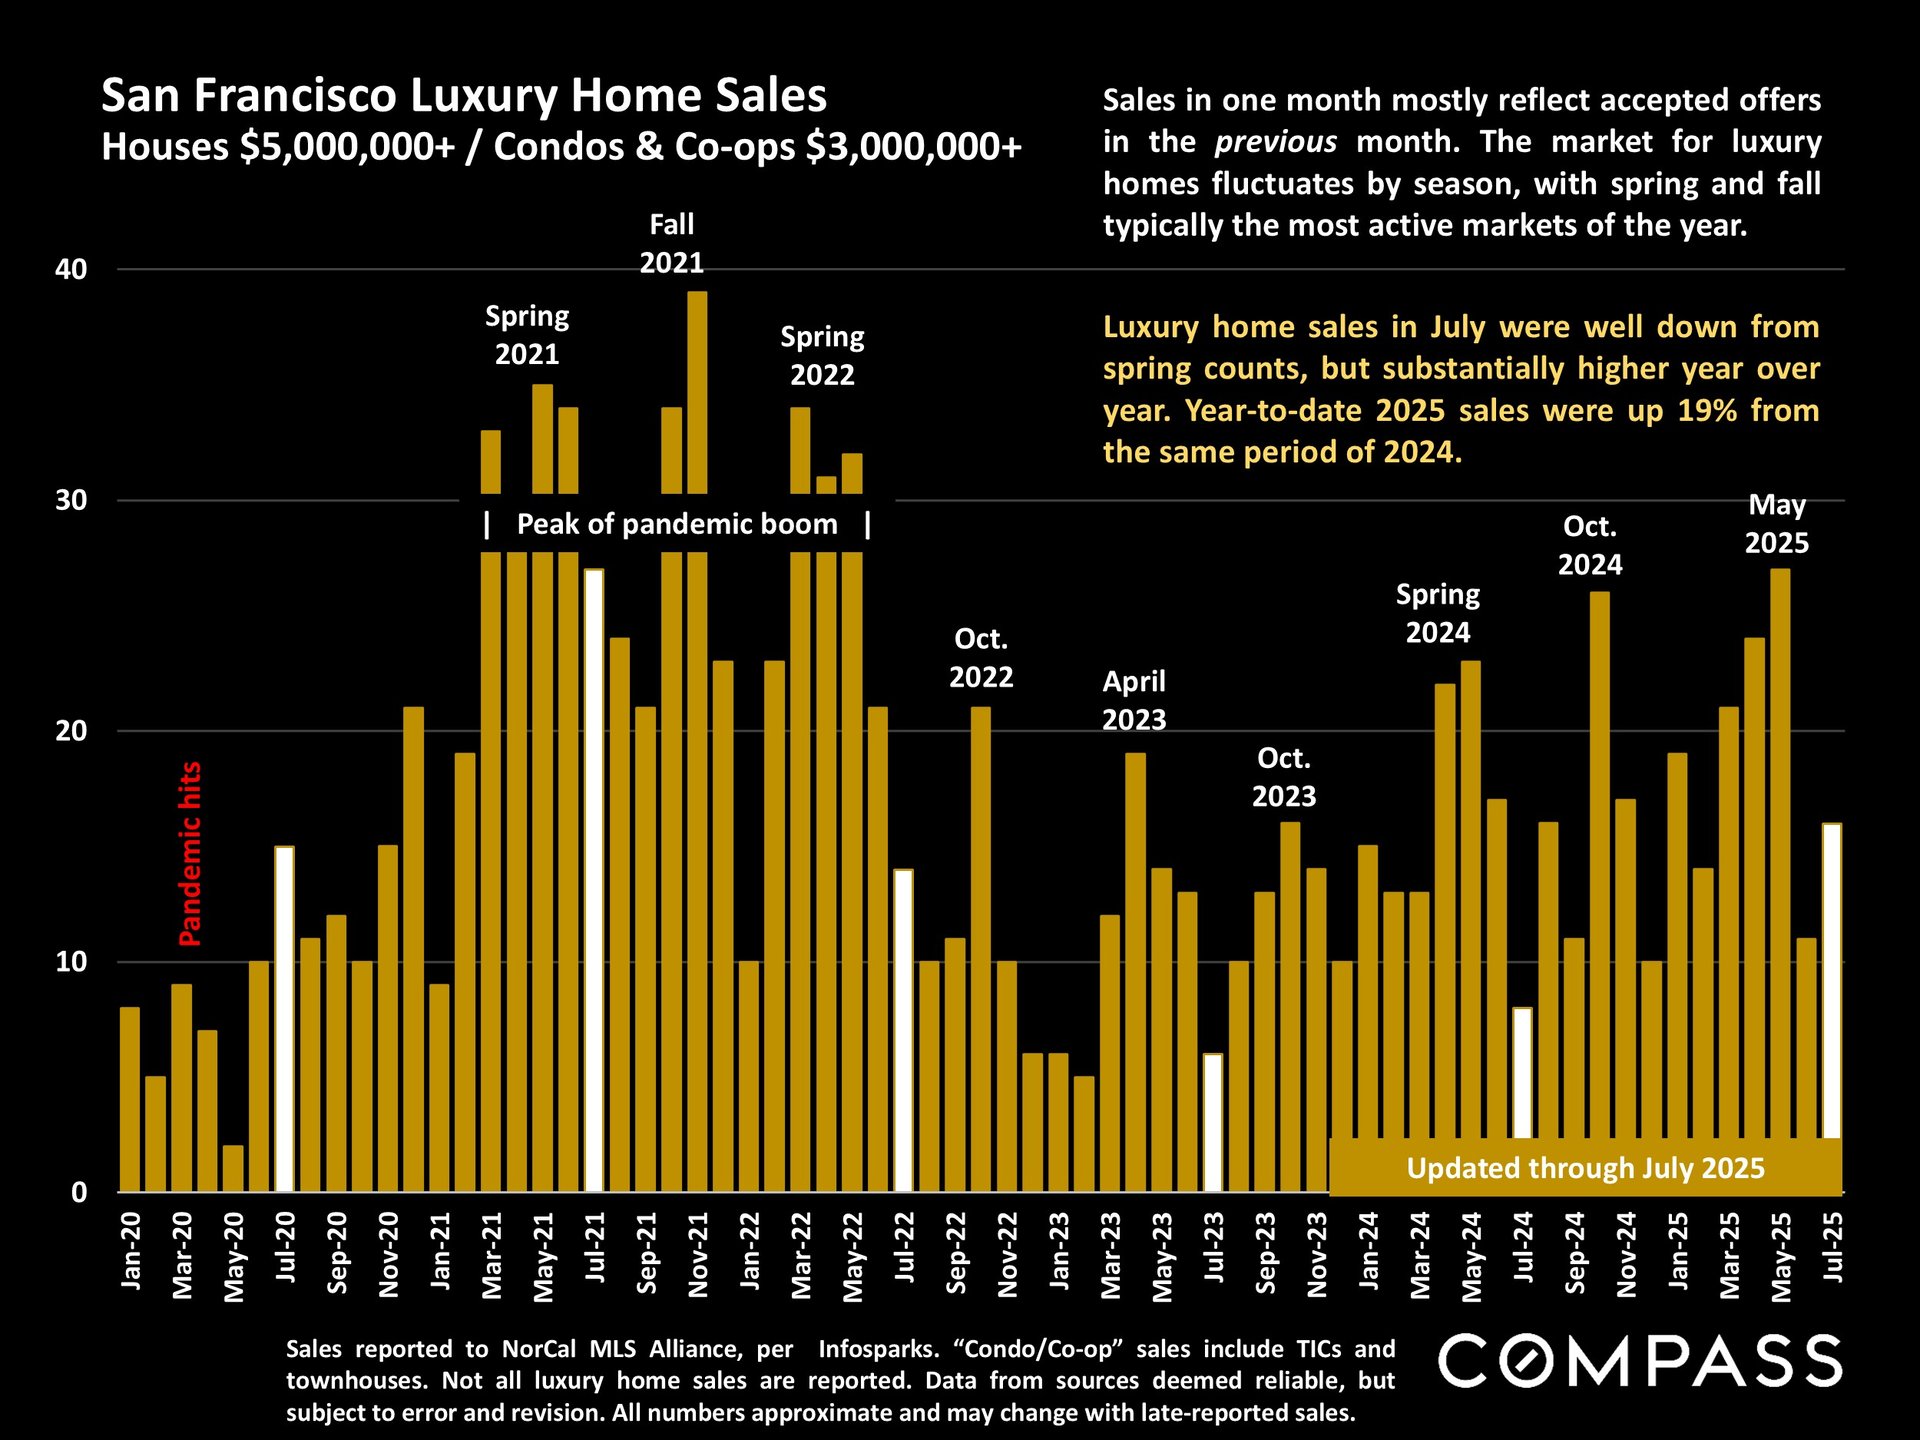
Bar chart of San Francisco luxury home sales from 2020 to July 2025, with pandemic milestones and 2025 year-to-date gains.


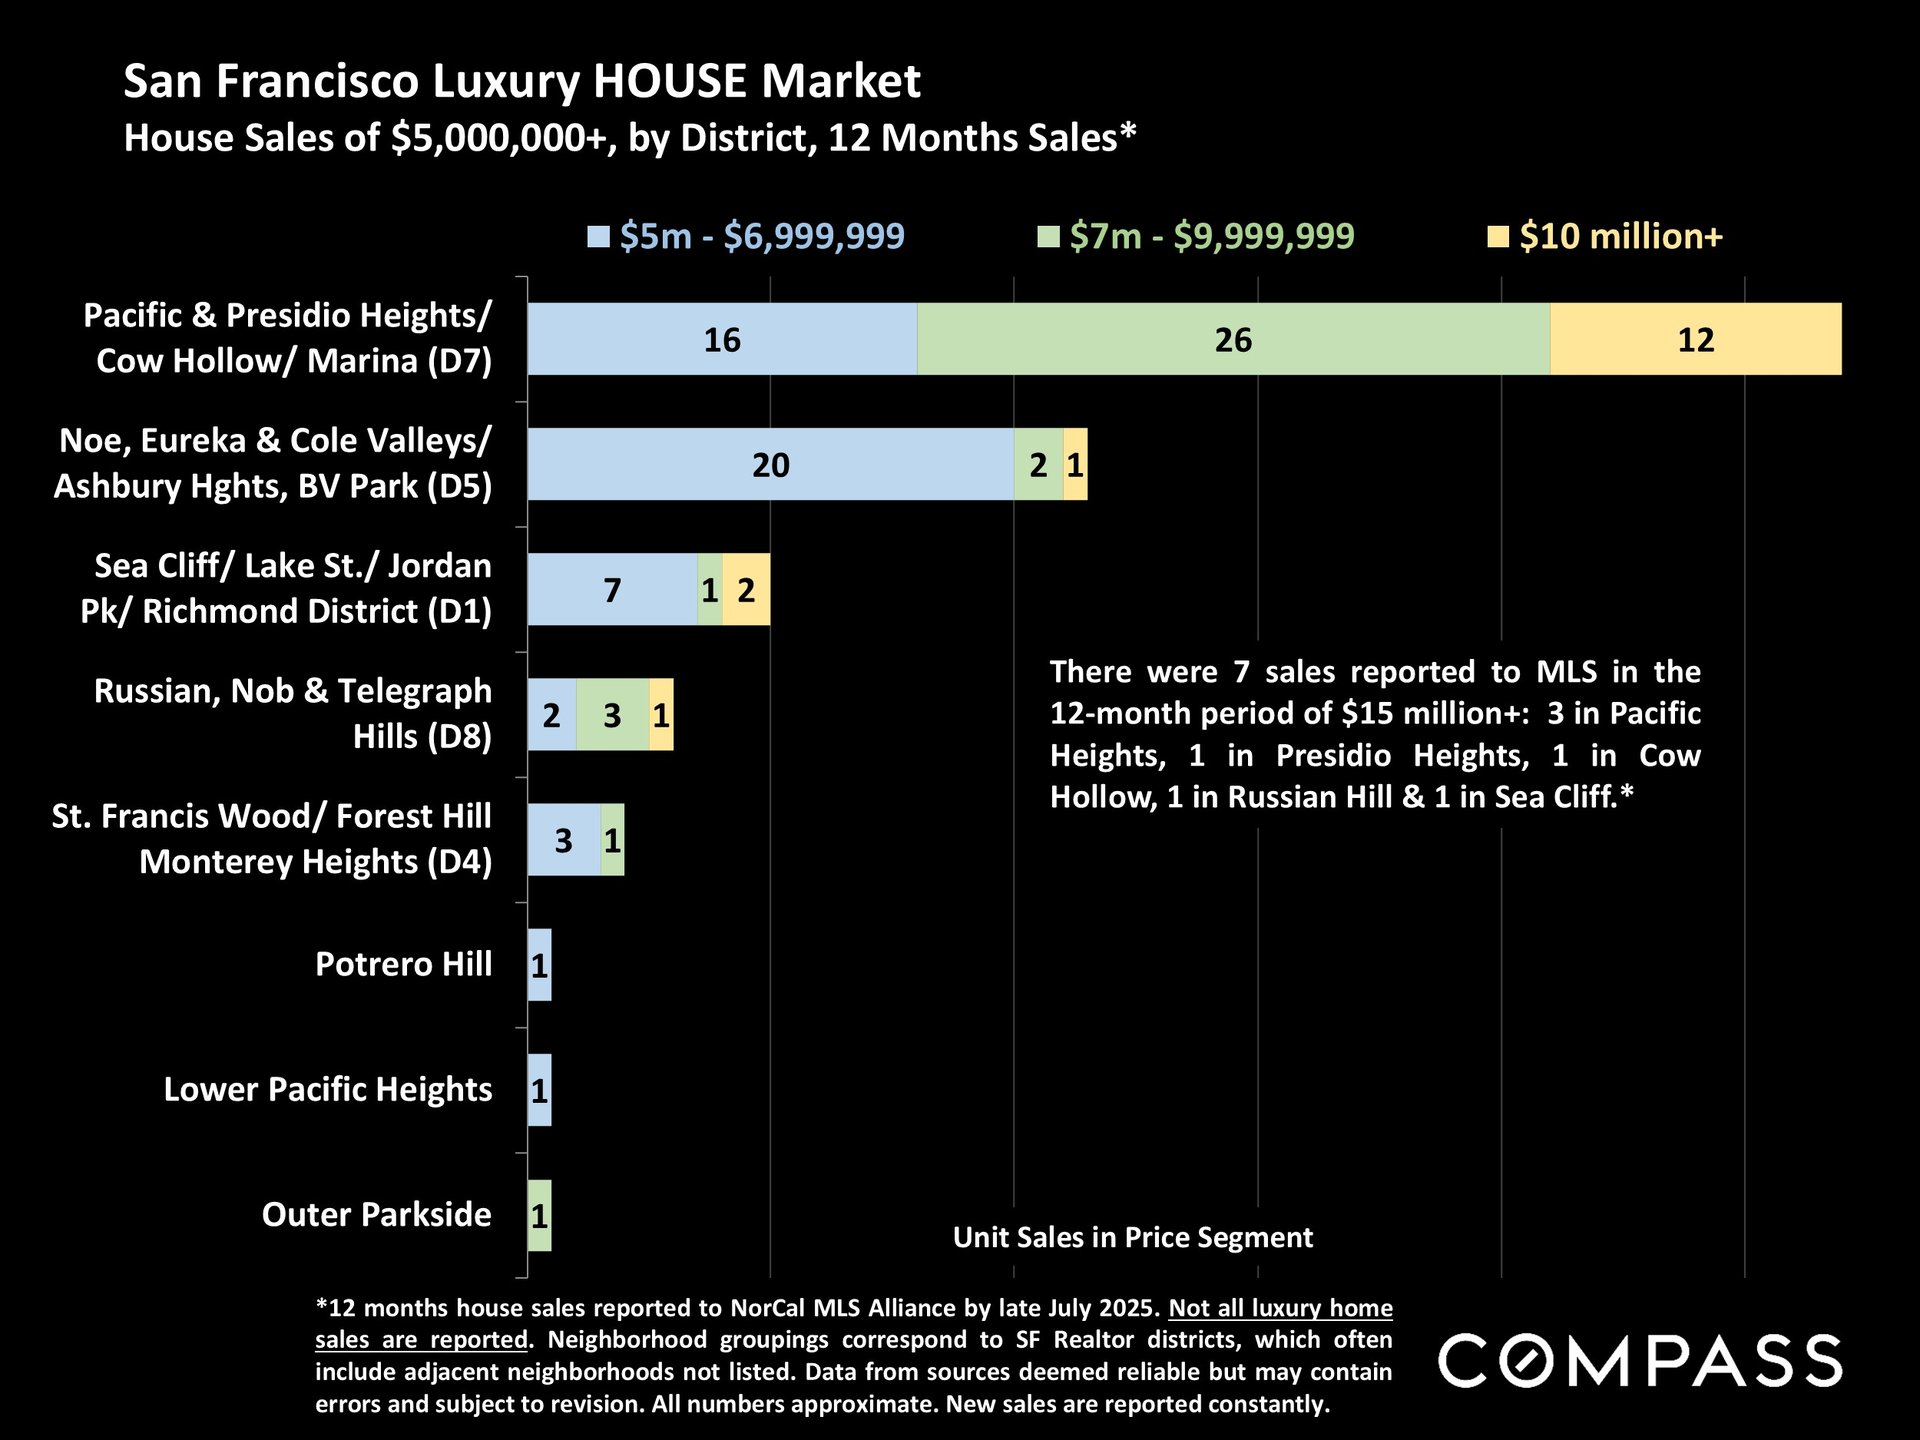
Chart of San Francisco luxury house sales by district and price segment, with Pacific Heights leading.


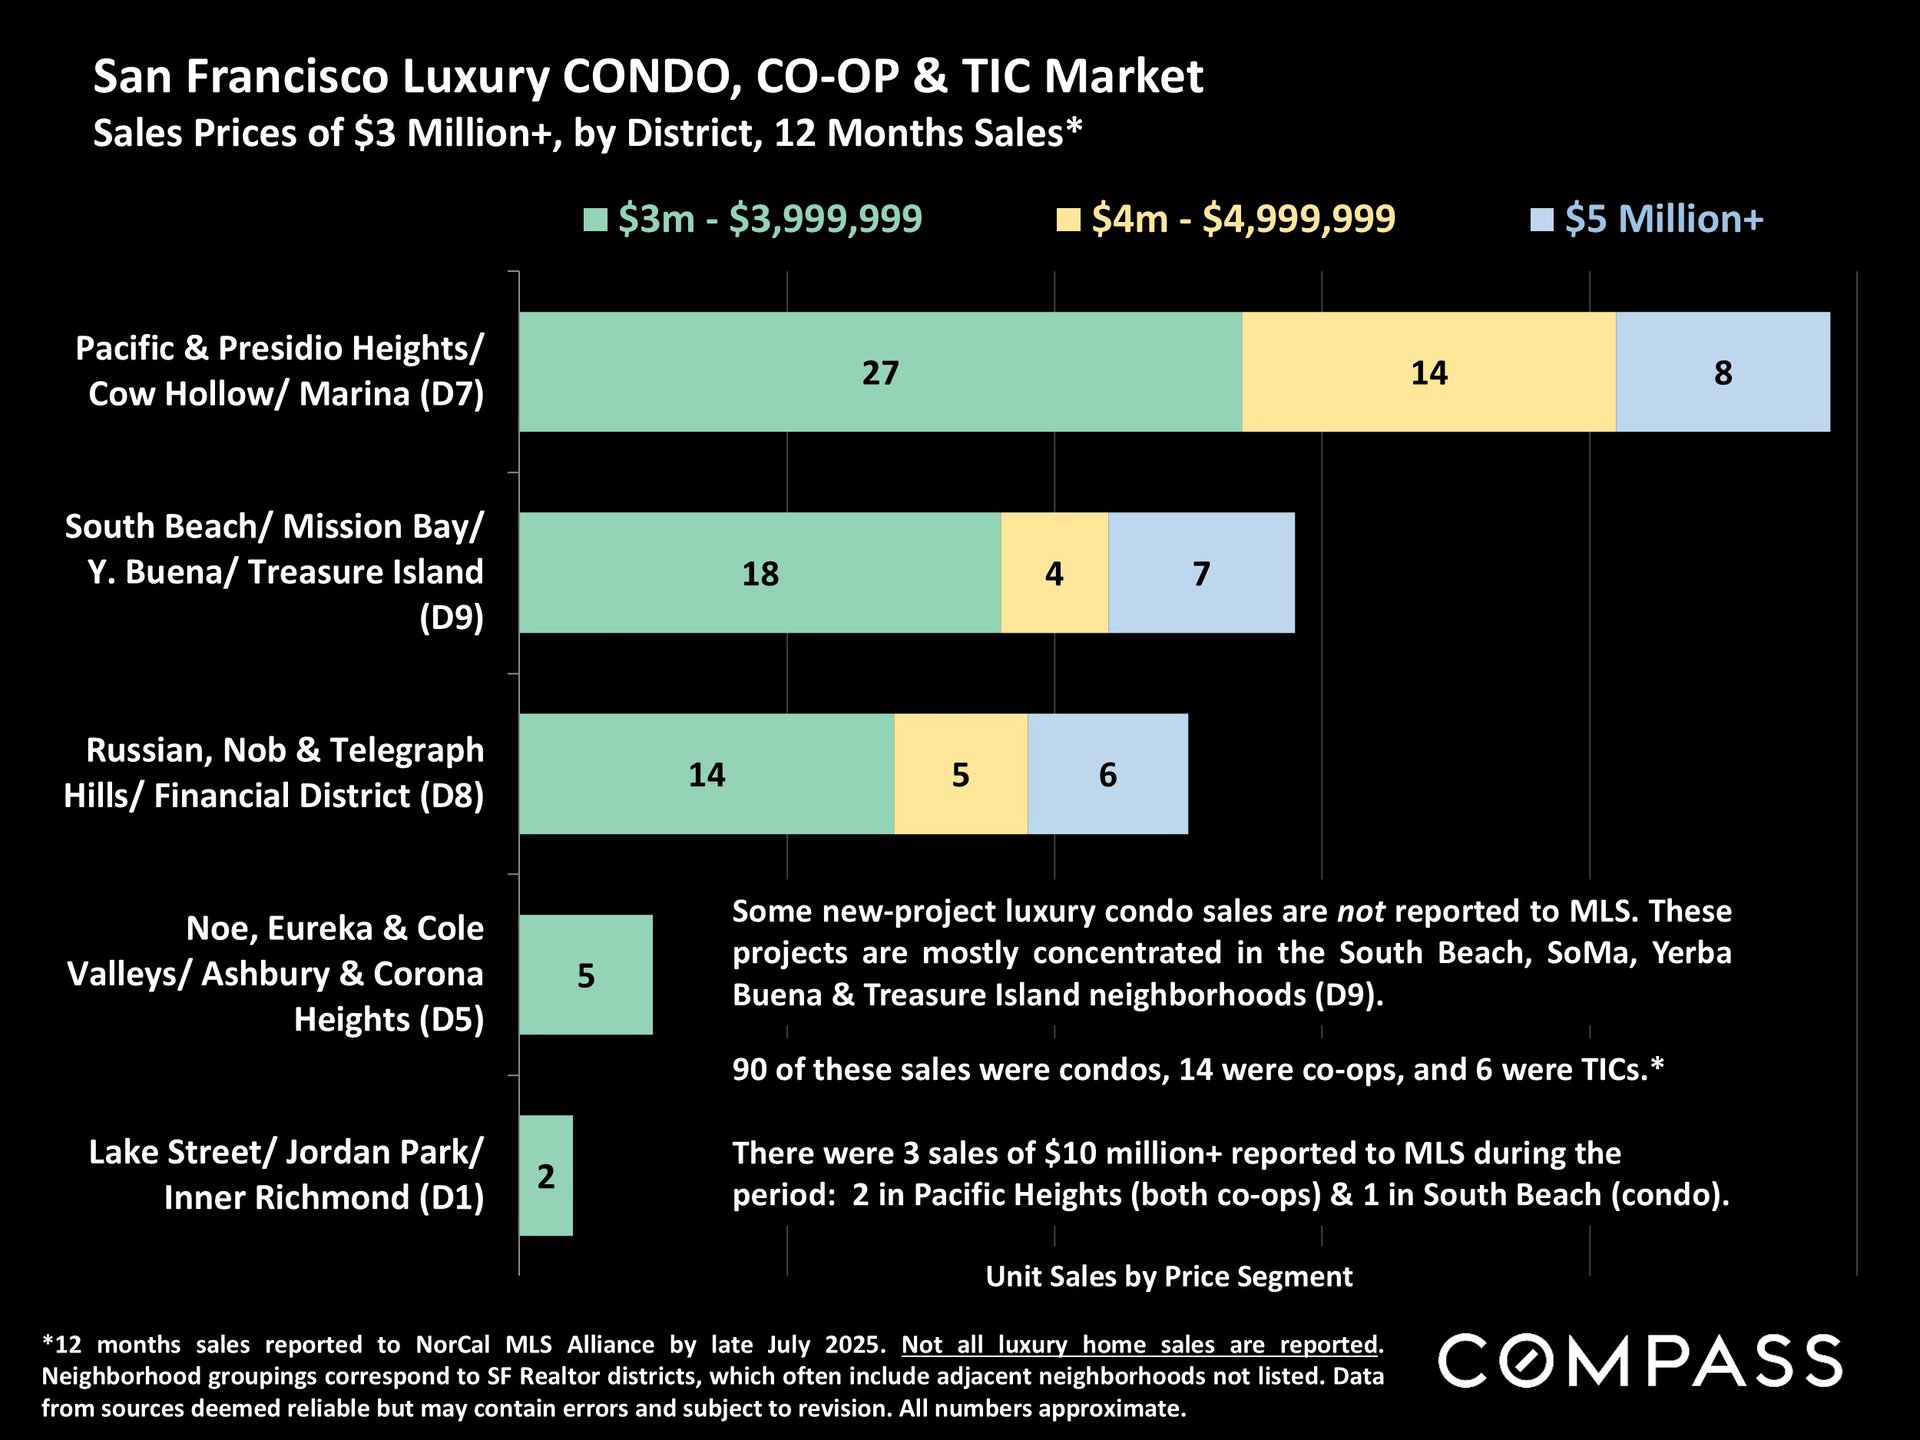
Chart compares San Francisco luxury condo, co-op, and TIC sales over $3 million by district and price segment.


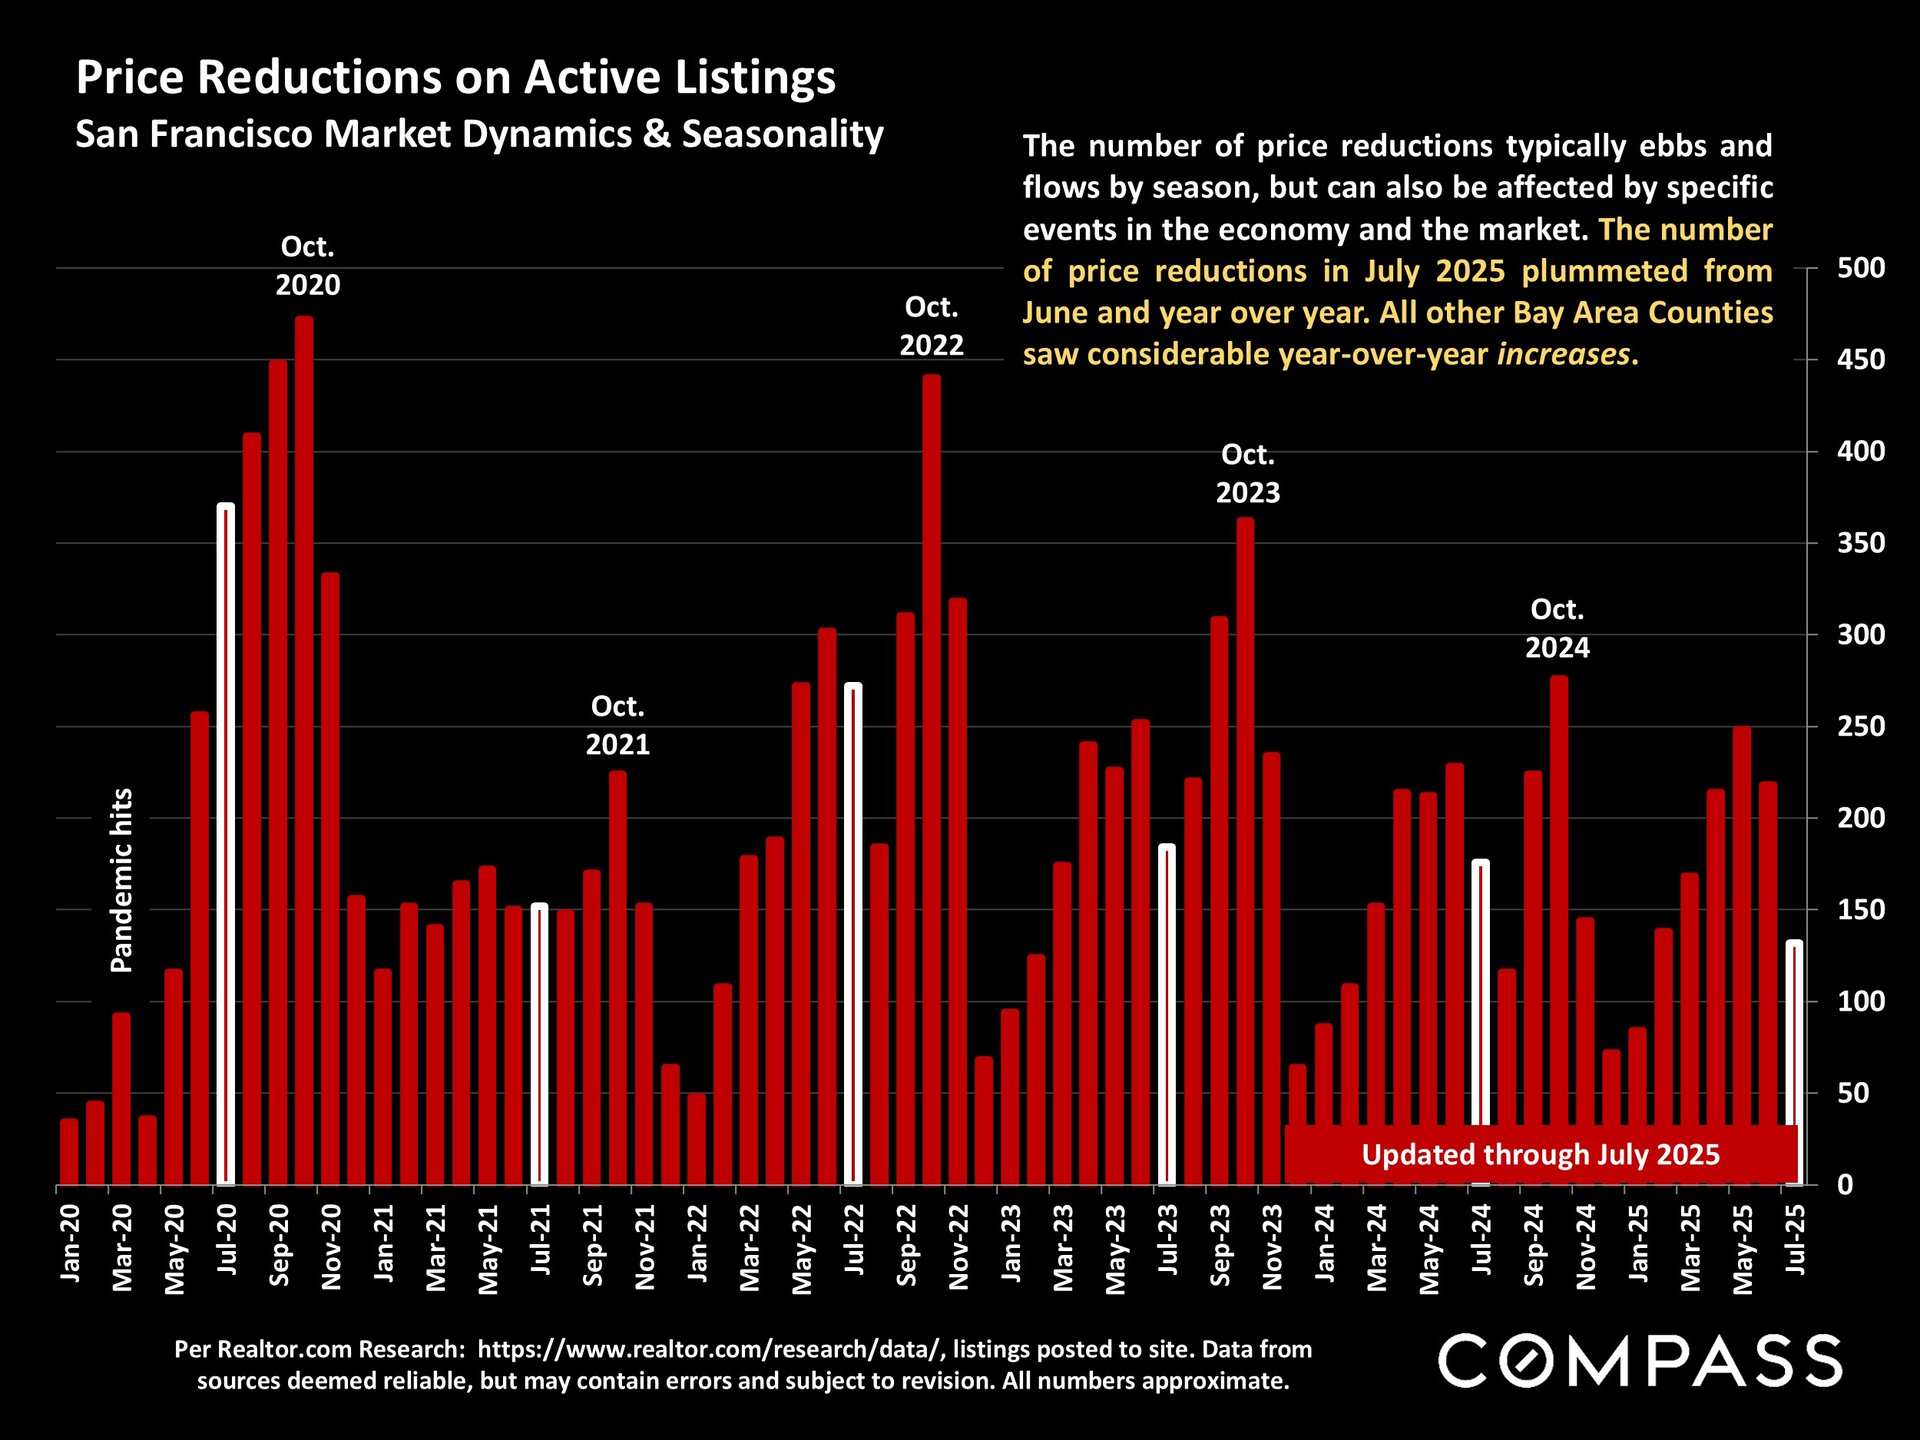
Chart of San Francisco active-listing price reductions from January 2020 through July 2025, with monthly bars and October peaks.


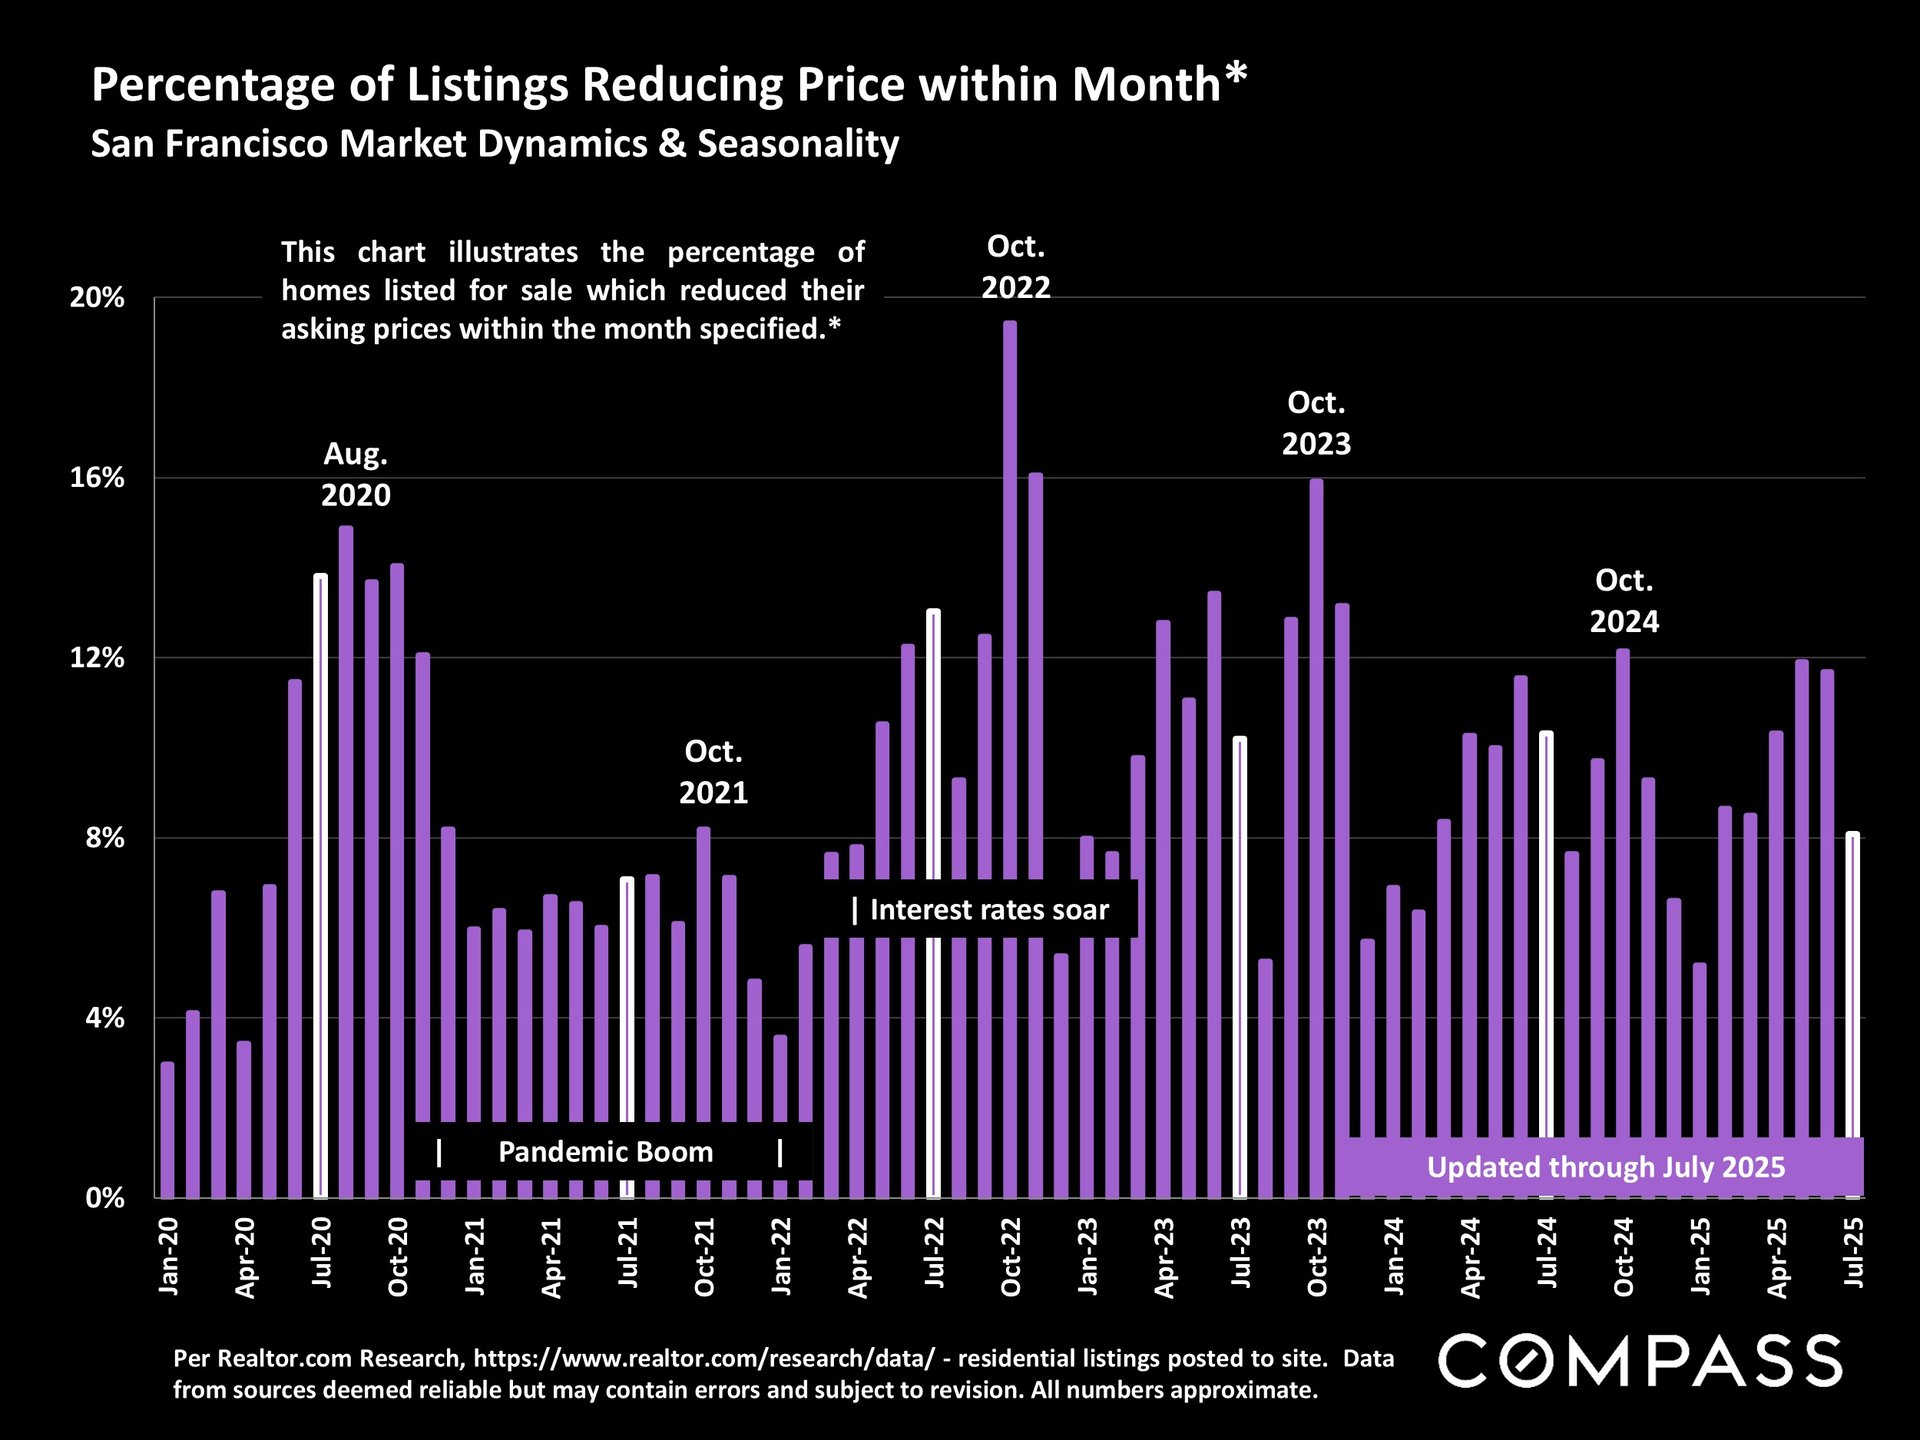
Bar chart of San Francisco listings reducing prices monthly, January 2020–July 2025, with pandemic and interest-rate callouts.


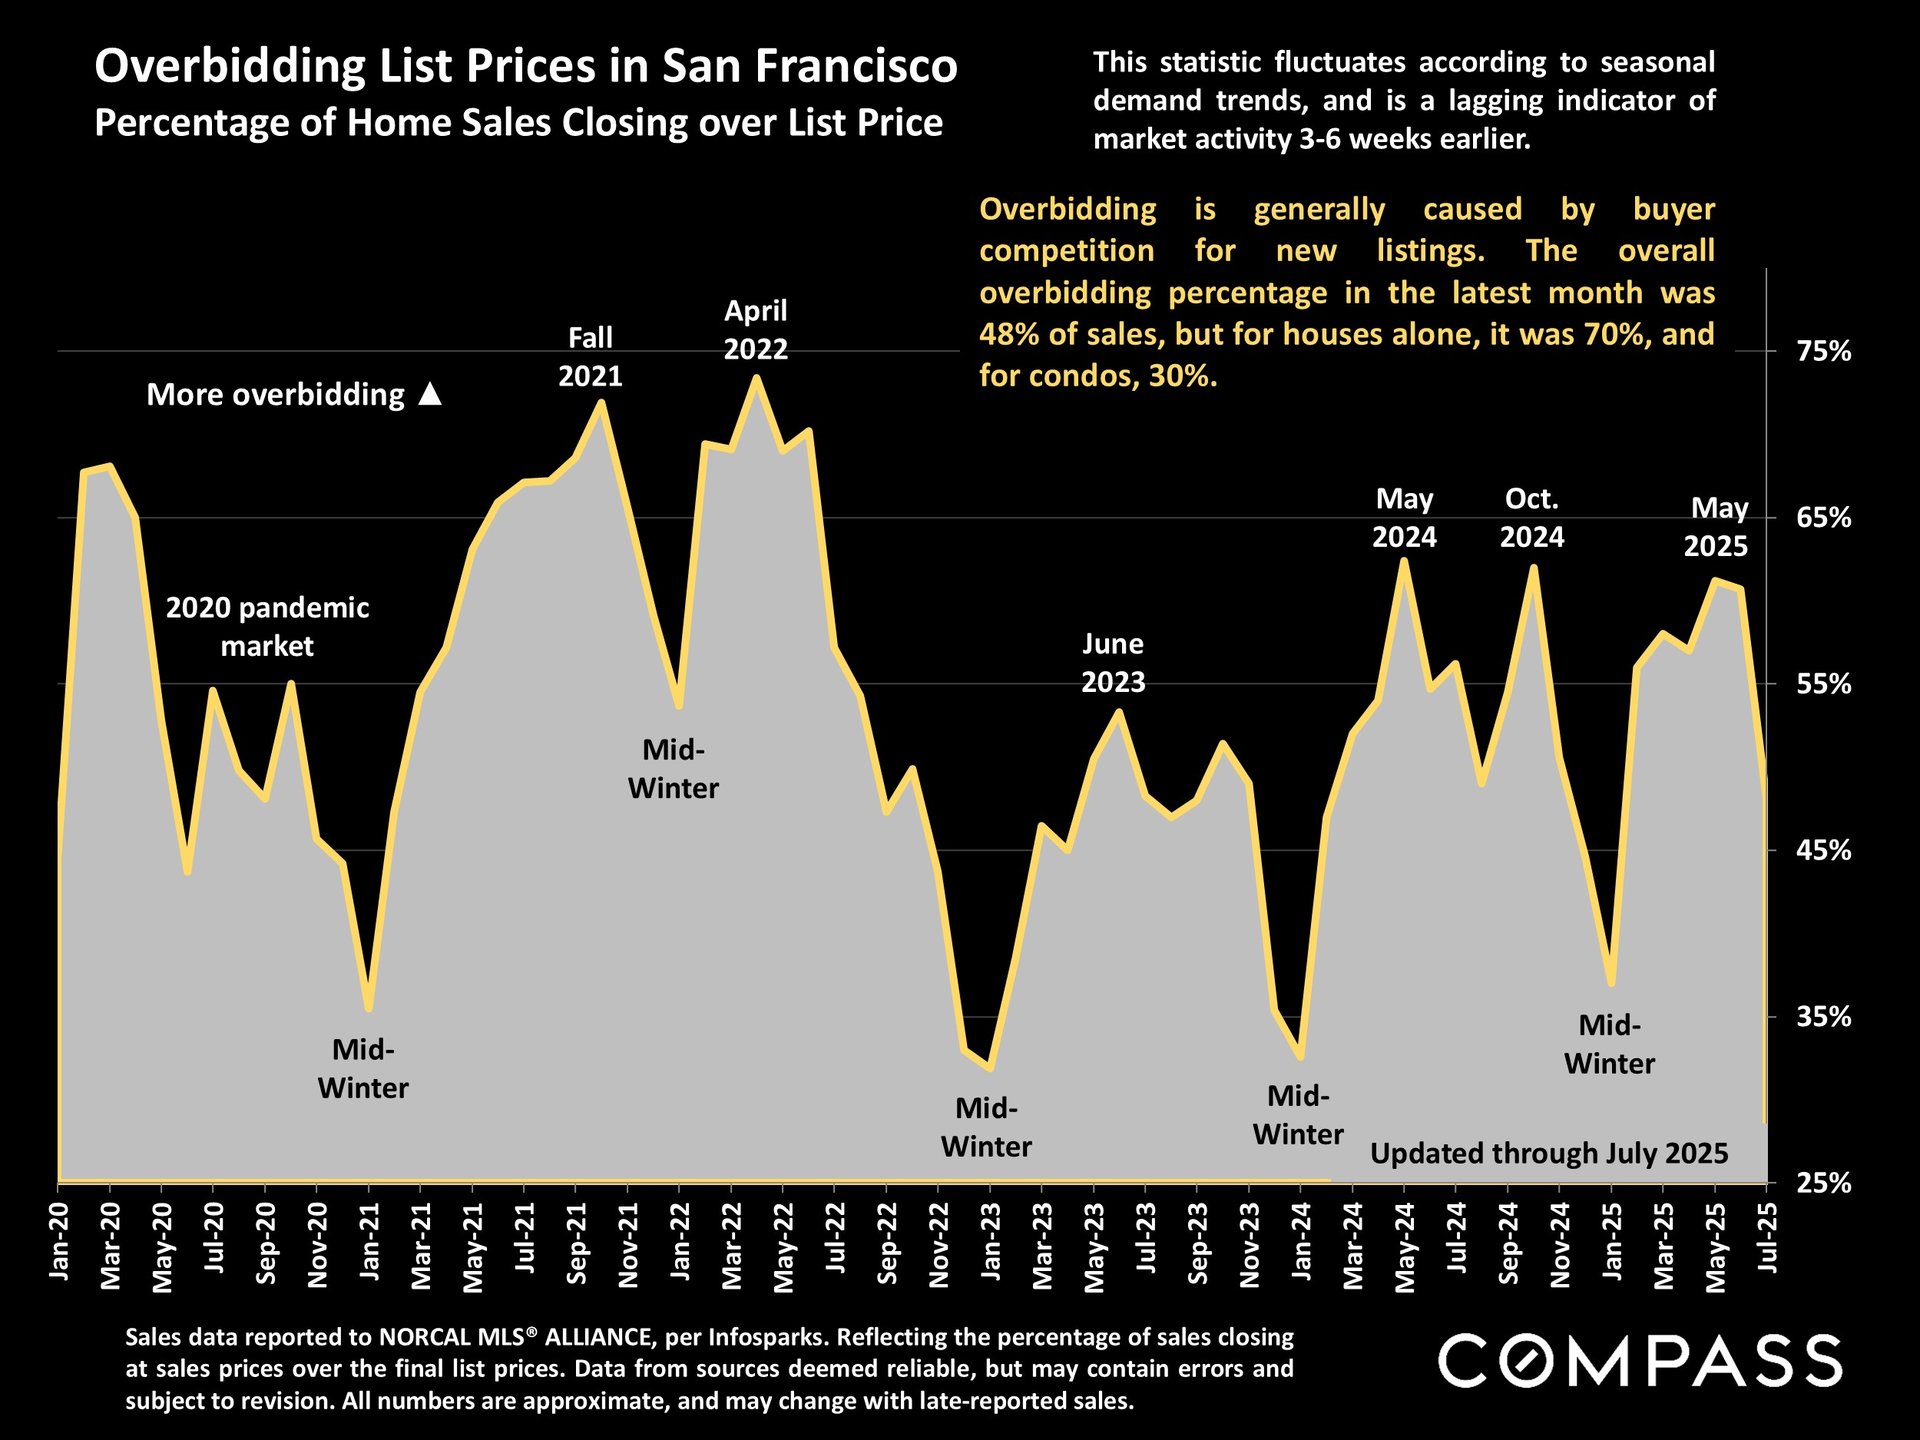
Chart of San Francisco home sales over list price, showing 48% overall in the latest month, updated through July 2025.


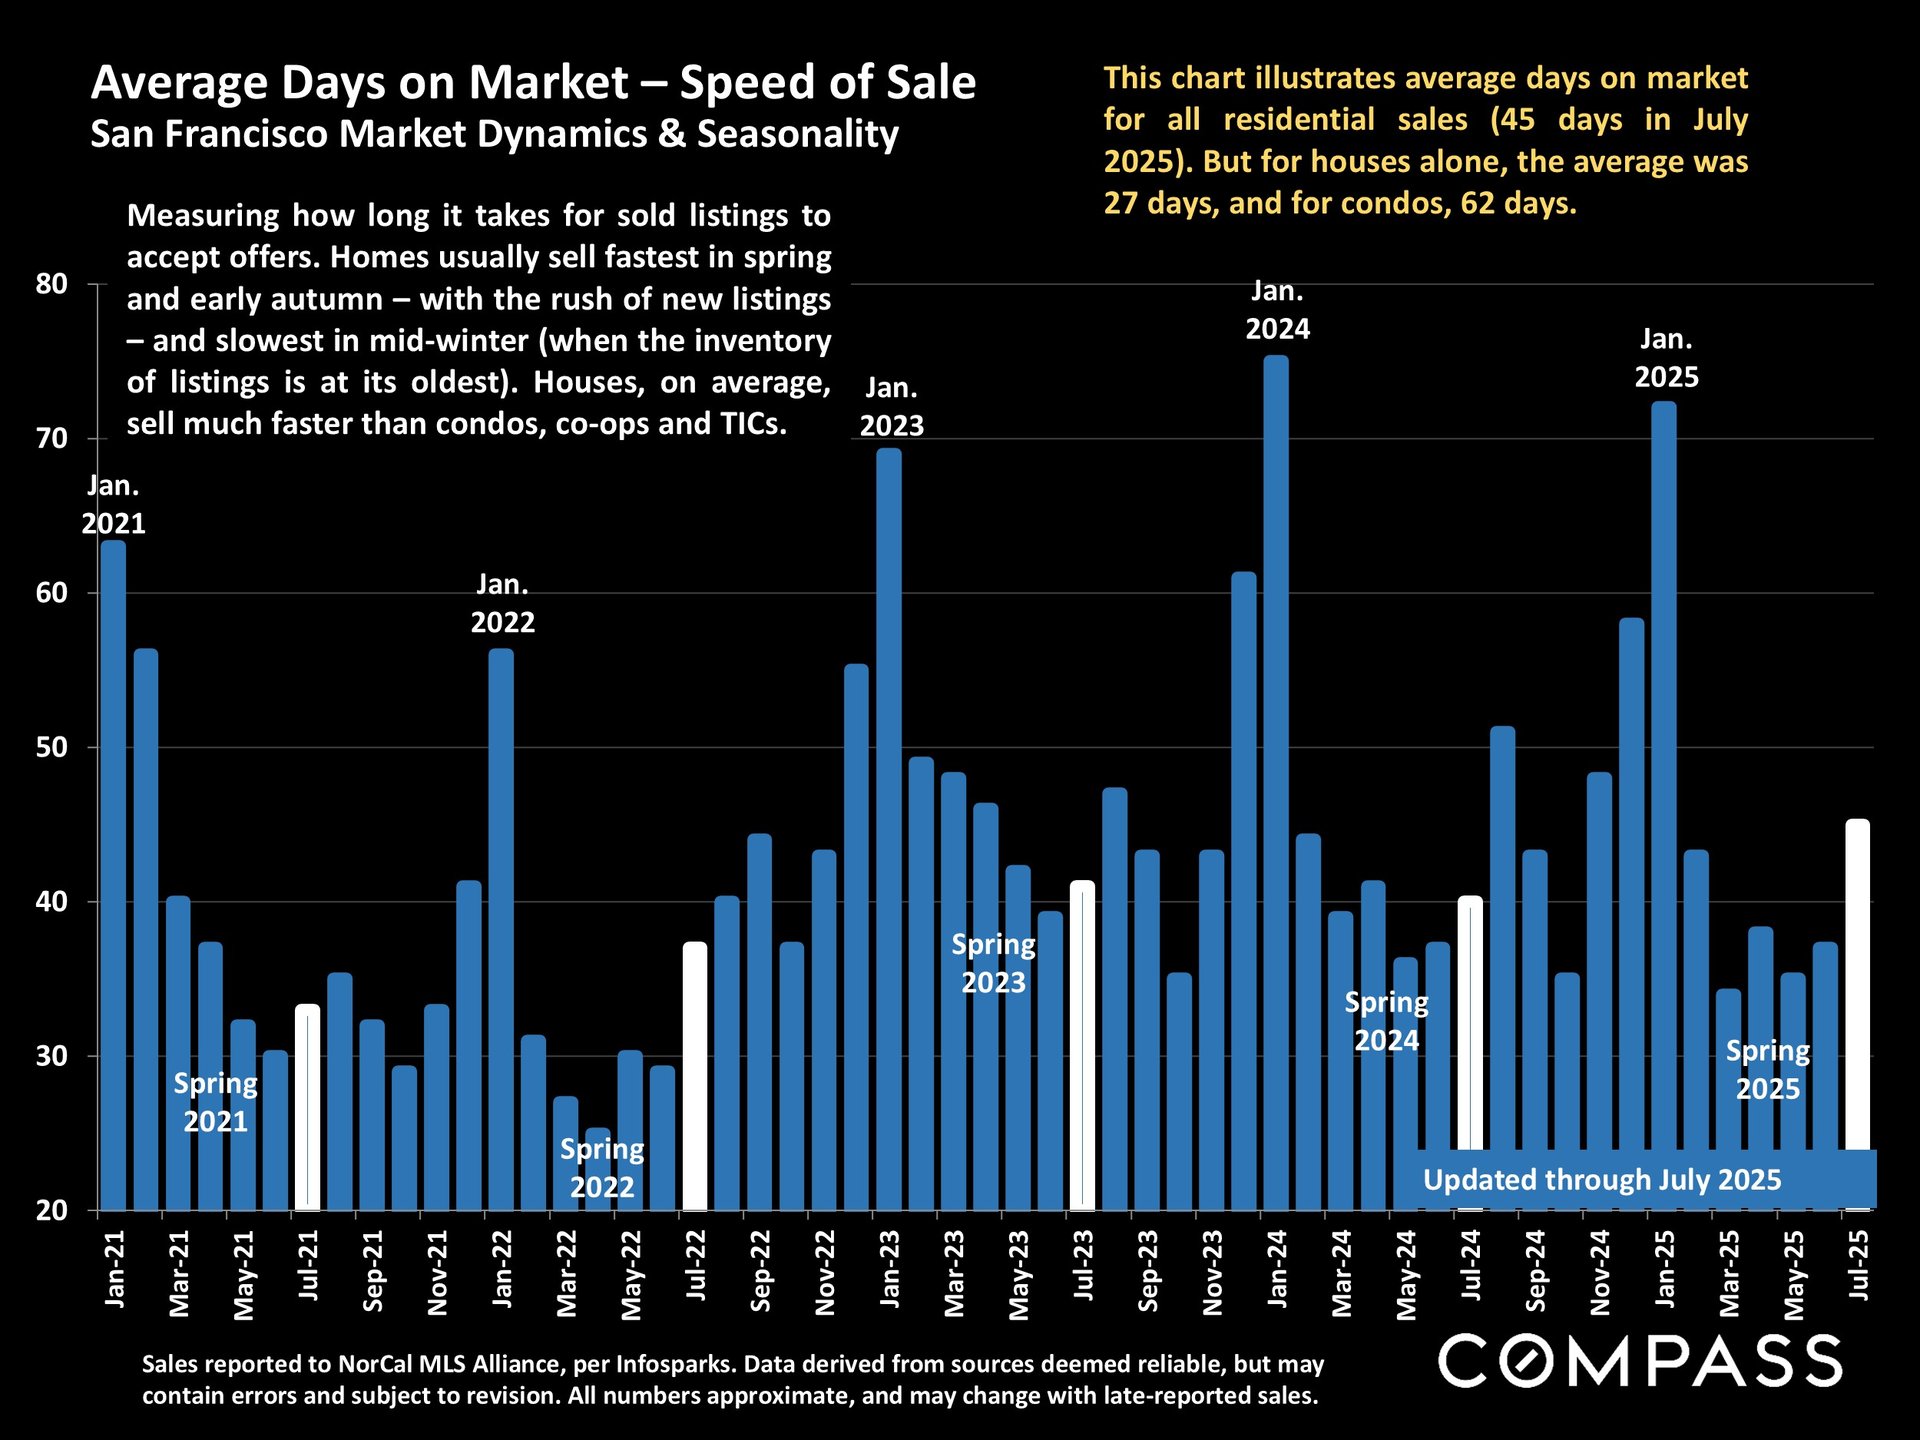
Chart of San Francisco days on market, January 2021–July 2025, with monthly bars and July 2025 category averages.


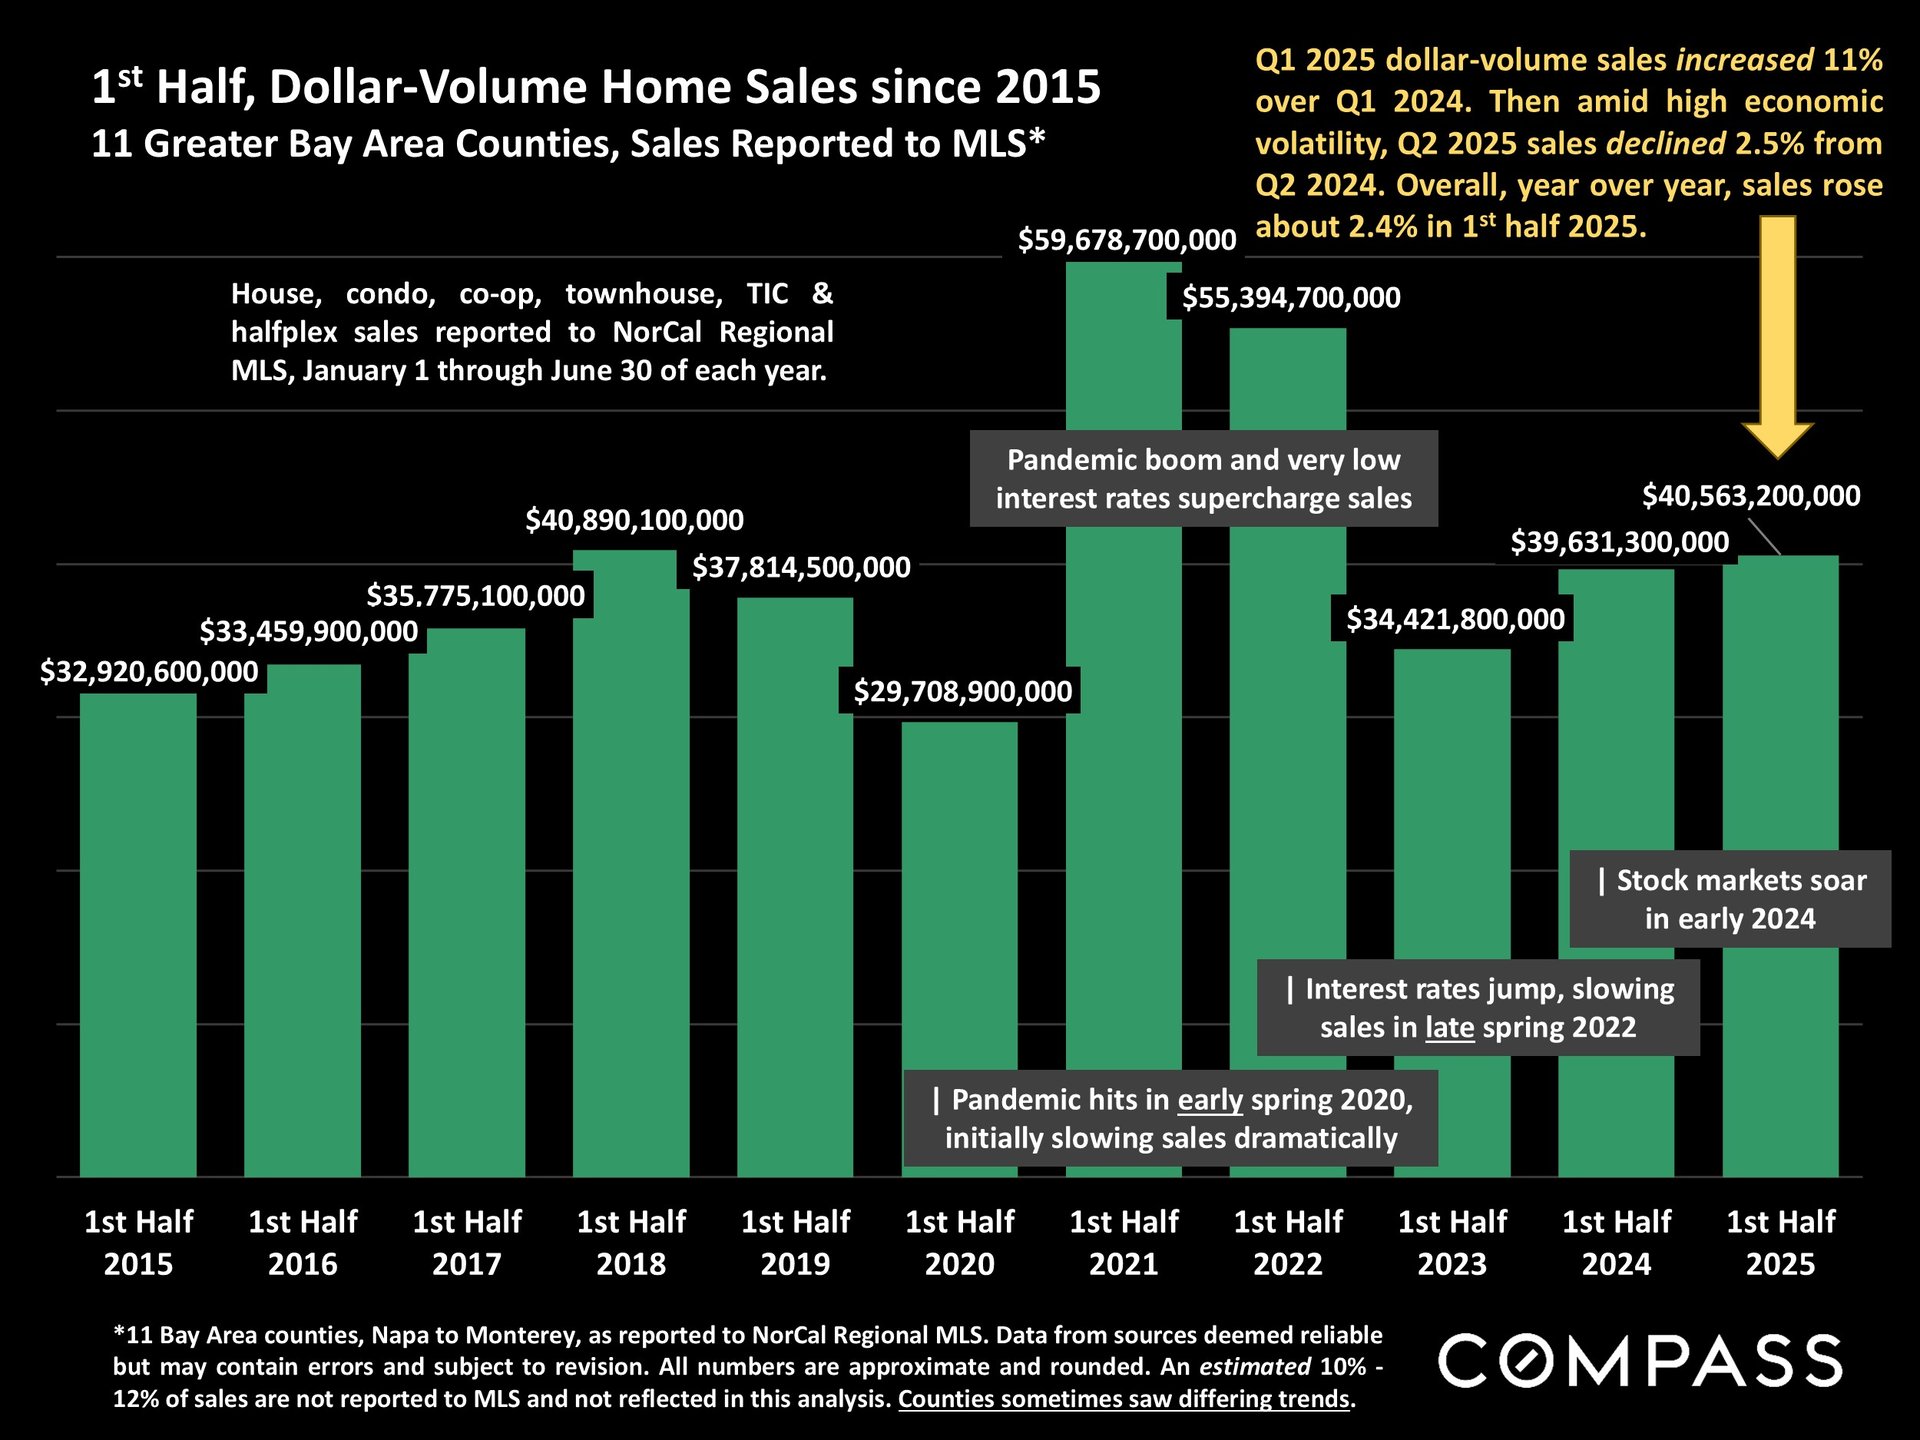
Bar chart of Greater Bay Area first-half home sales, peaking in 2021 and reaching $40.6 billion in 2025.


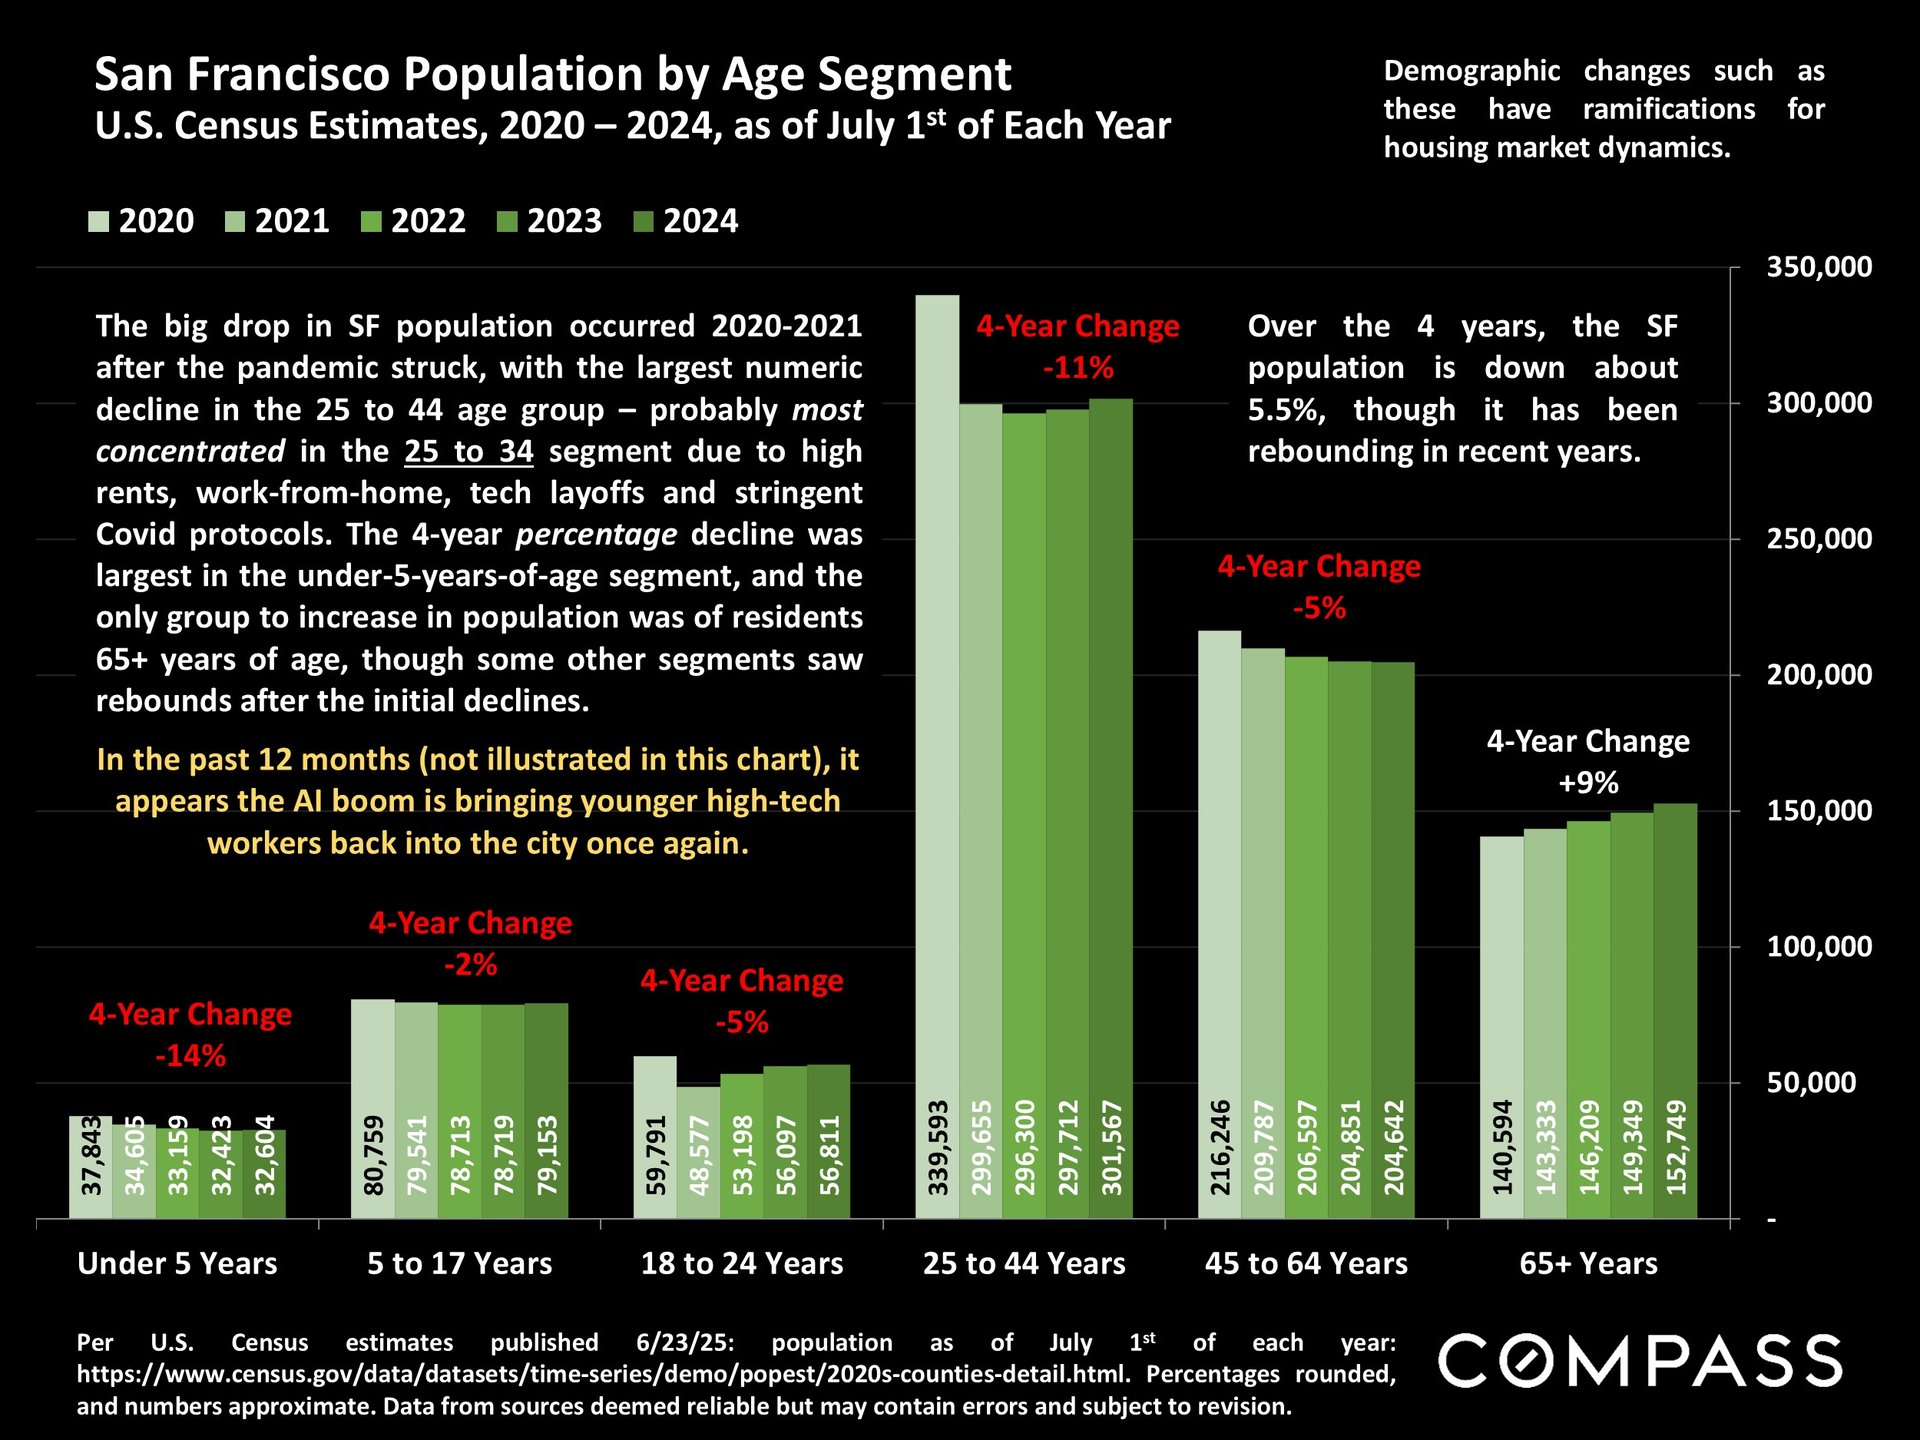
San Francisco population by age group, 2020–2024, with the largest decline among ages 25 to 44.


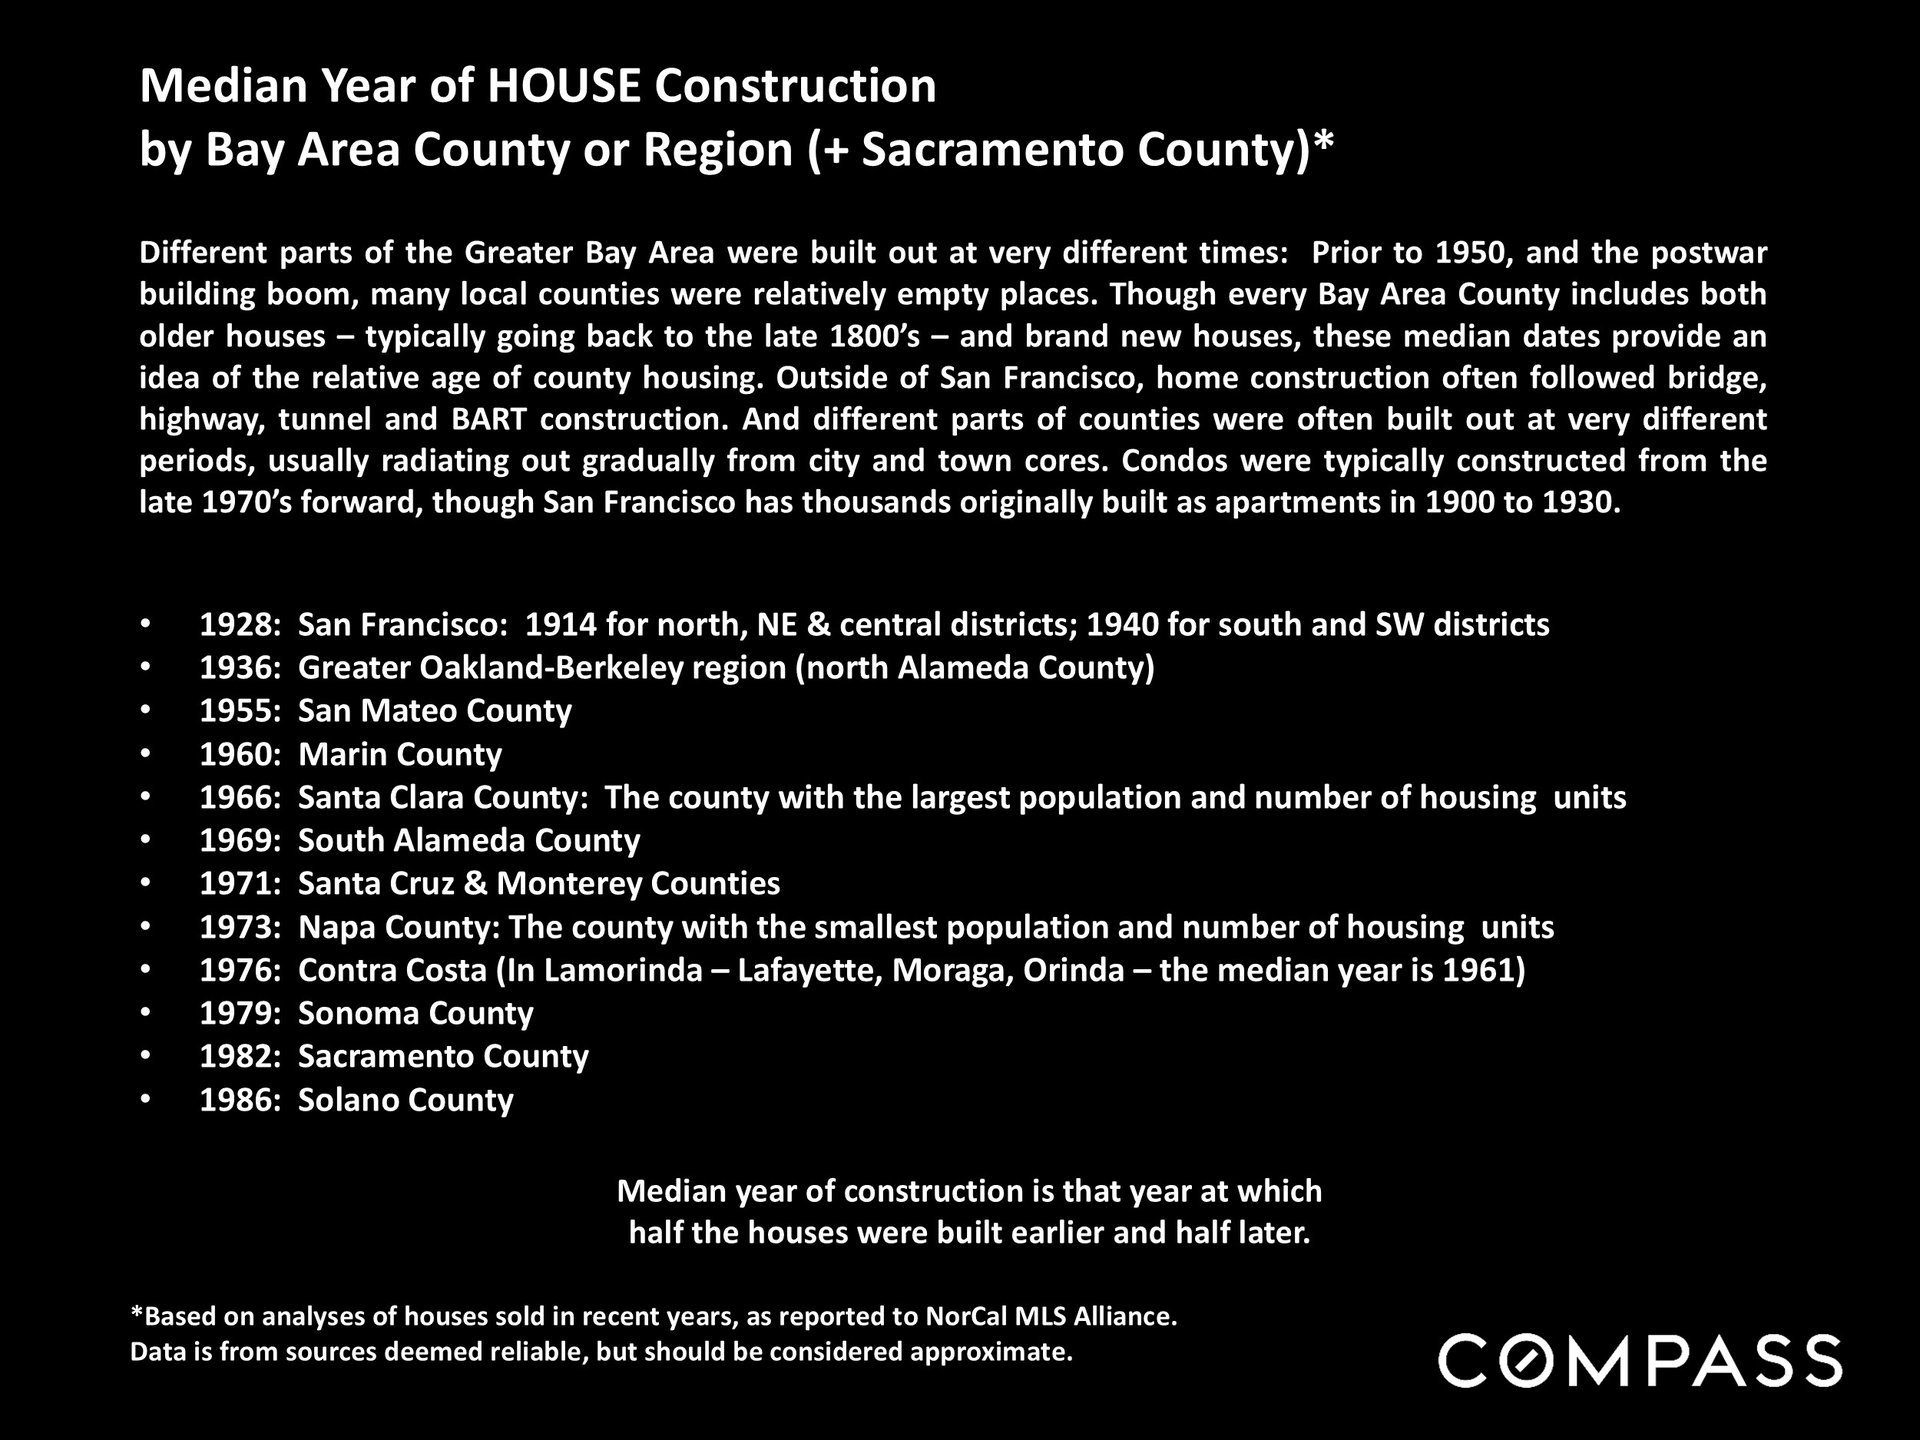
Infographic listing median house construction years across Bay Area counties and regions, with San Francisco at 1928 and Solano at 1986.


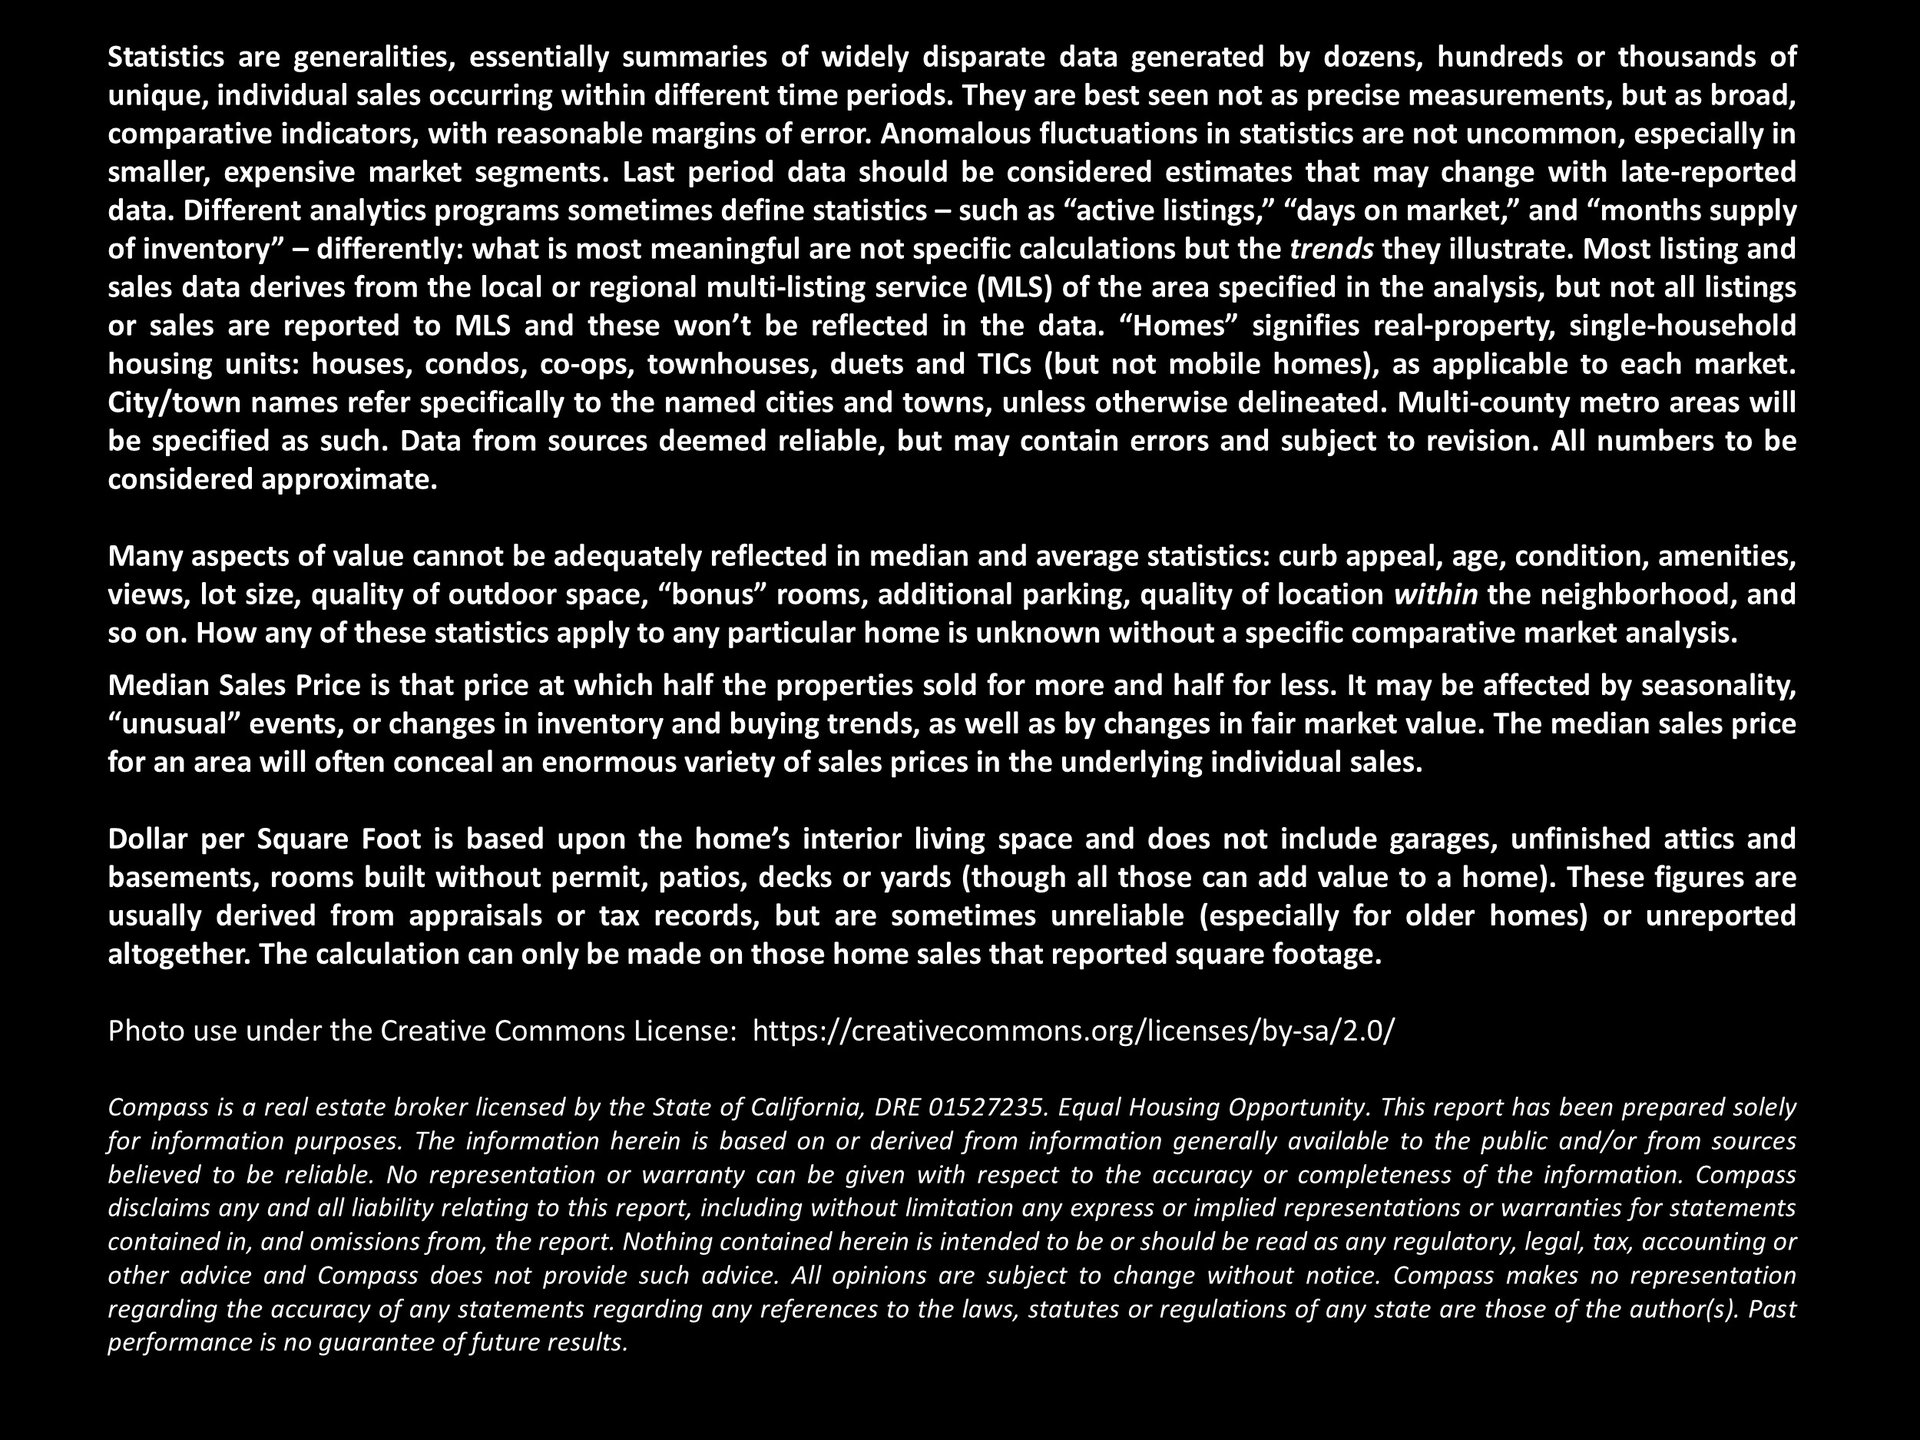
Market update notes explain real estate statistics, valuation measures, data limitations, and Compass legal disclosures.


Work With Us

We pride ourselves in providing personalized solutions that bring our clients closer to their dream properties and enhance their long-term wealth.
Contact Us

Follow Us On Instagram