Blog

San Francisco 2026 June Market Update

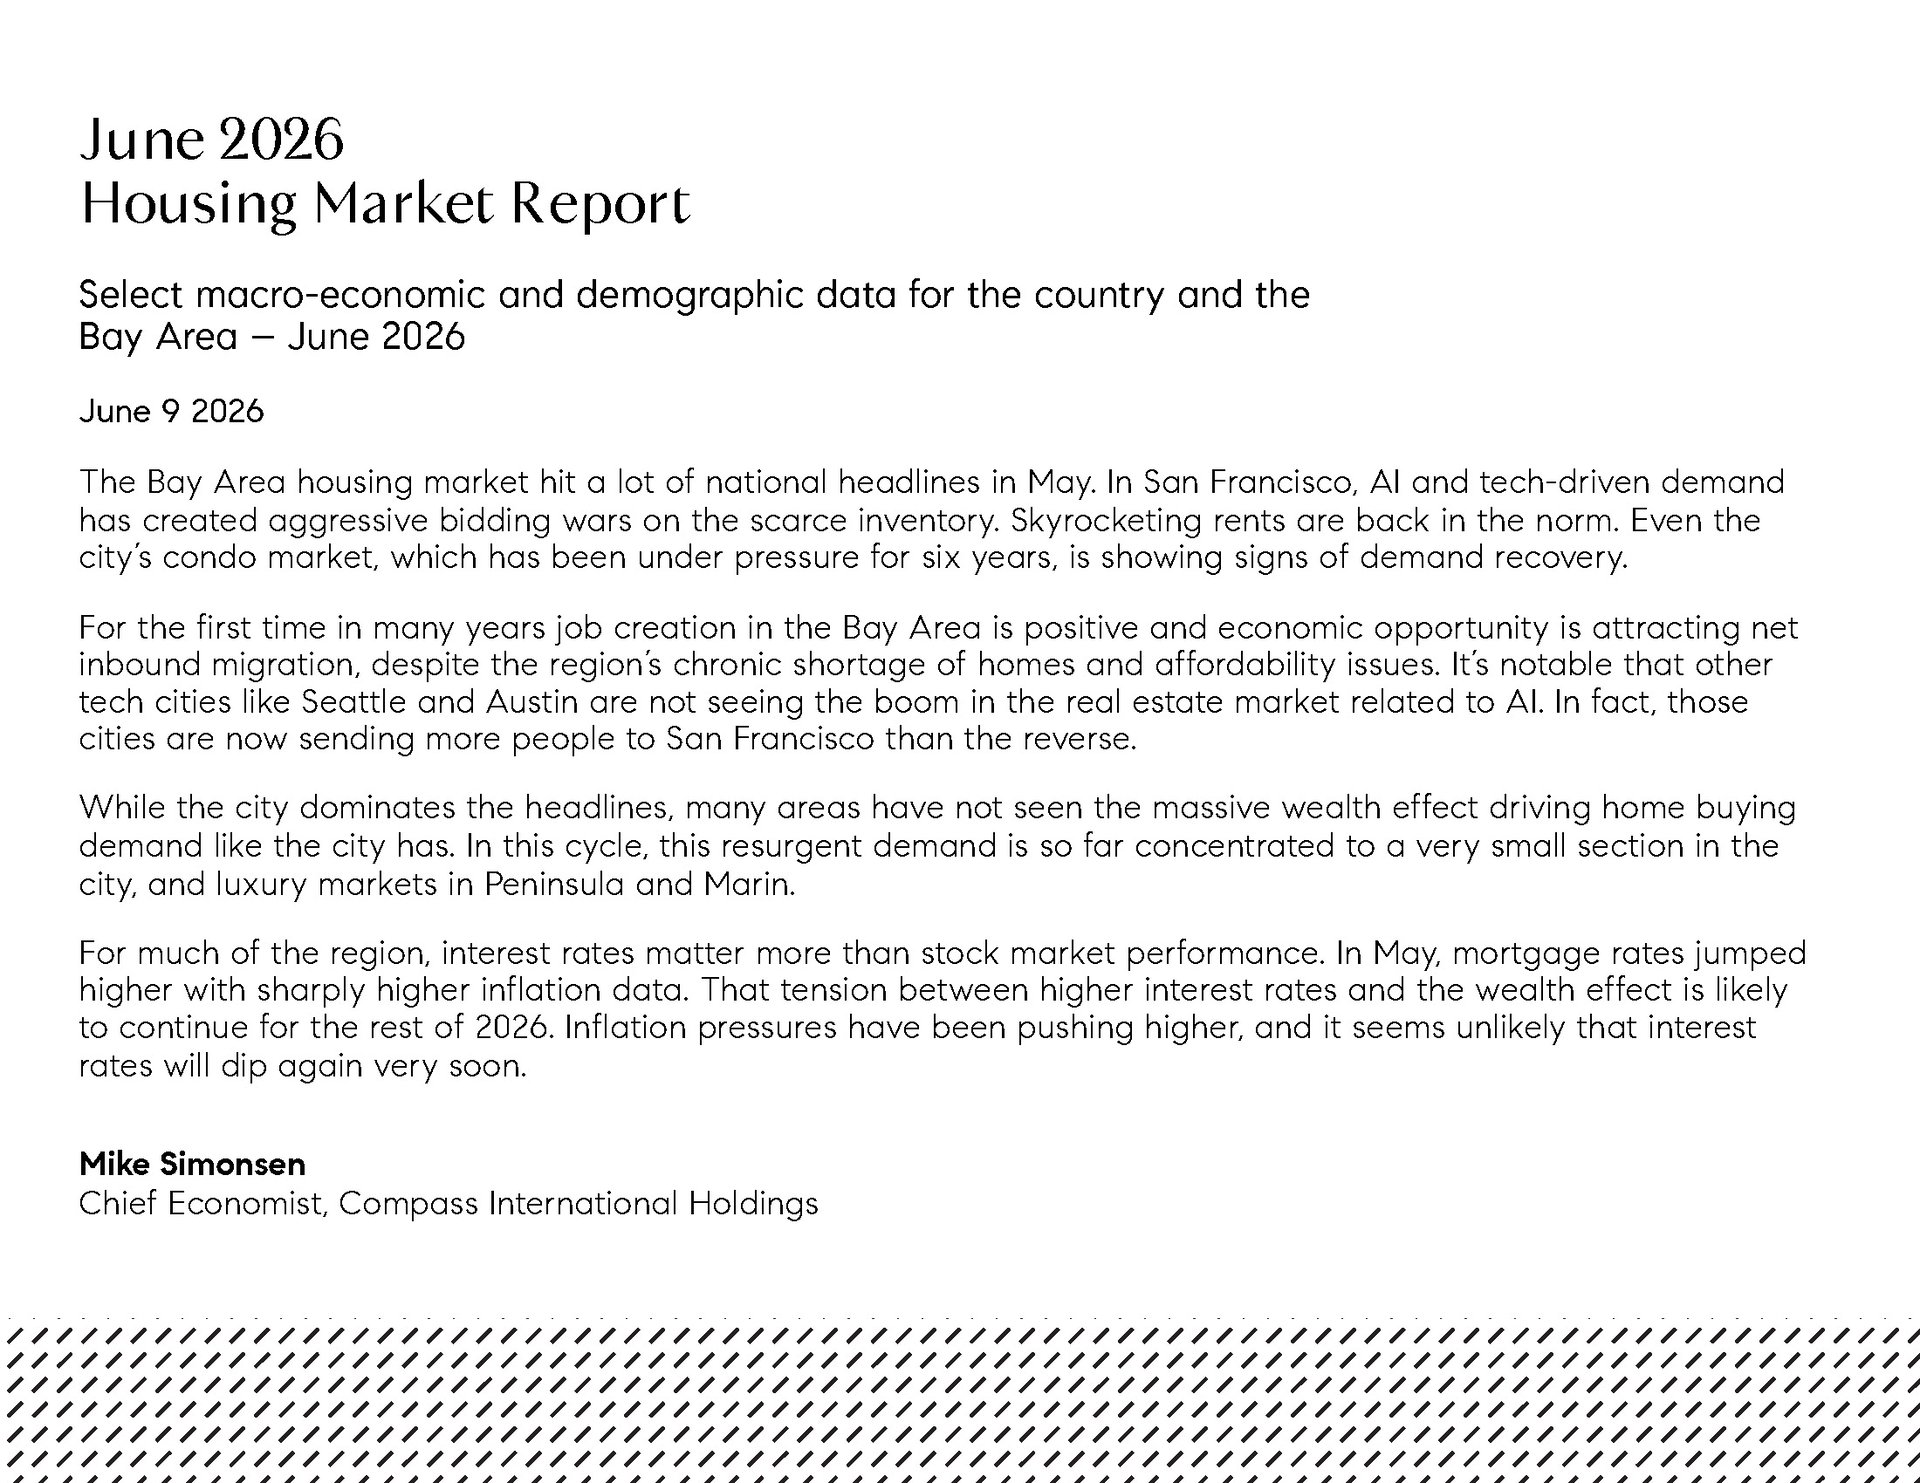
The Bay Area housing market hit a lot of national headlines in May. In San Francisco, AI and tech-driven demand has created aggressive bidding wars on the scarce inventory. Skyrocketing rents are back in the norm. Even the city’s condo market, which has been under pressure for six years, is showing signs of demand recovery. For the first time in many years job creation in the Bay Area is positive and economic opportunity is attracting net inbound migration, despite the region’s chronic shortage of homes and affordability issues. It’s notable that other tech cities like Seattle and Austin are not seeing the boom in the real estate market related to AI. In fact, those cities are now sending more people to San Francisco than the reverse. While the city dominates the headlines, many areas have not seen the massive wealth effect driving home buying demand like the city has. In this cycle, this resurgent demand is so far concentrated to a very small section in the city, and luxury markets in Peninsula and Marin. For much of the region, interest rates matter more than stock market performance. In May, mortgage rates jumped higher with sharply higher inflation data. That tension between higher interest rates and the wealth effect is likely to continue for the rest of 2026. Inflation pressures have been pushing higher, and it seems unlikely that interest rates will dip again very soon.

Compass June 2026 San Francisco House & Condo Markets Market Outlook cover.


June 2026 housing market report discussing Bay Area and San Francisco market trends.


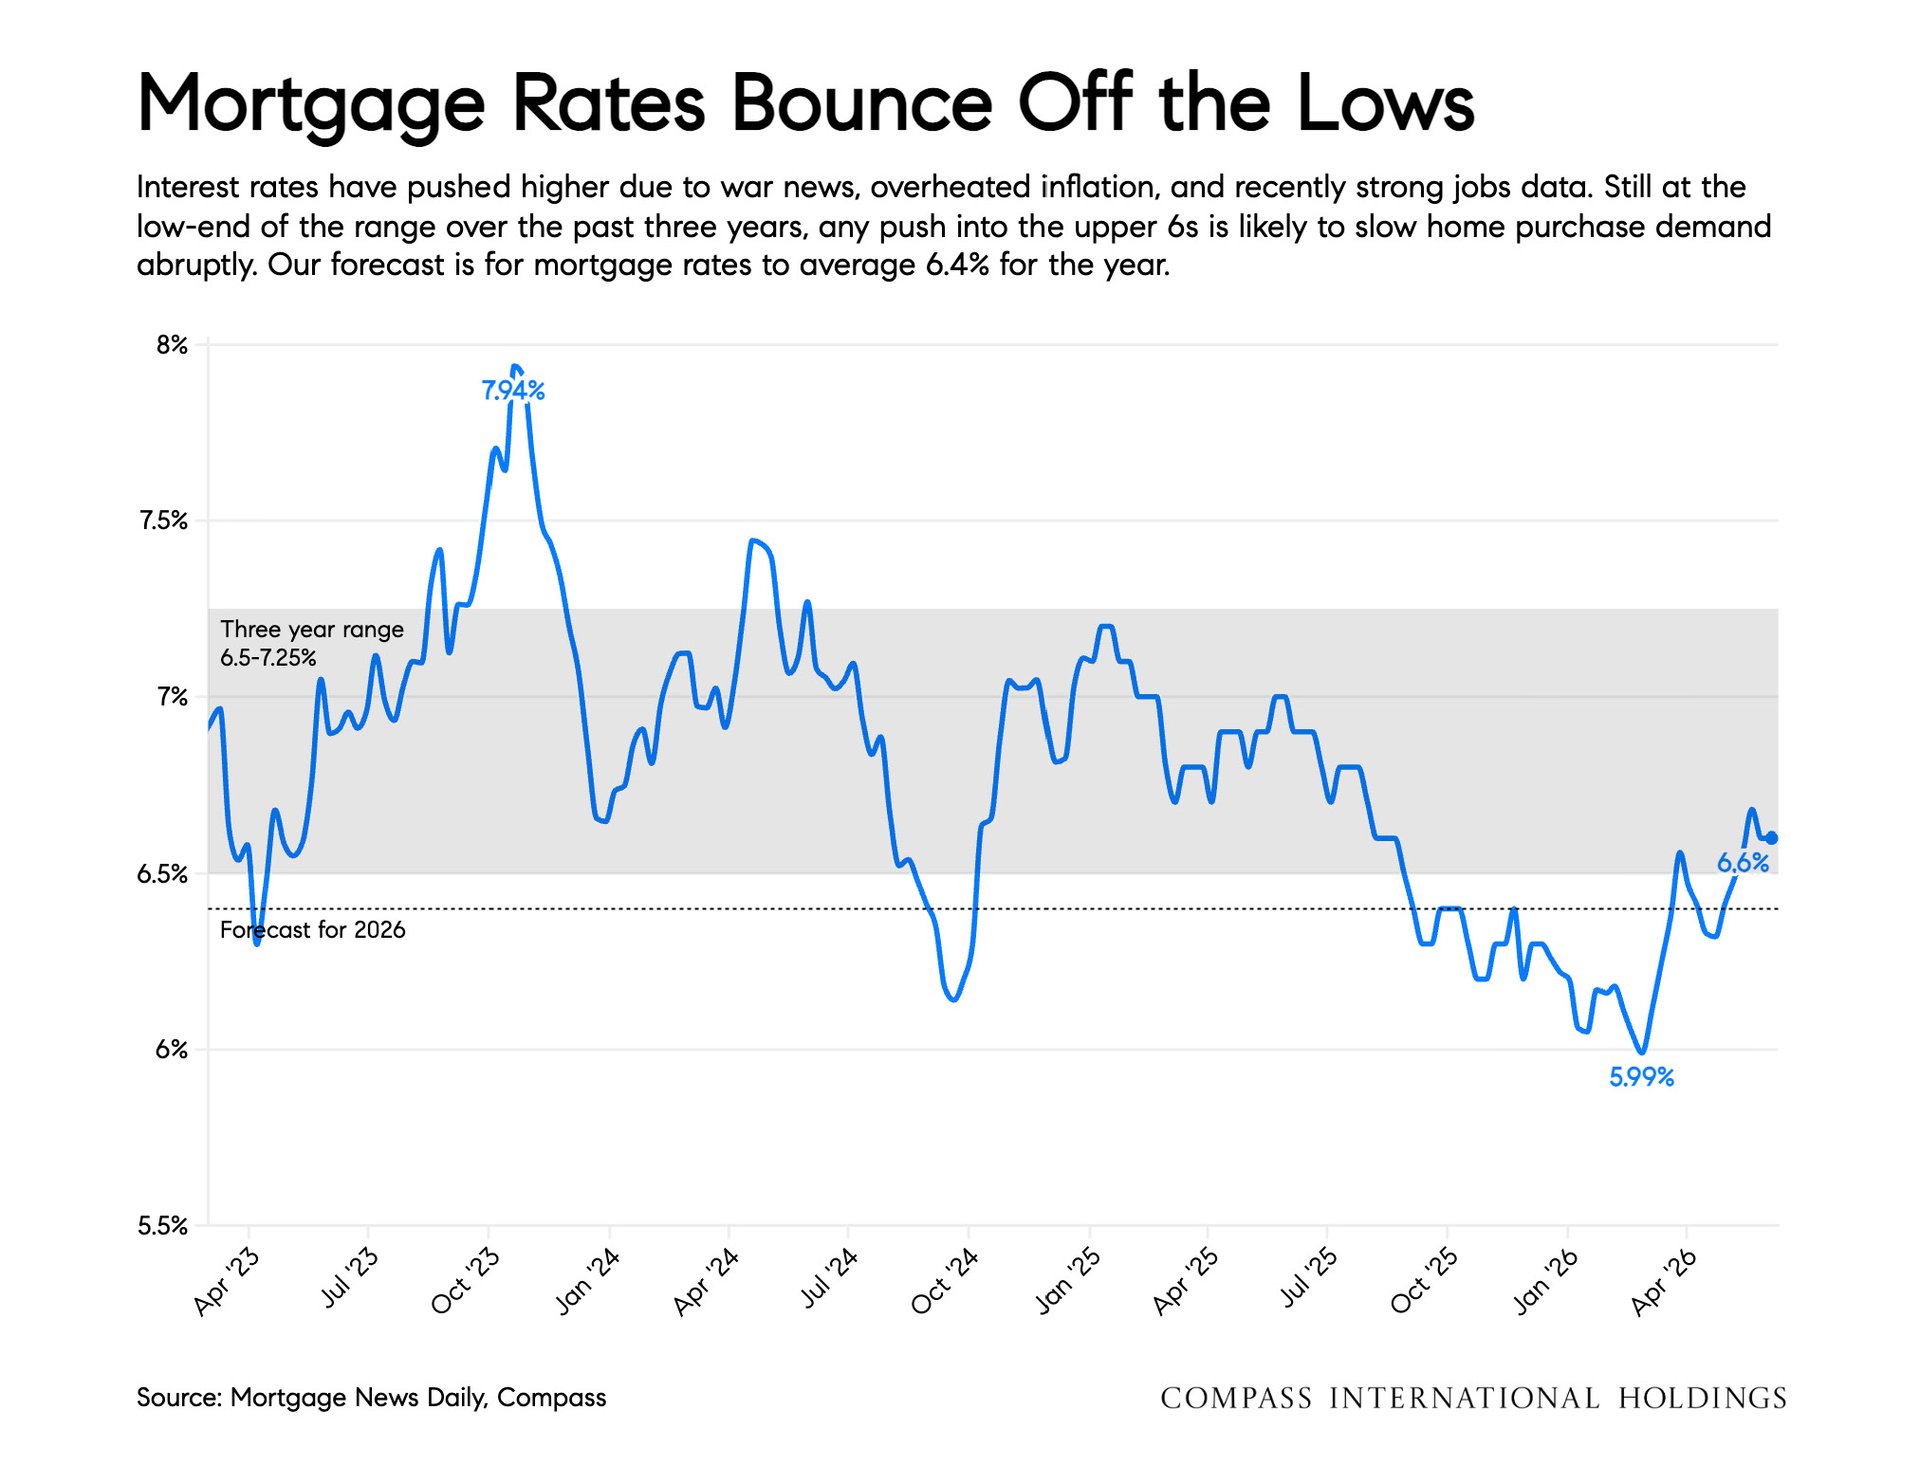
Mortgage rate chart from April 2023 to 2026, with a 6.6% latest rate and a 6.4% annual forecast.


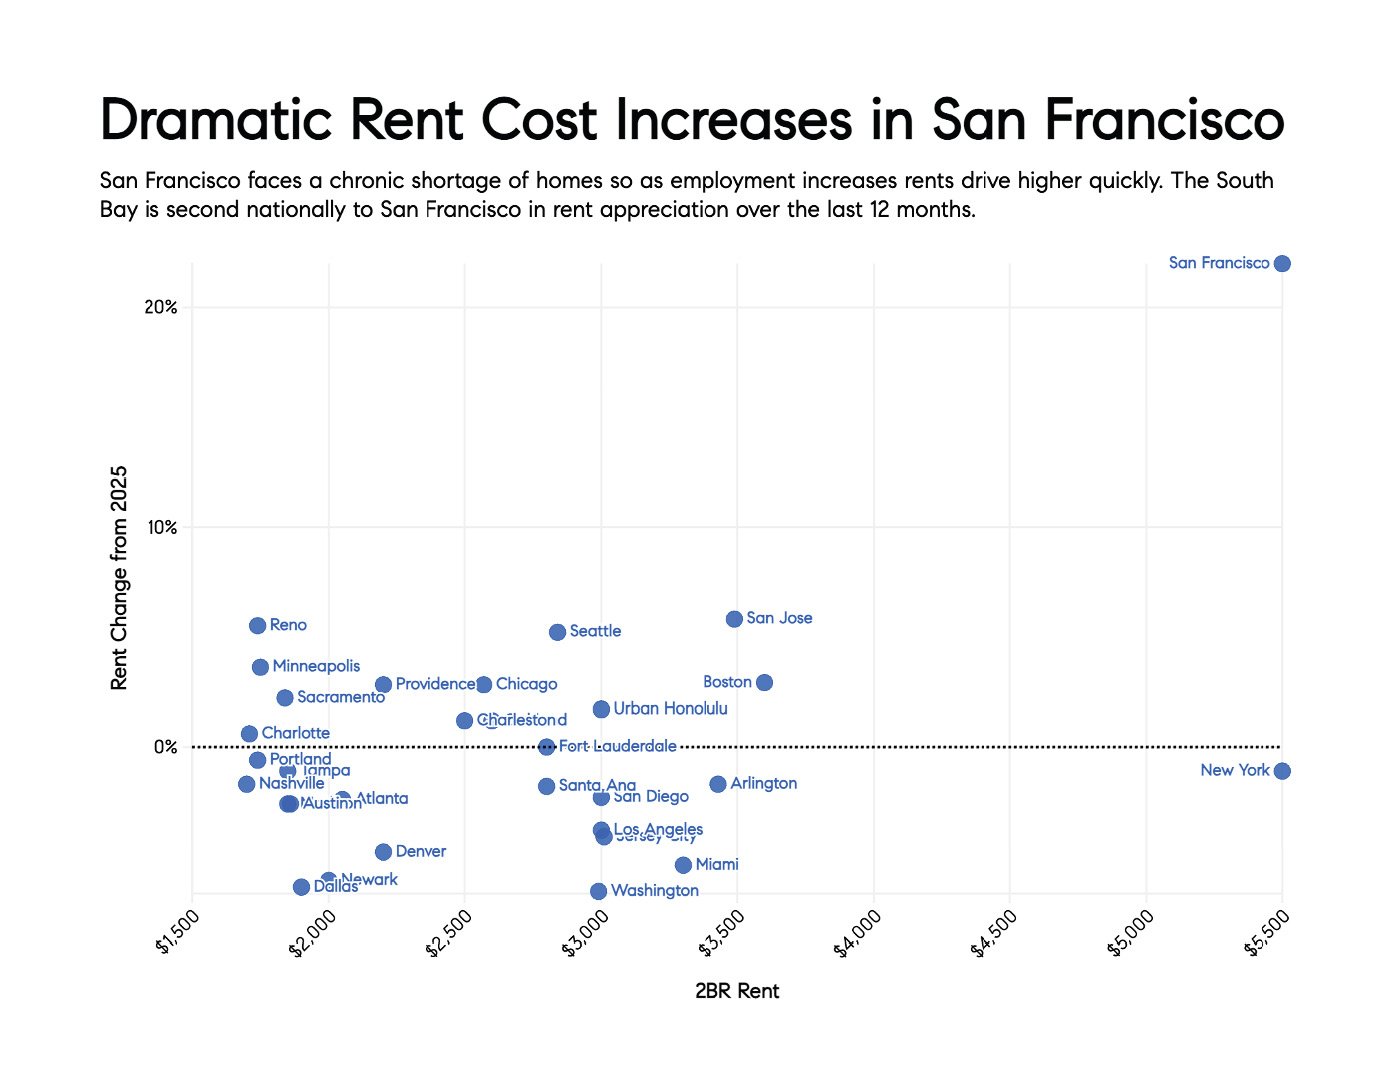
Scatter plot comparing two-bedroom rents and annual rent changes across U.S. cities, with San Francisco highest in both.


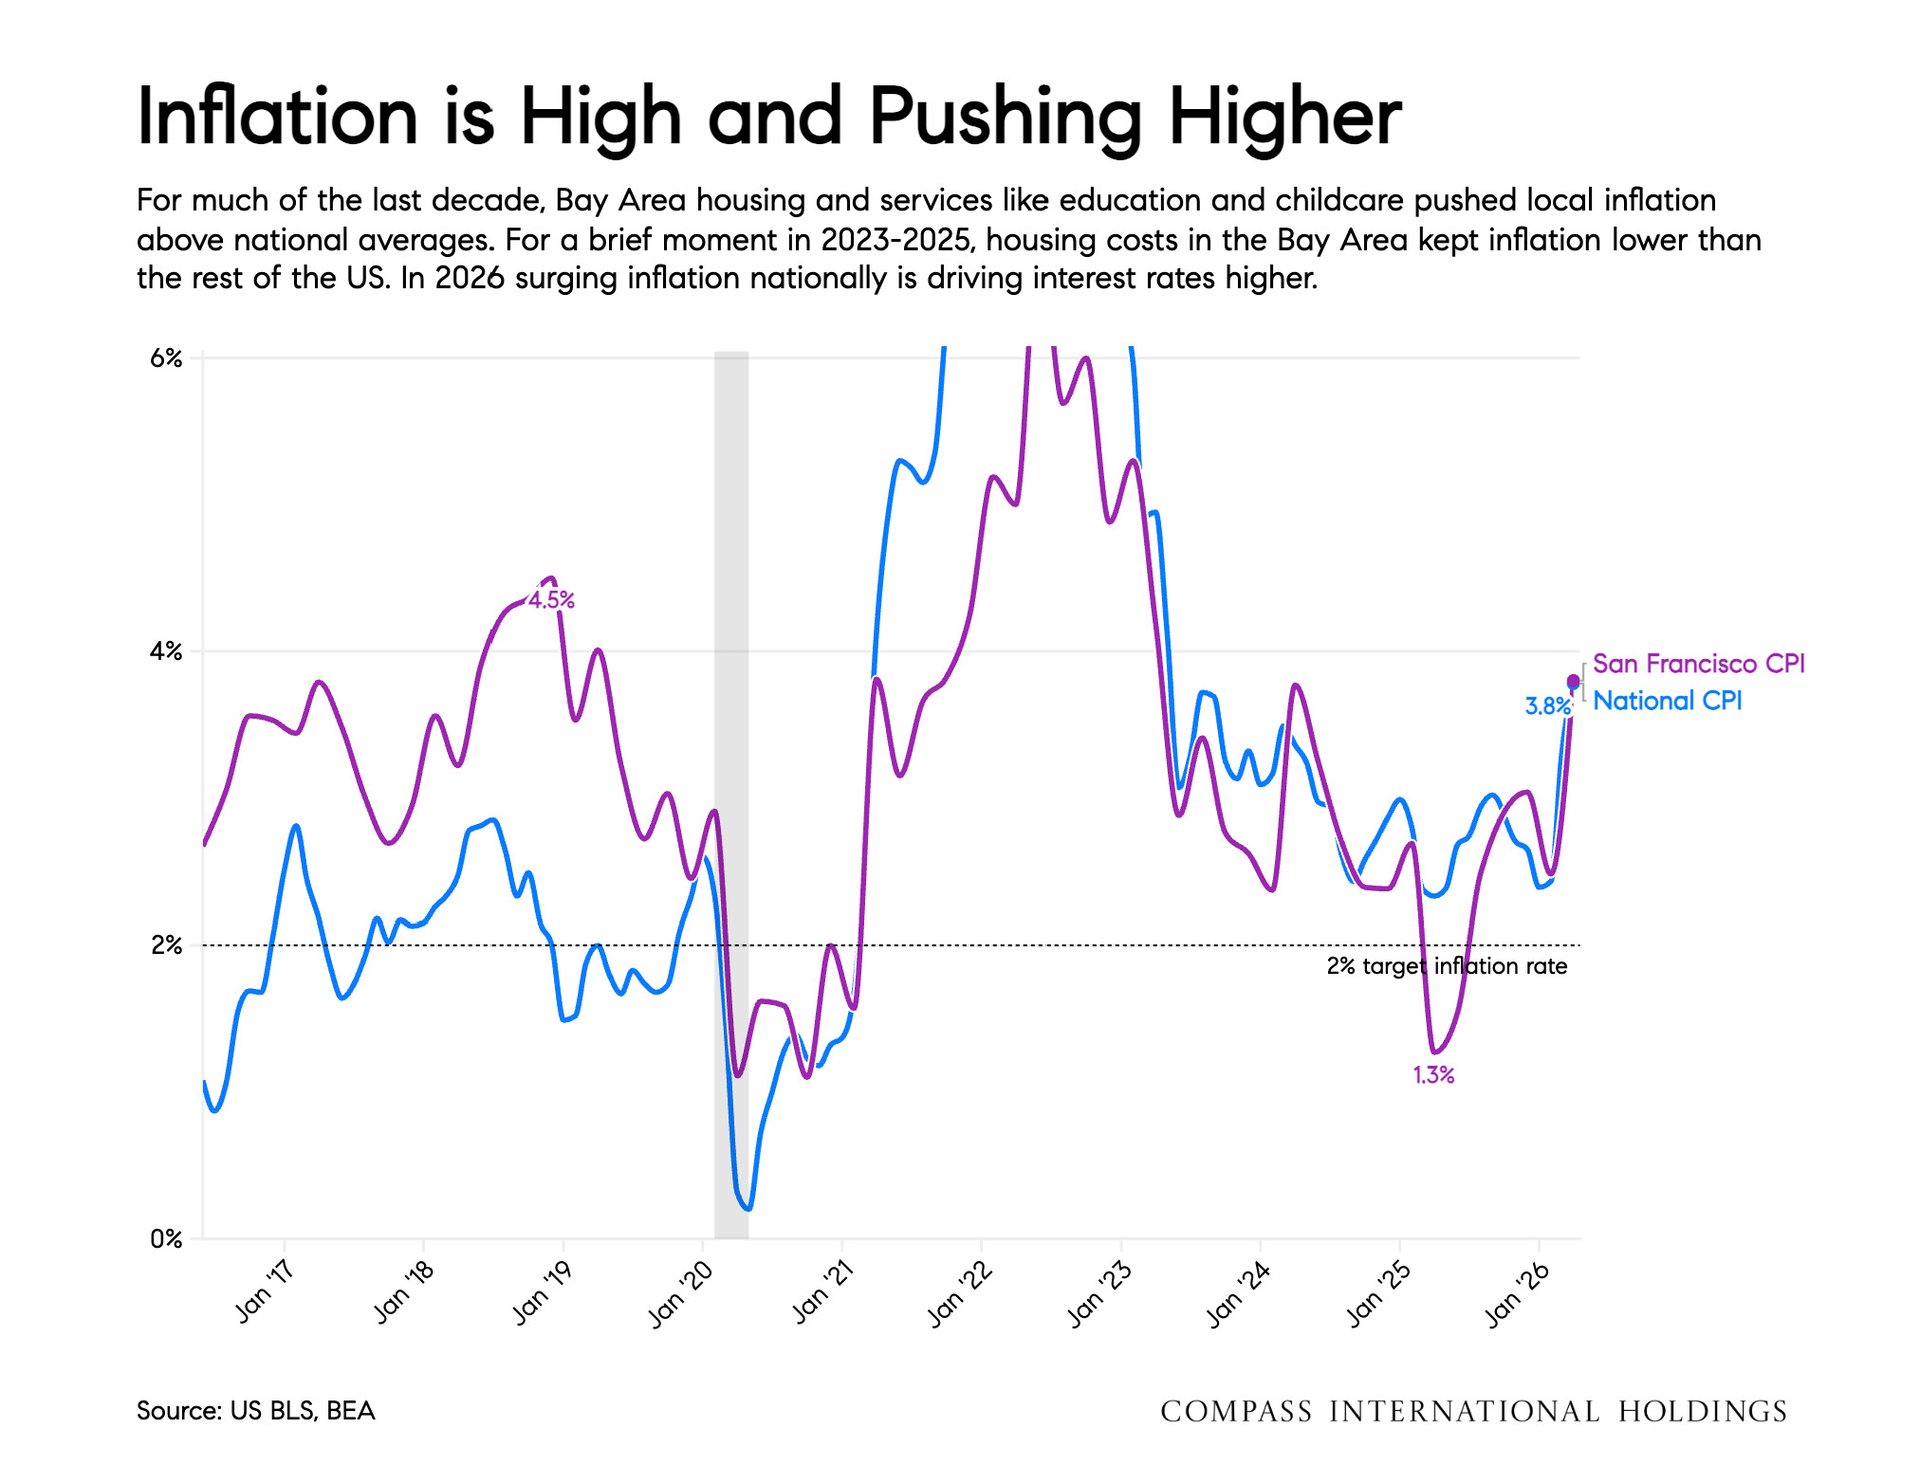
Chart comparing San Francisco and national inflation, with both CPI rates at 3.8% in 2026.


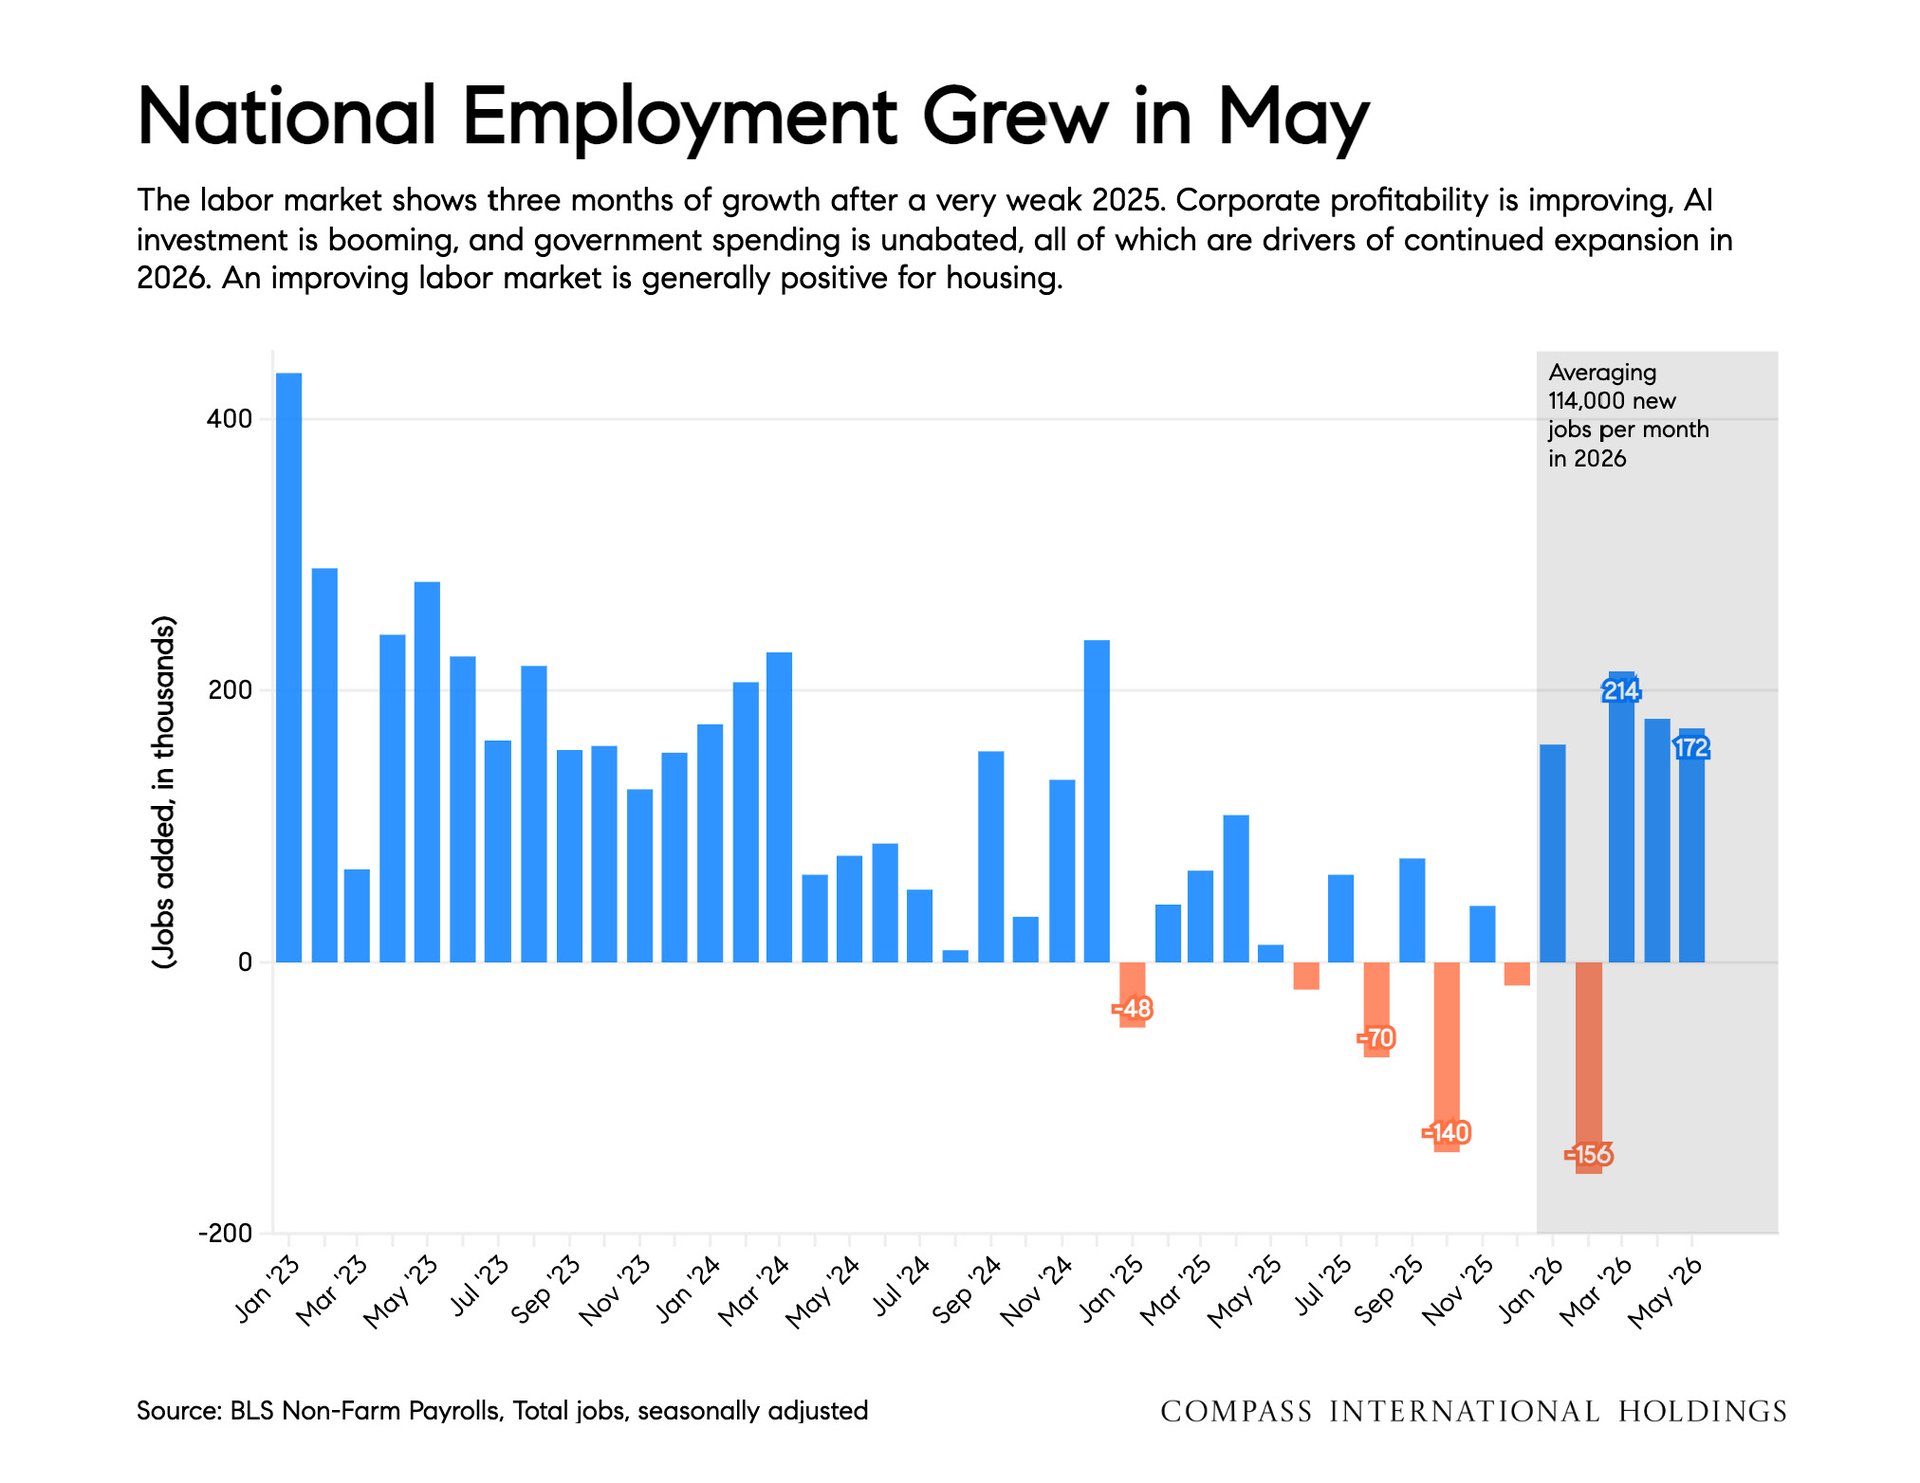
Bar chart of monthly U.S. job changes through May 2026, highlighting 214,000 jobs in March and 172,000 in May.


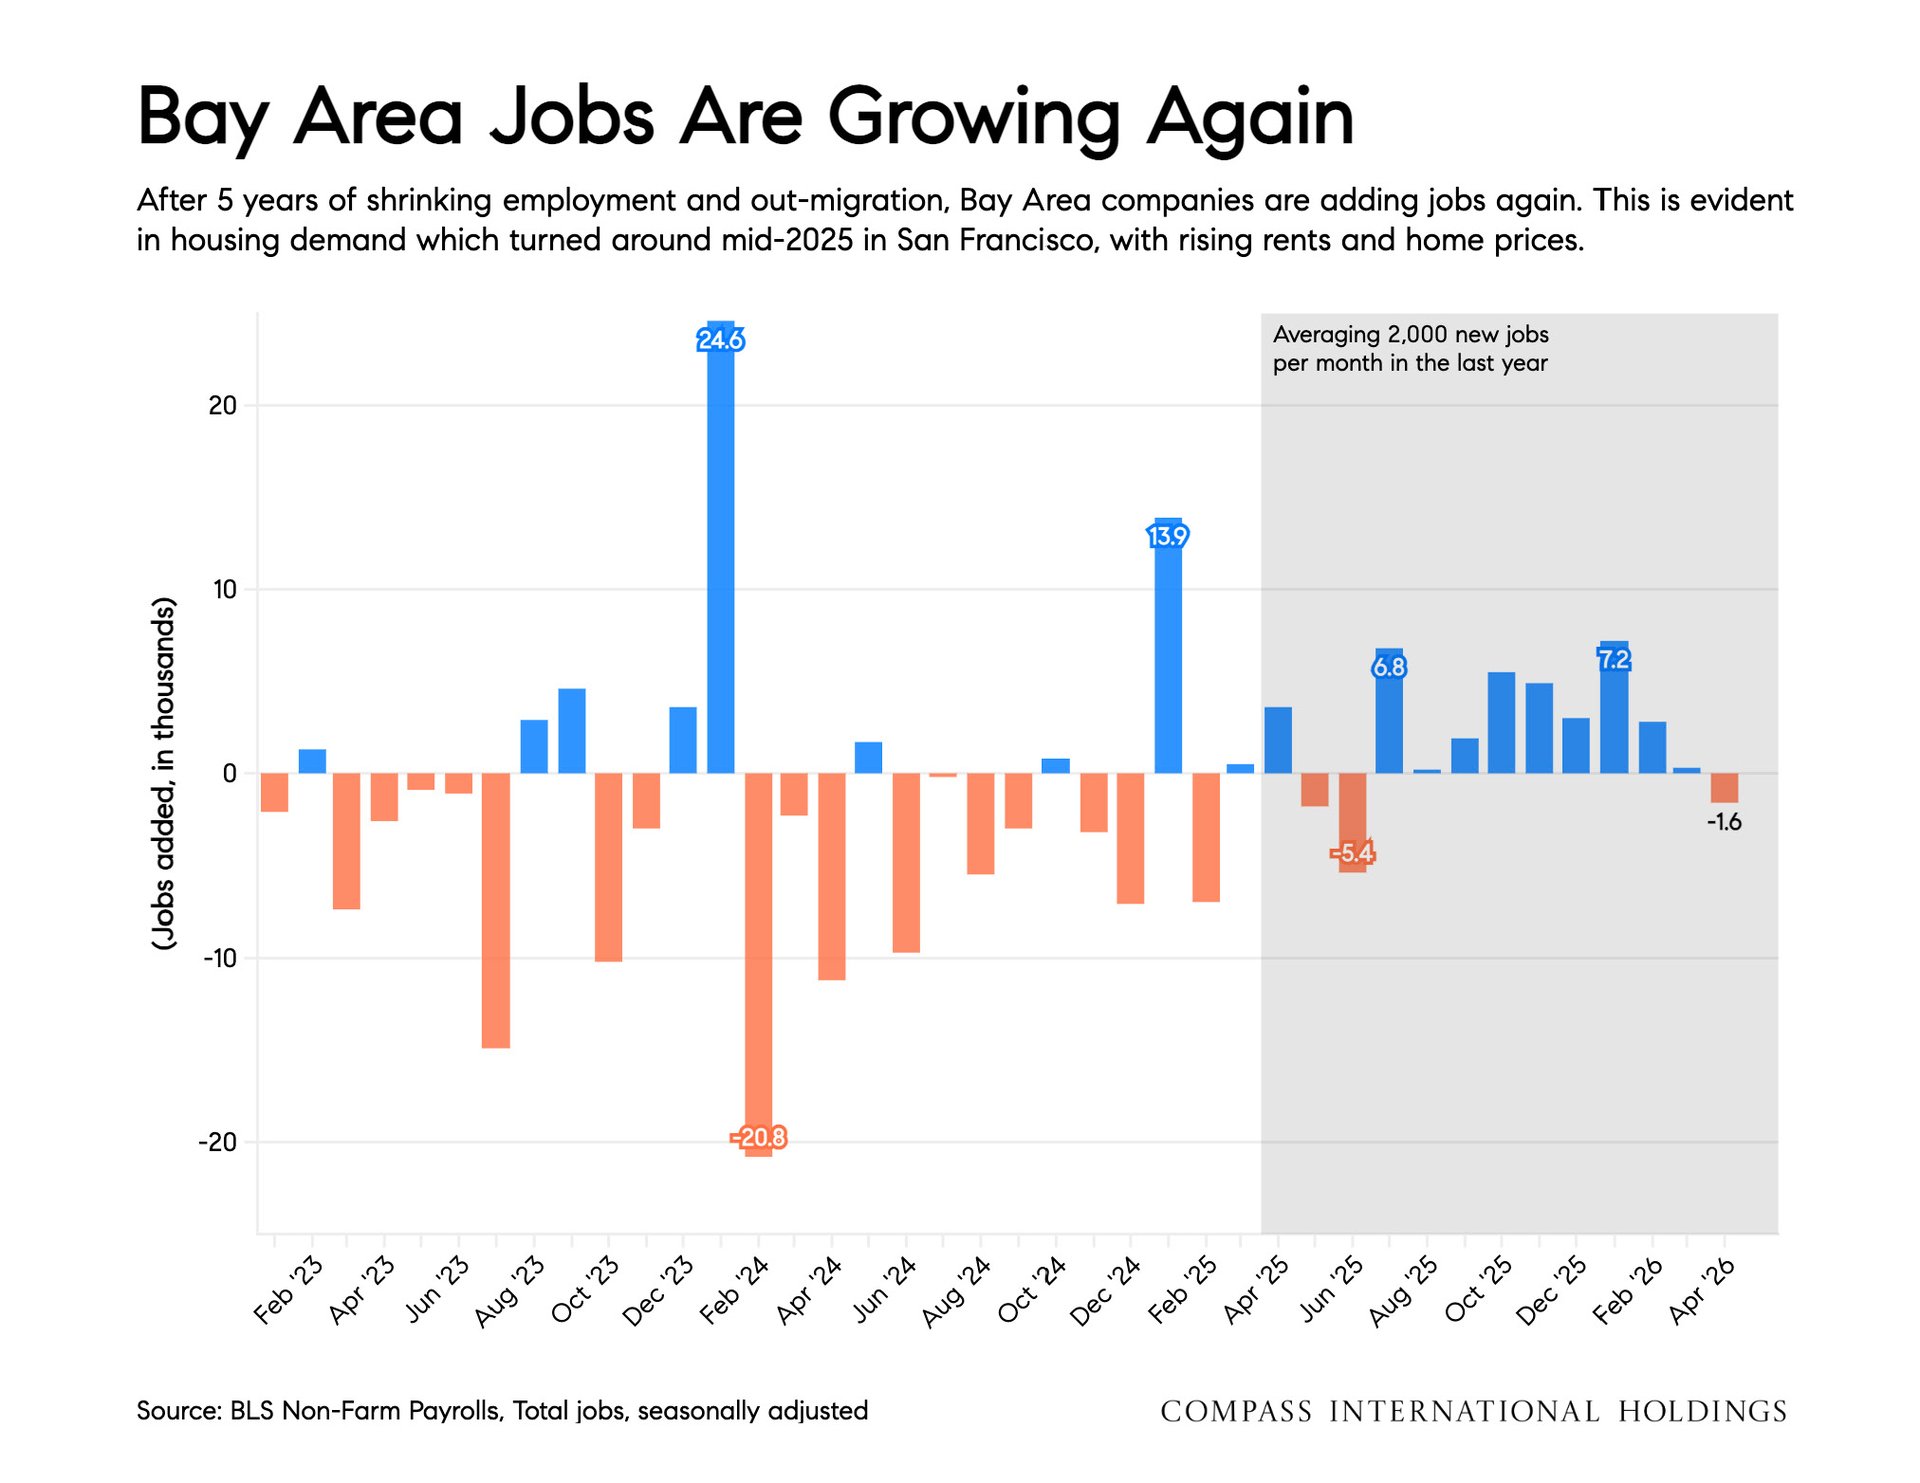
Chart of Bay Area monthly job gains and losses from February 2023 to April 2026, with recent job growth highlighted.


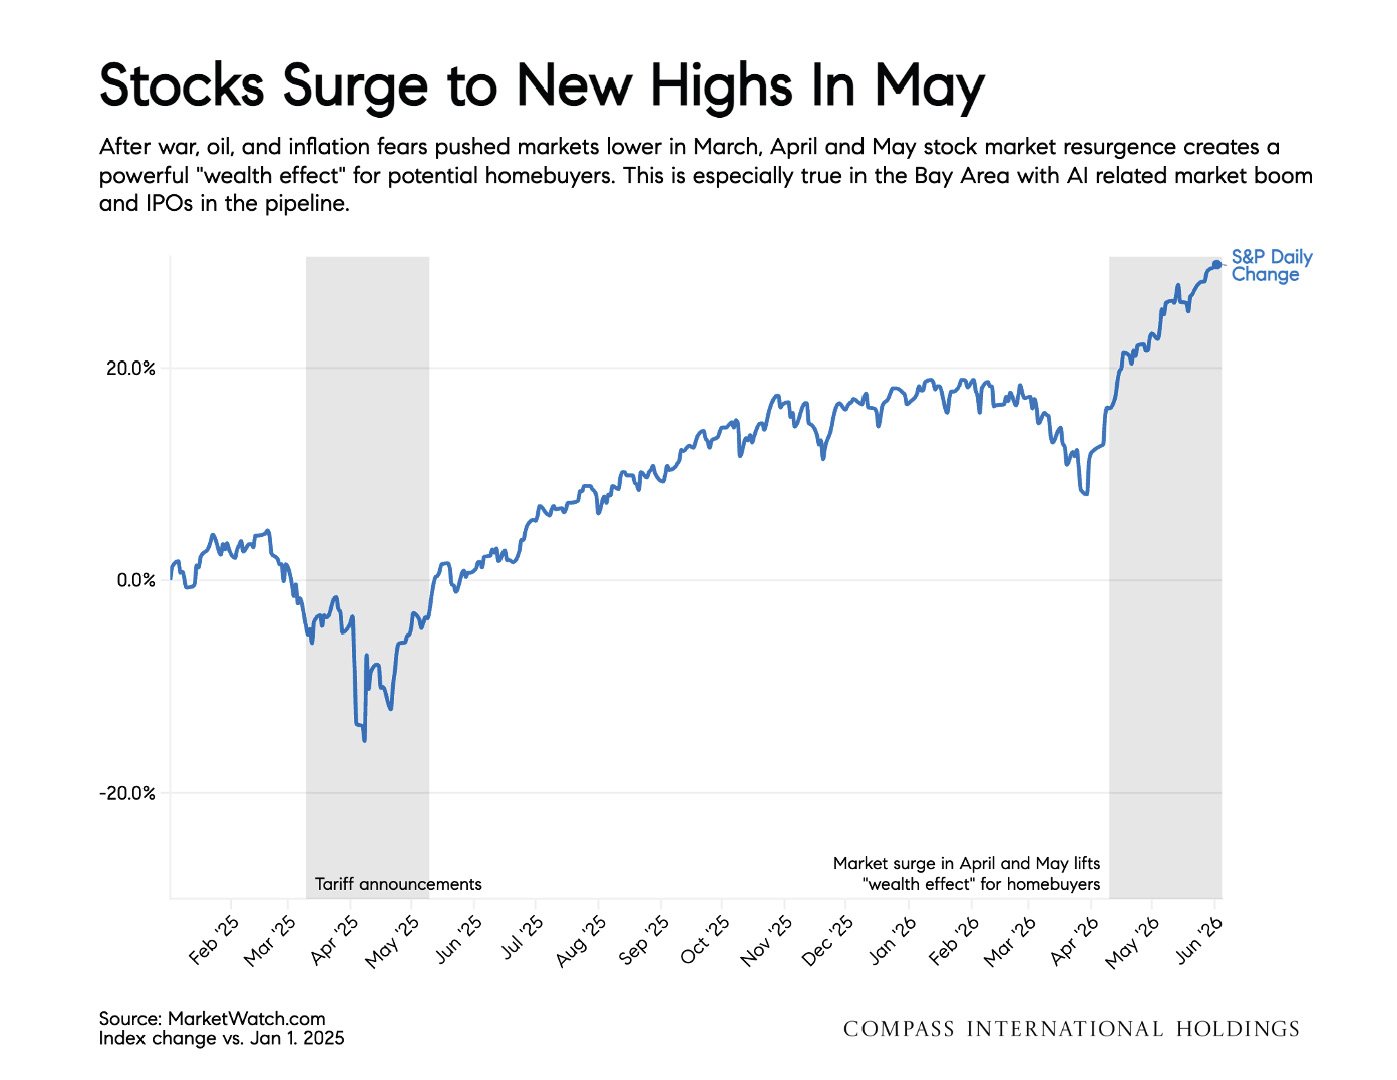
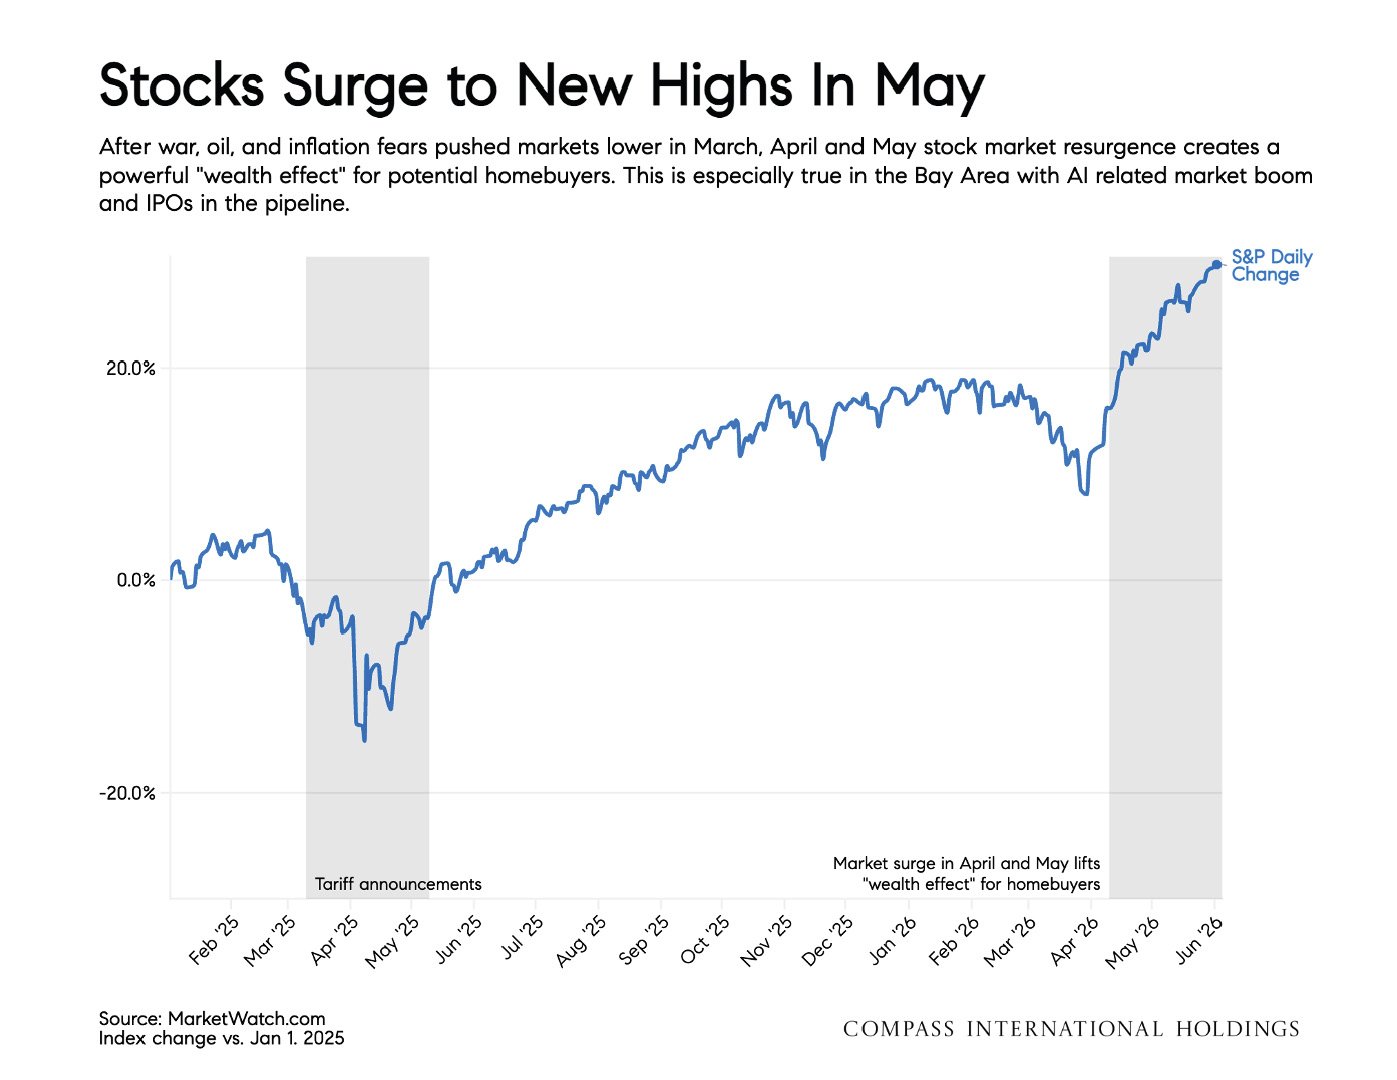
Chart shows the S&P rising to new highs in May 2026 after a sharp drop in spring 2025.


Chart of S&P daily change from February 2025 to June 2026, rising sharply to new highs in May.


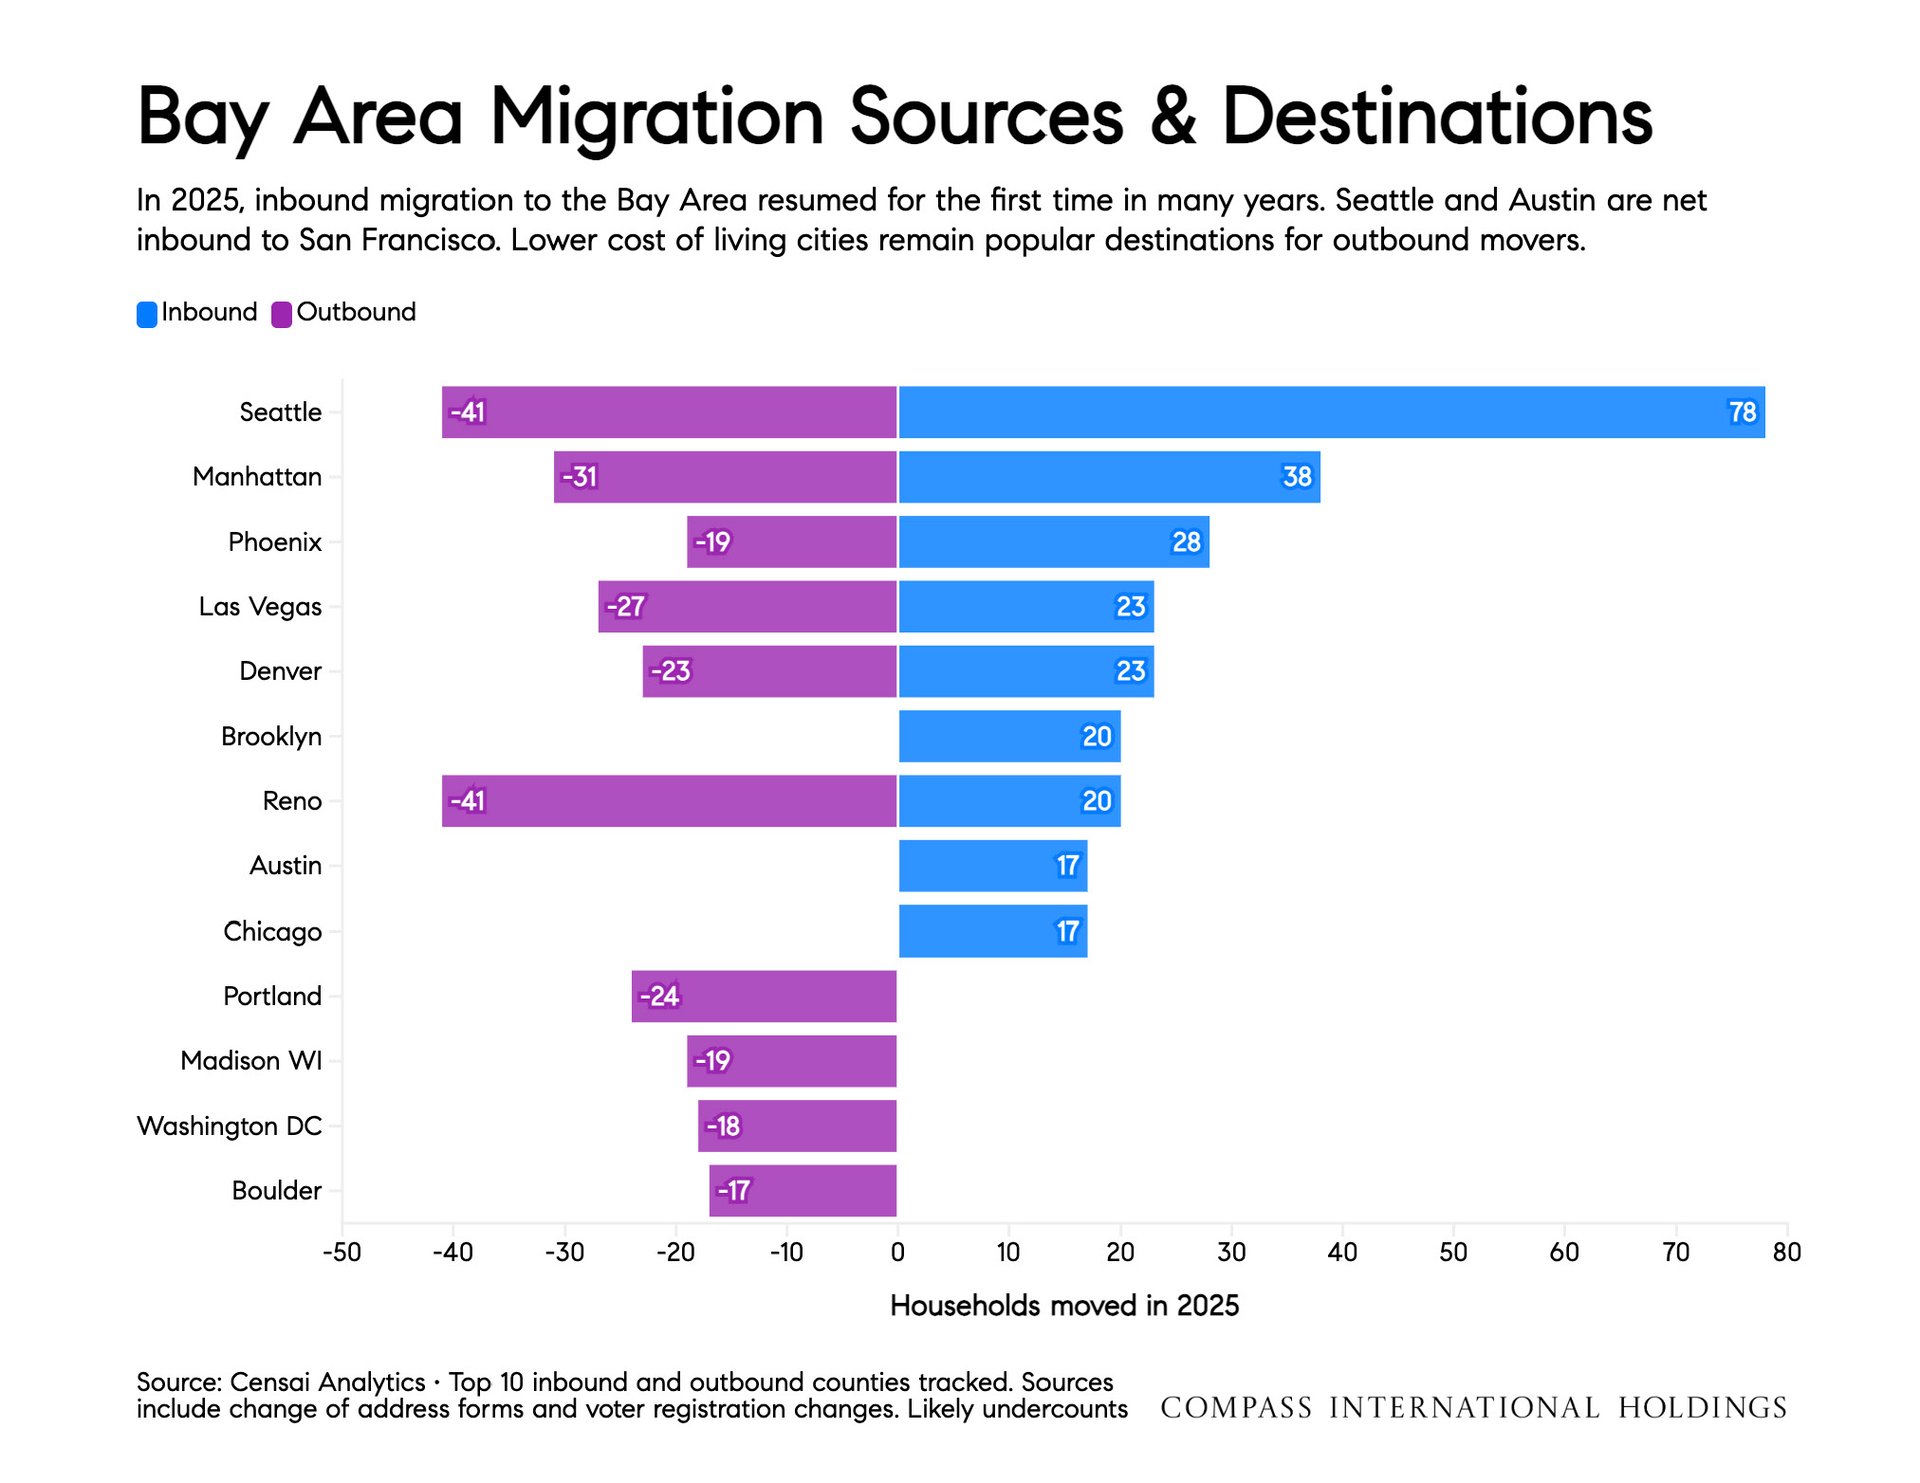
Chart of 2025 Bay Area migration sources and destinations, with inbound and outbound household moves by city.


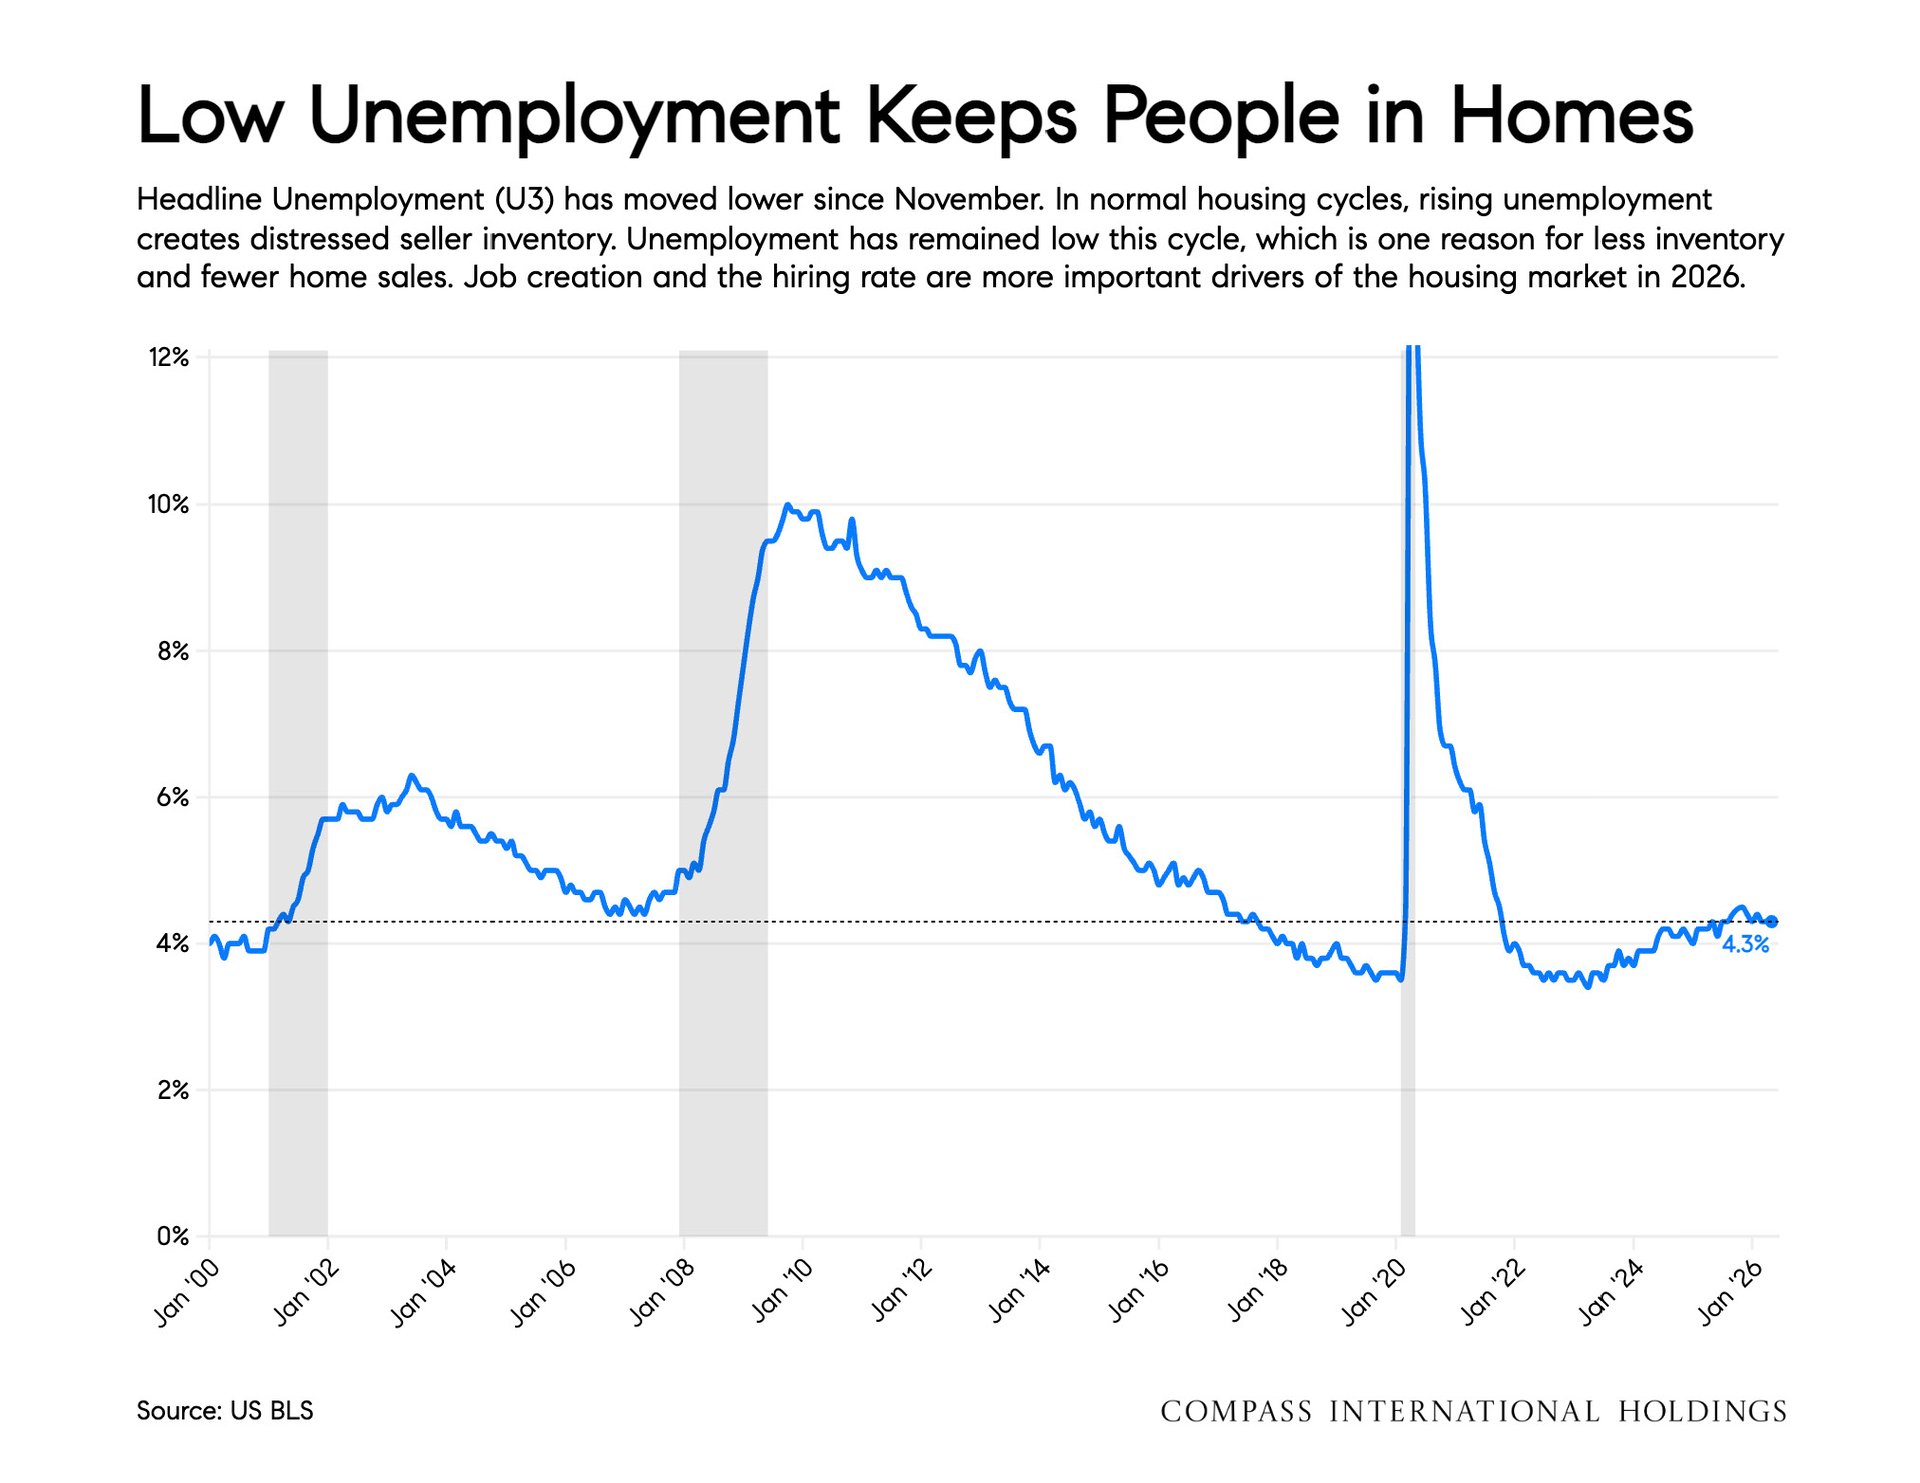
Chart of U.S. unemployment from 2000 to 2026, ending at 4.3% after a sharp 2020 spike.


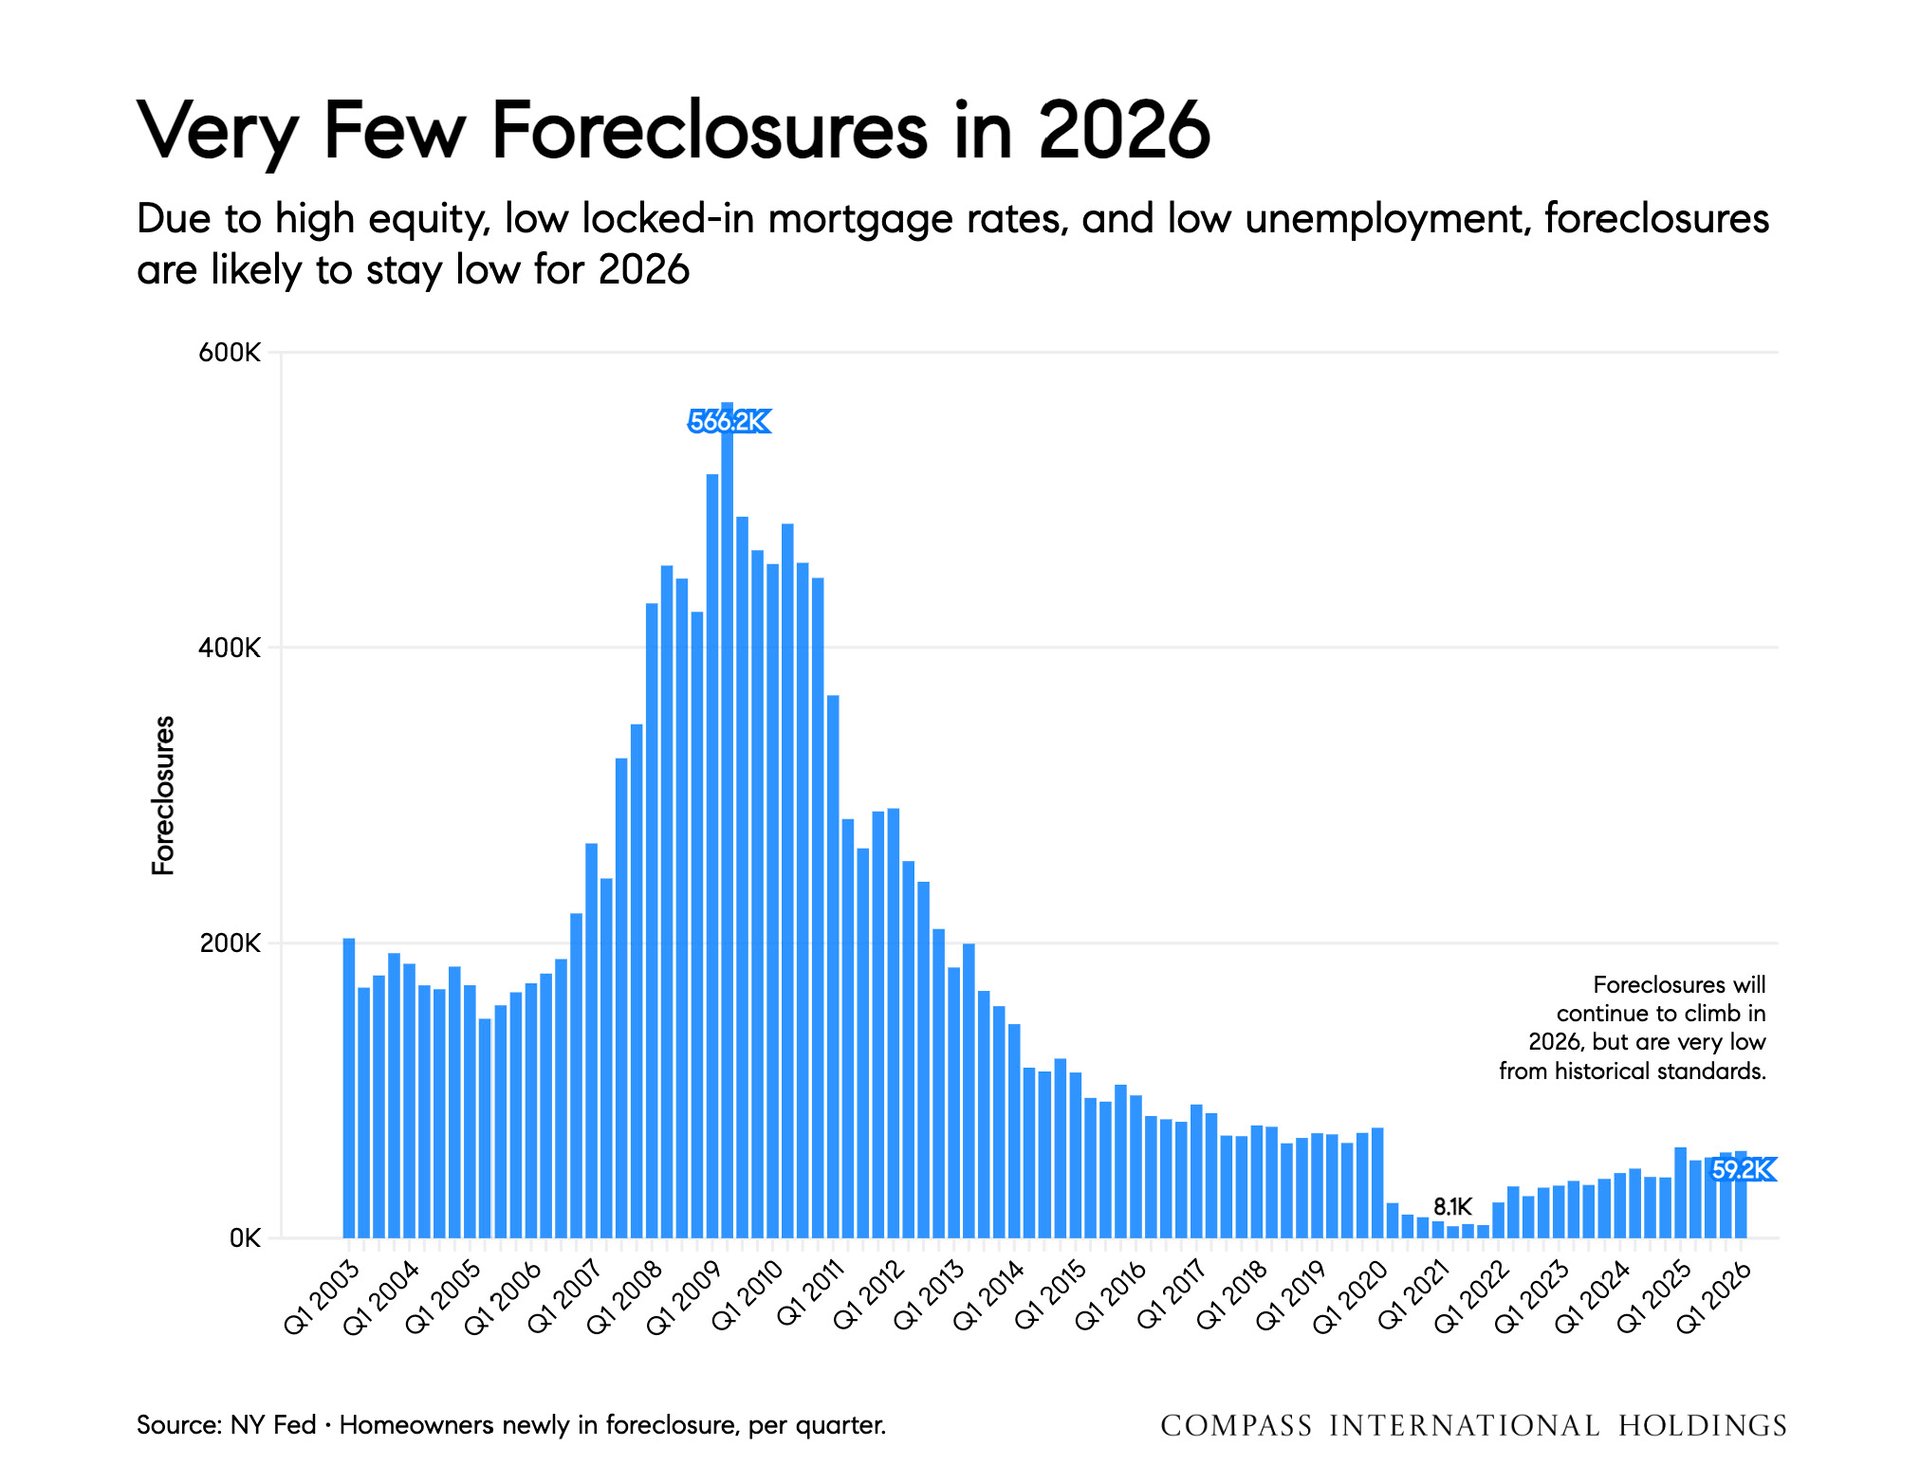
Bar chart of quarterly foreclosures, peaking in 2009 and remaining low at 59.2K in 2026.


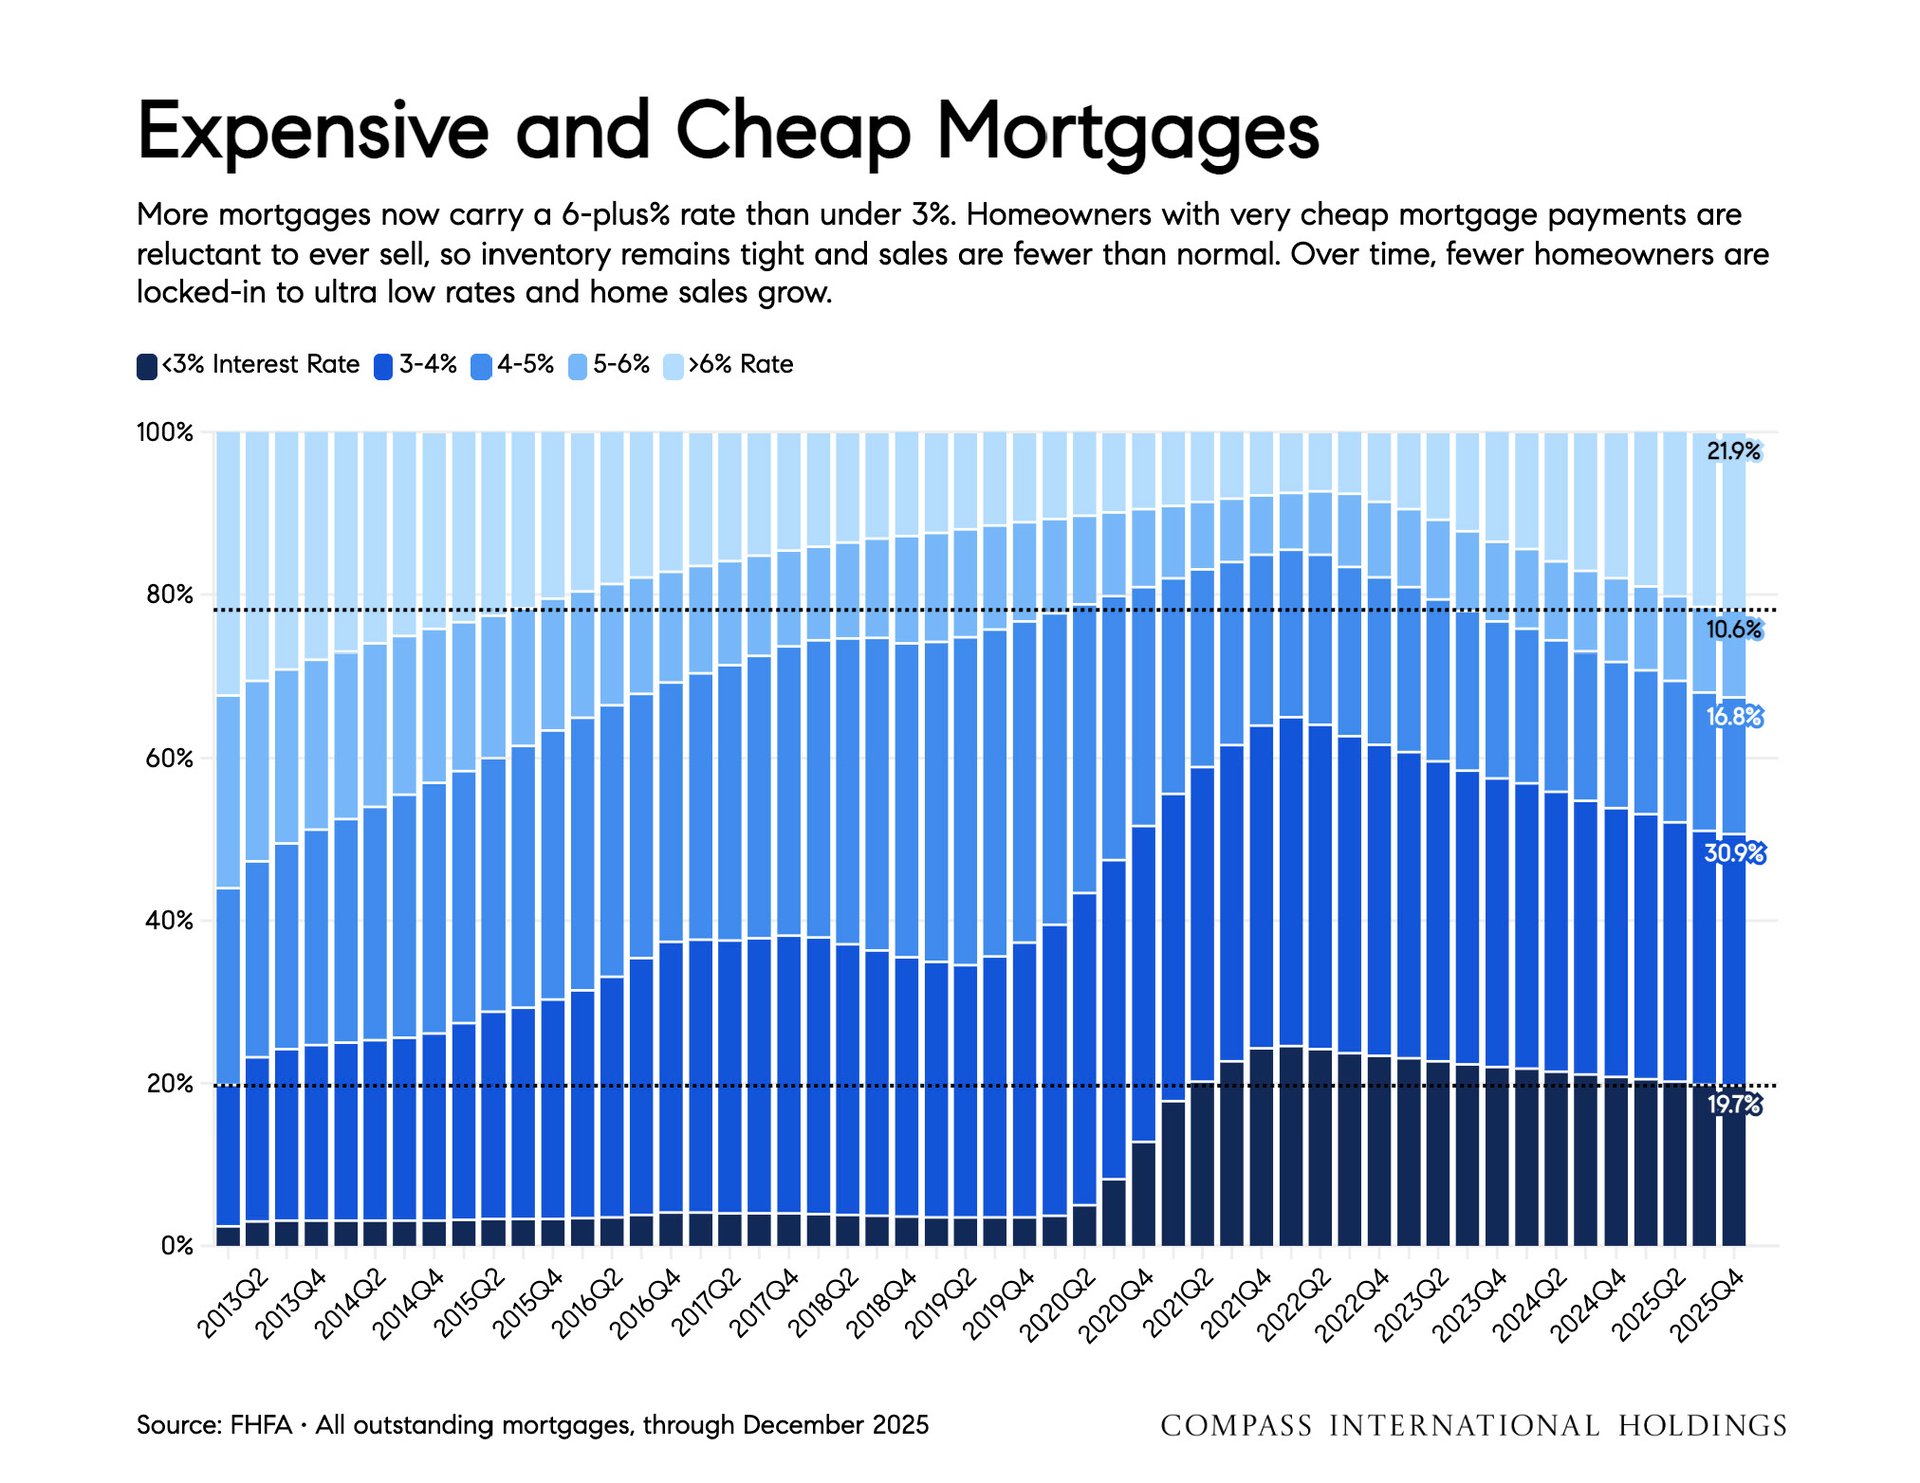
Stacked chart of mortgage rates from 2013 to 2025, with 21.9% of mortgages above 6% at the end.


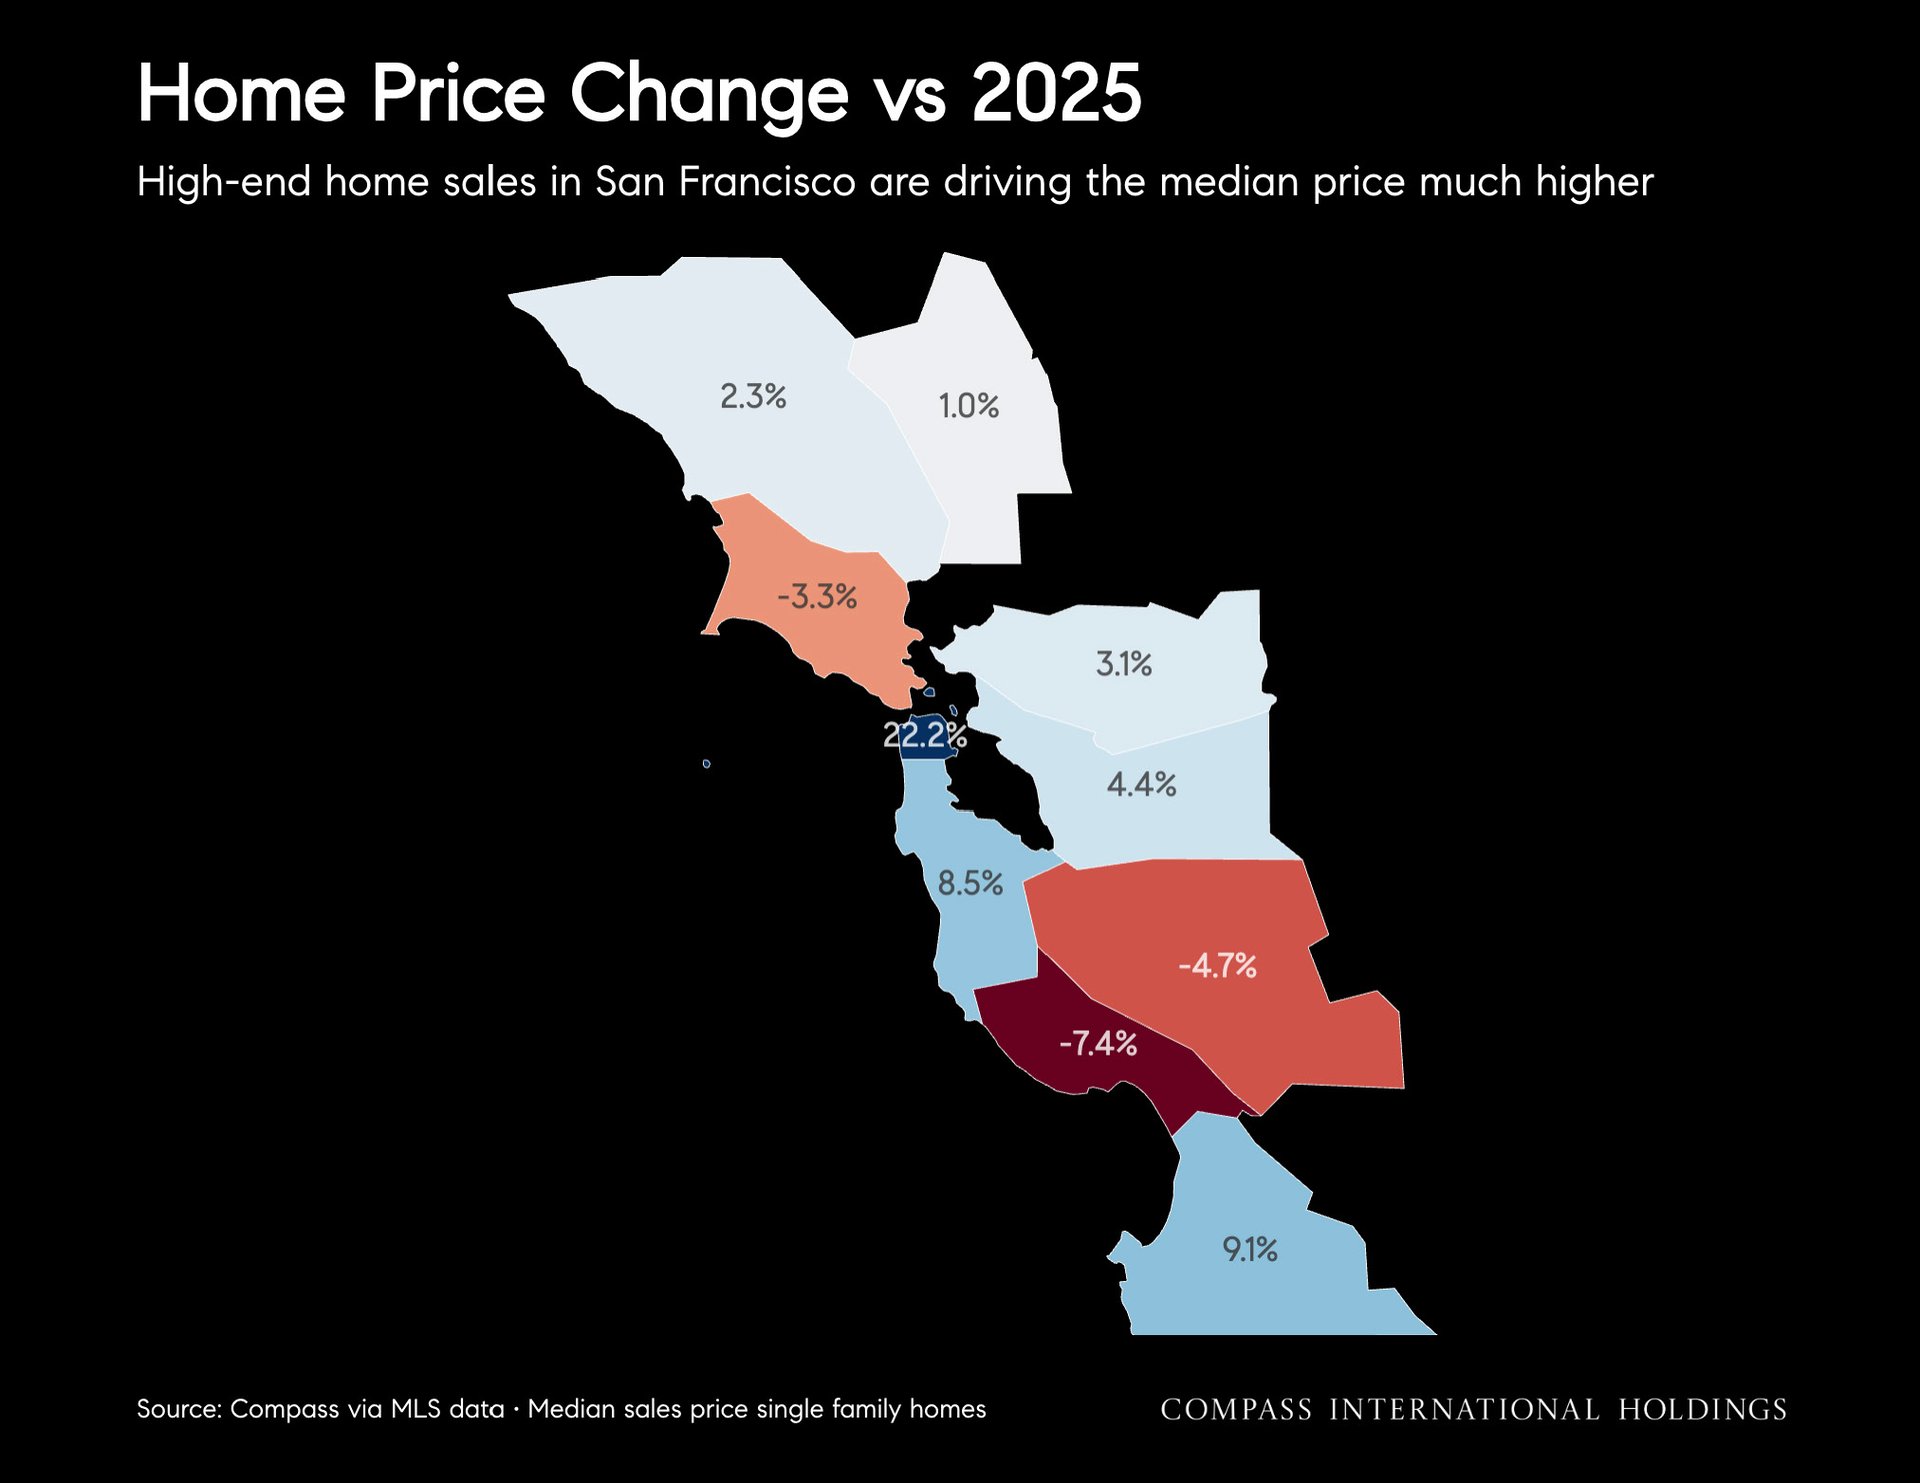
San Francisco map showing neighborhood home price changes versus 2025, ranging from 9.1% increases to a 7.4% decline.


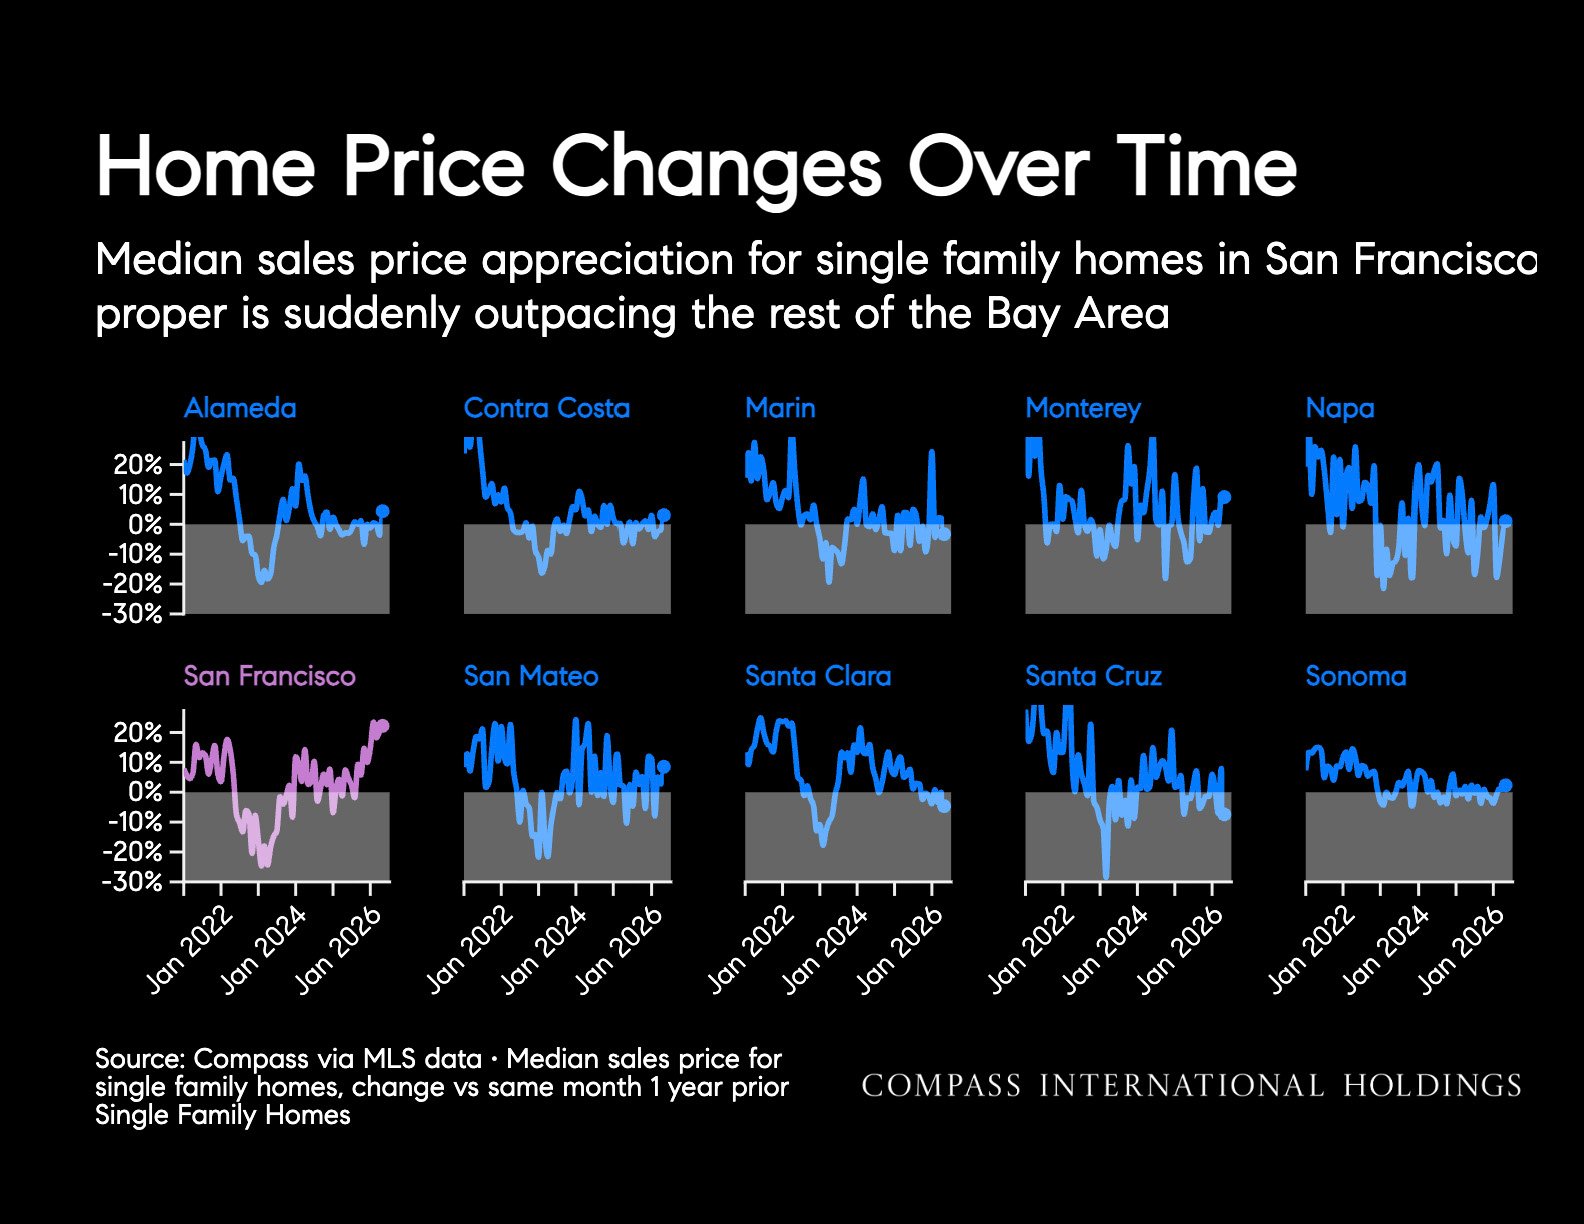
Infographic comparing single-family home price changes across ten Bay Area counties; San Francisco’s recent trend rises above the others.


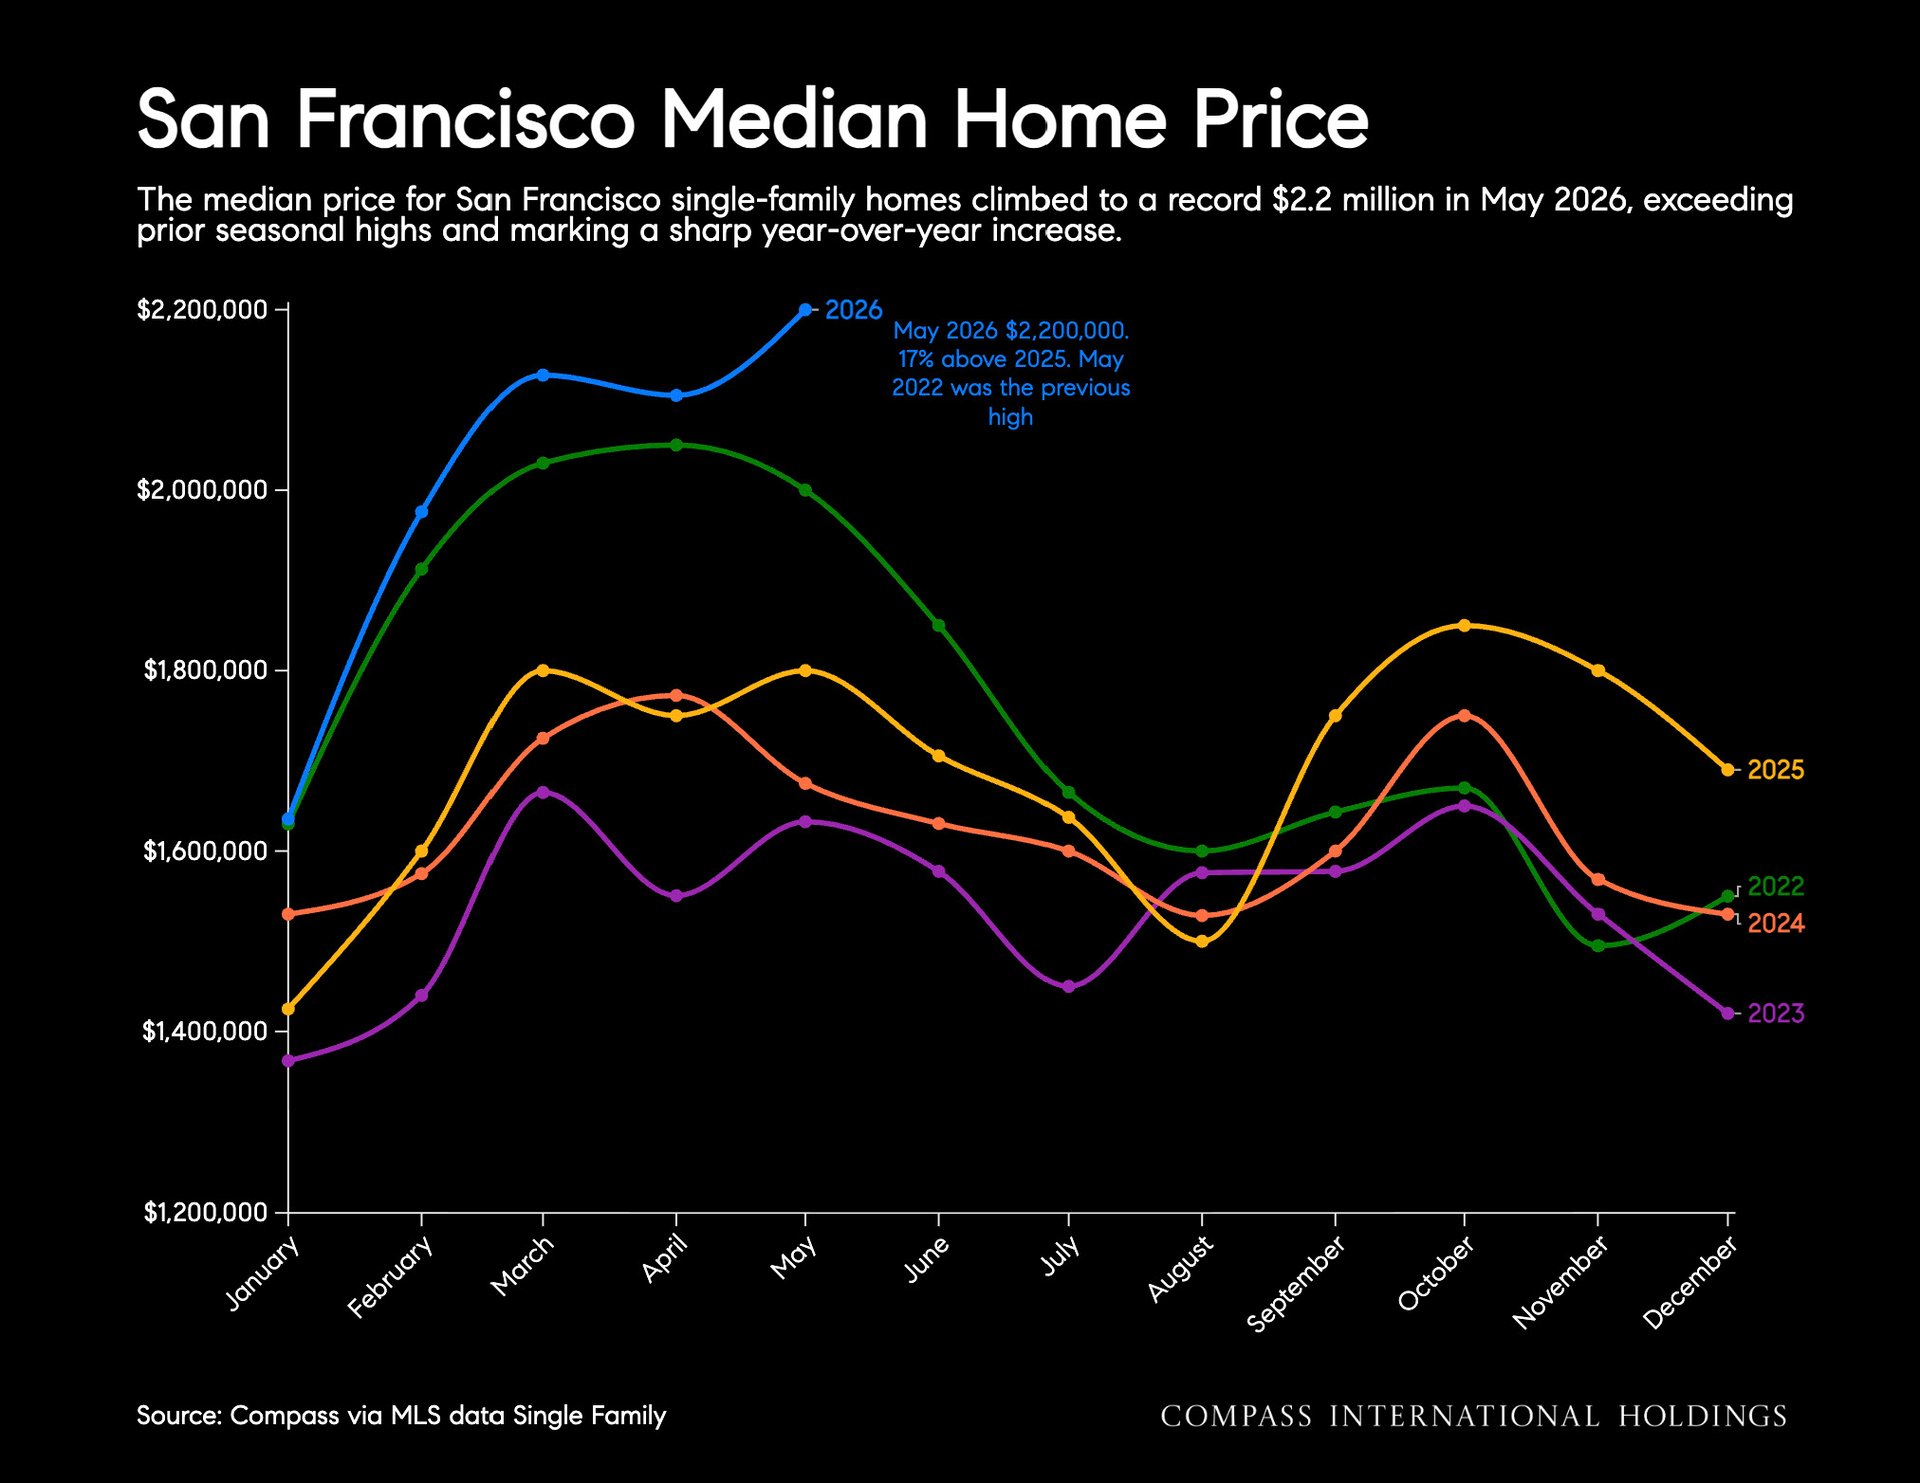
Chart of San Francisco median home prices by month from 2022 to 2026, with May 2026 at $2.2 million.


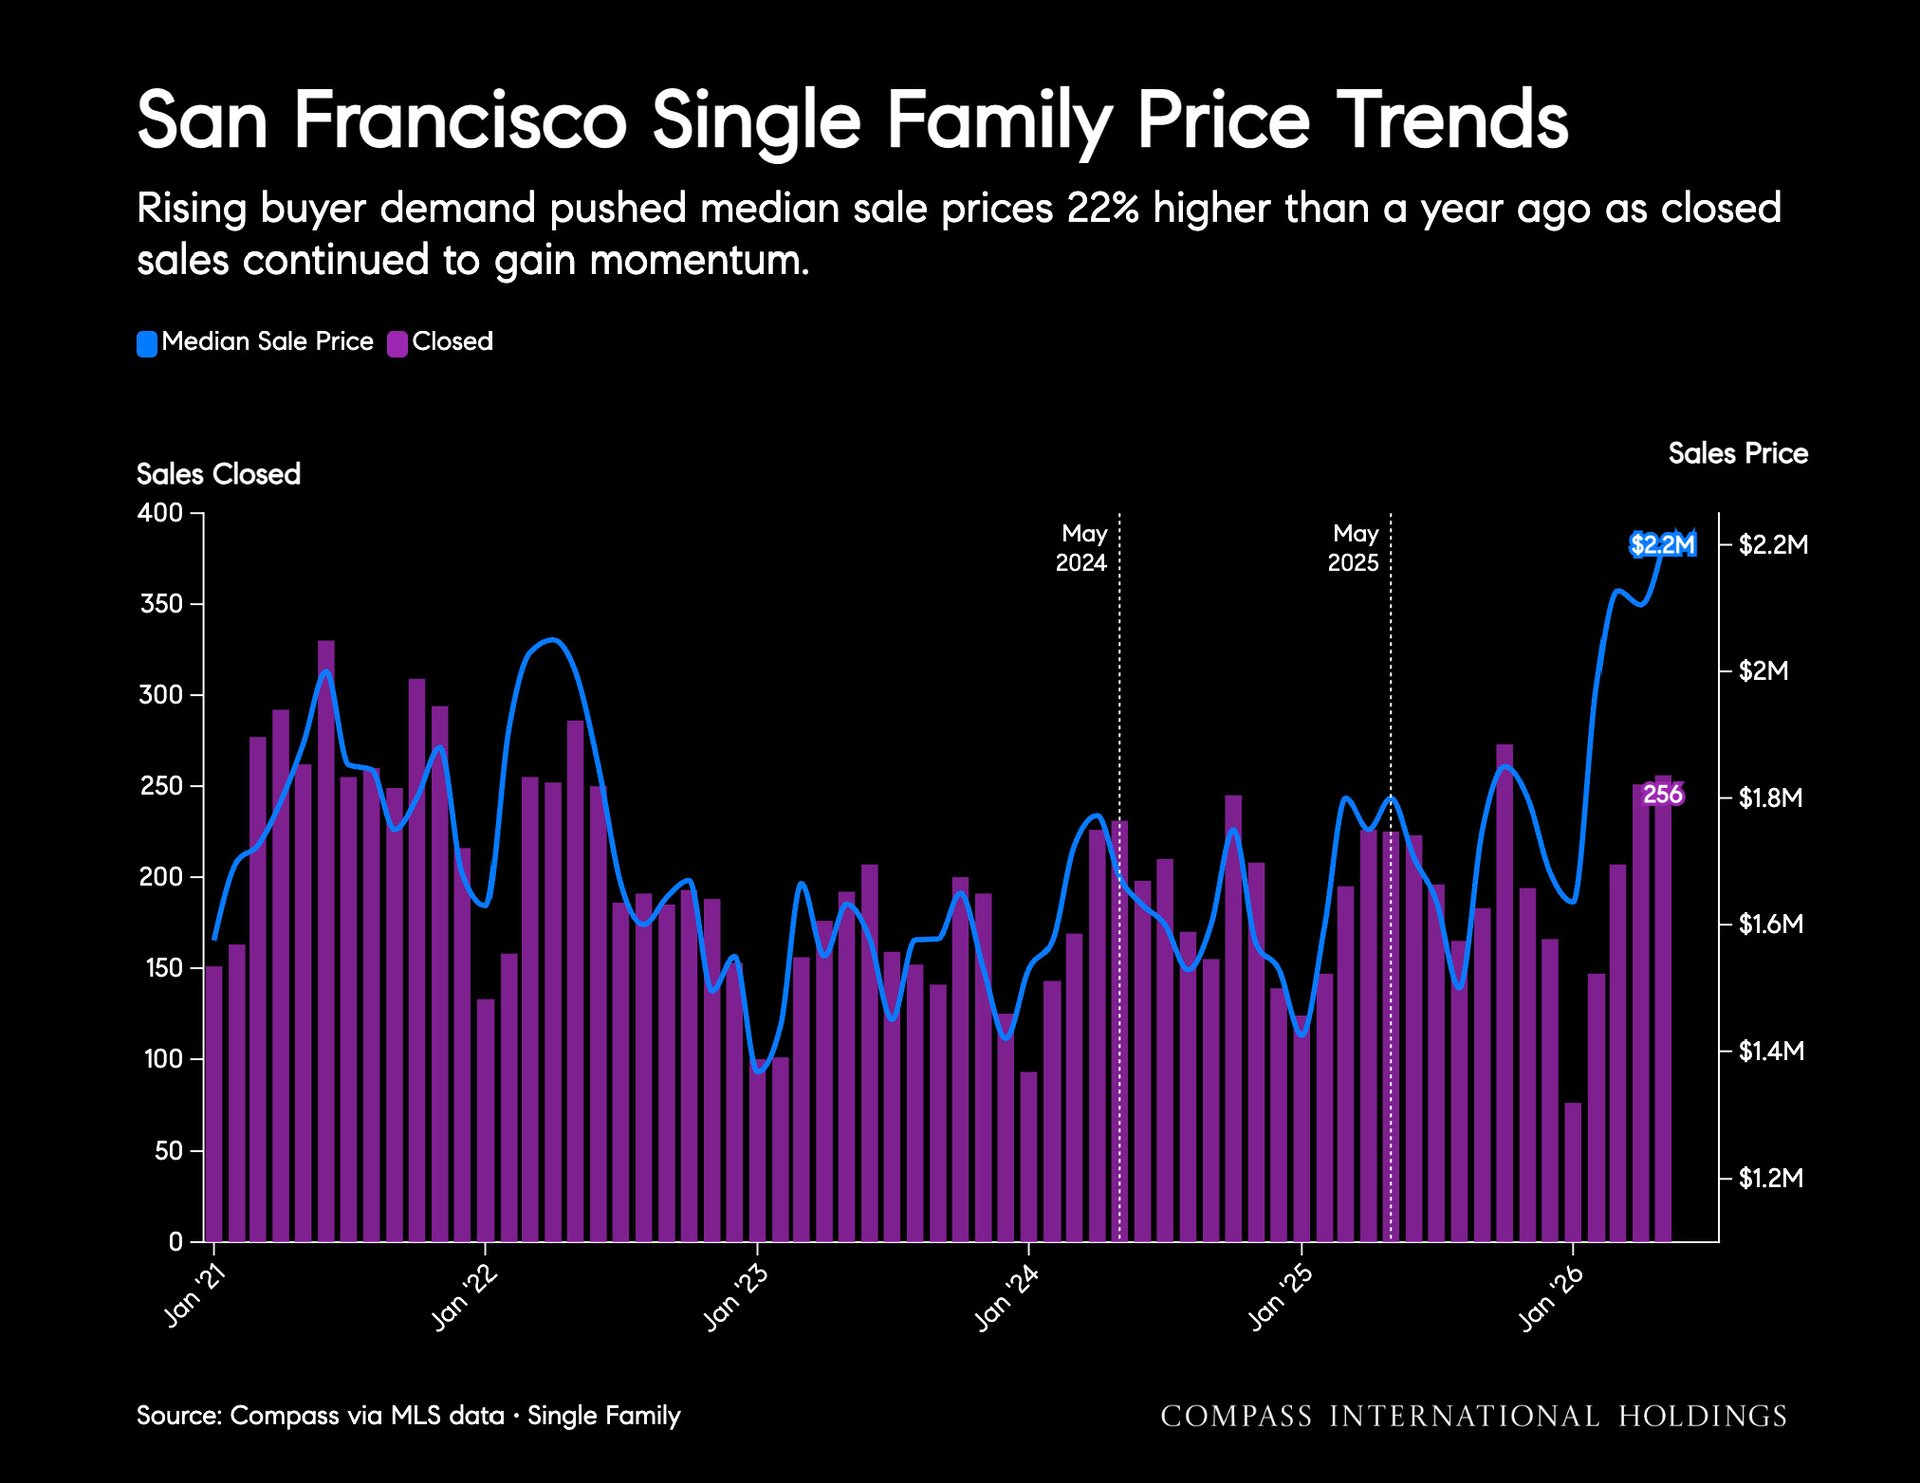
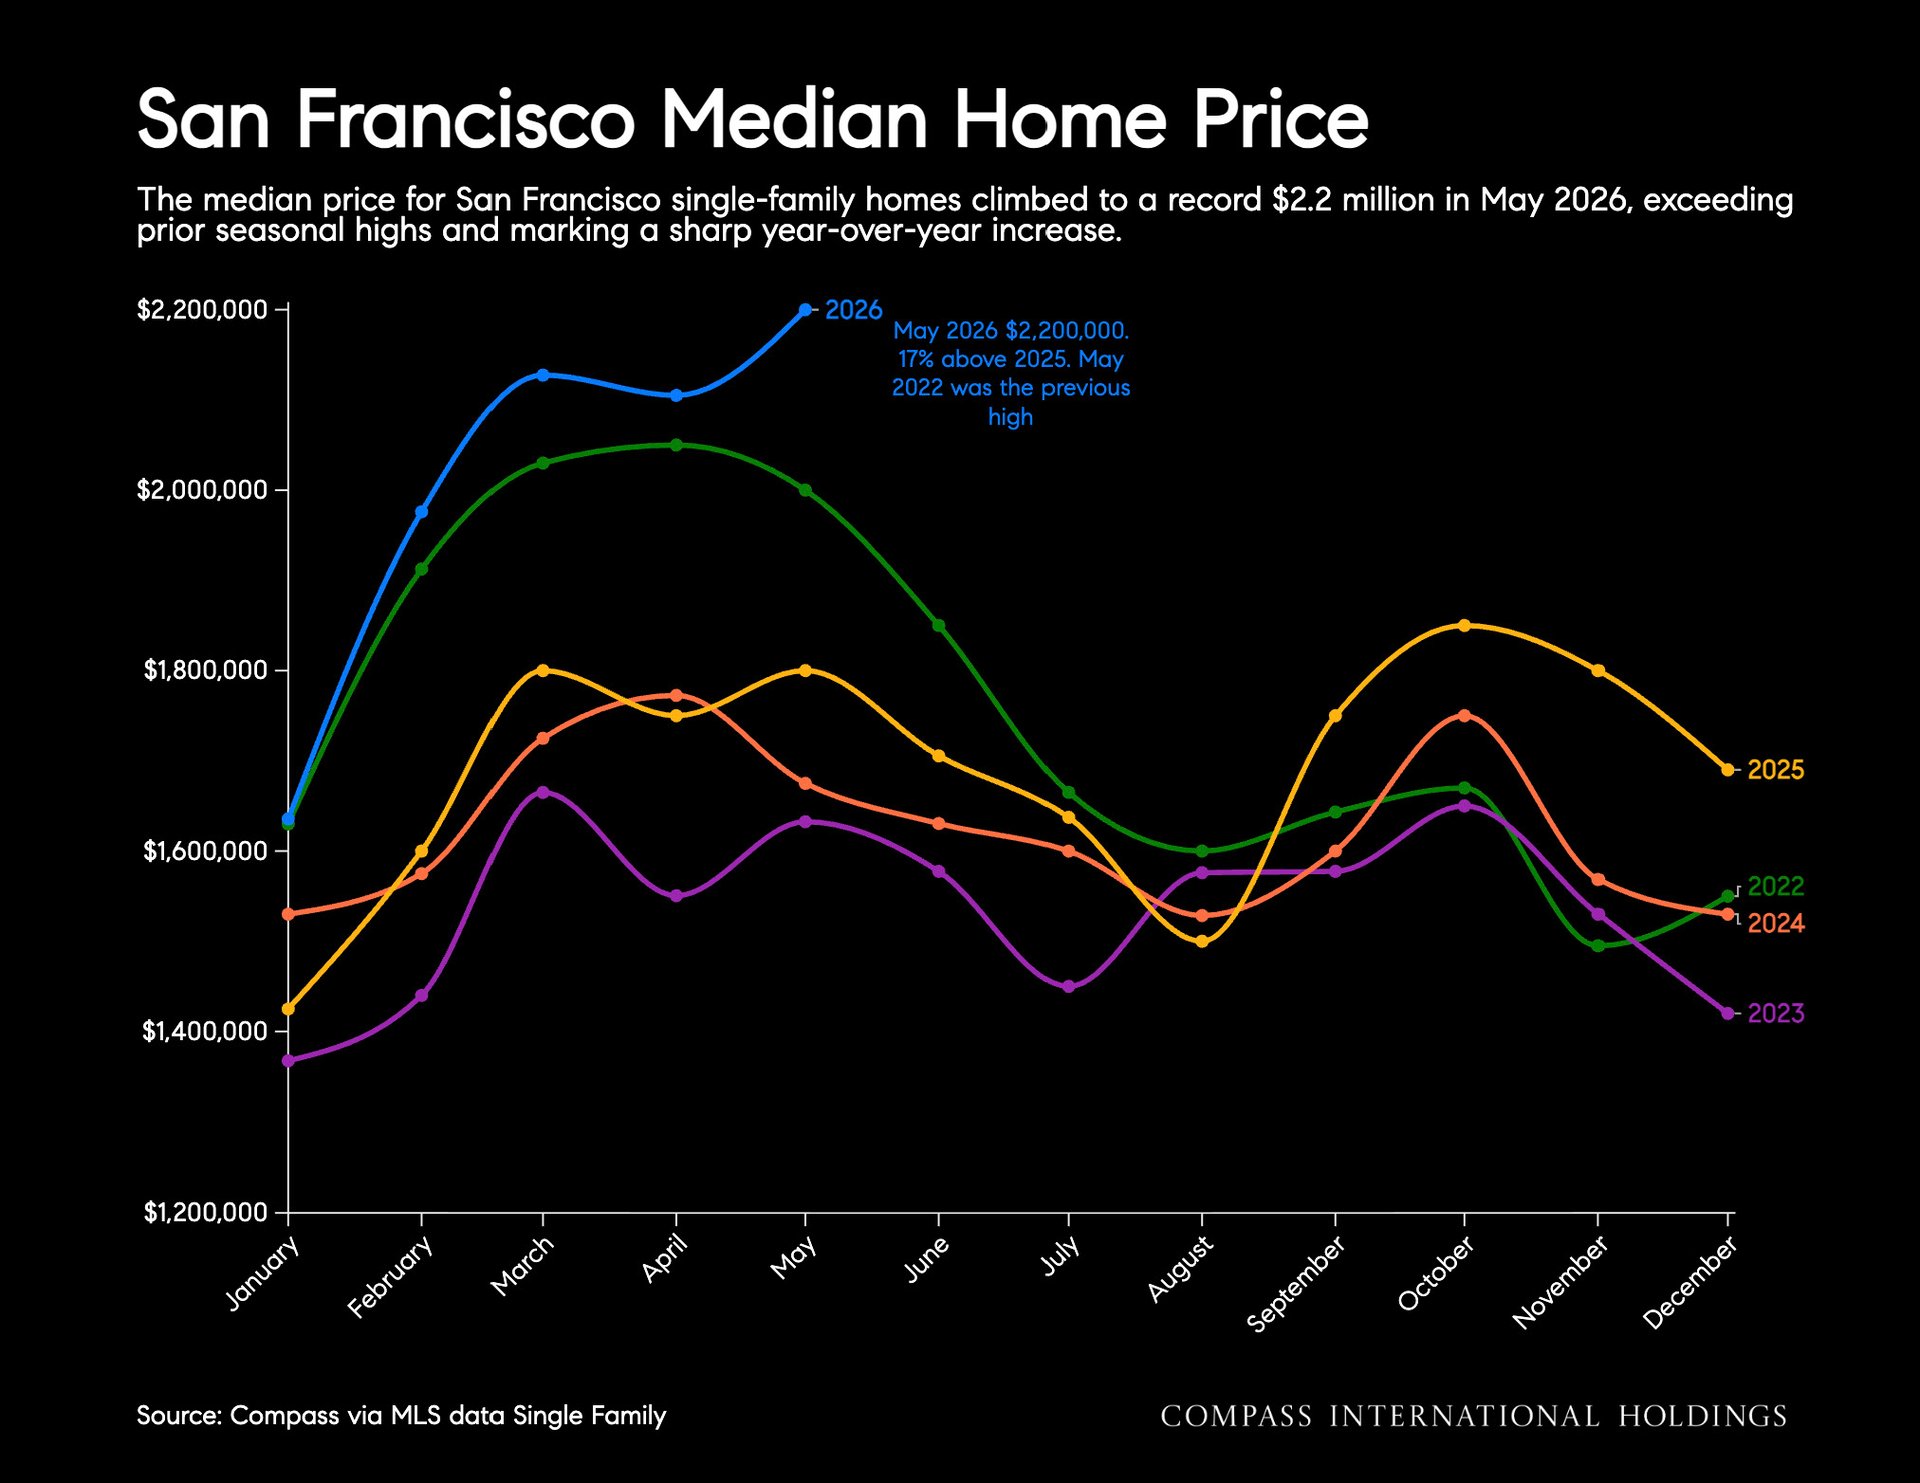
Chart of San Francisco single-family home prices and closed sales, with the latest median price at $2.2 million.Line chart of San Francisco median home prices by month and year, with 2026 reaching $2.2 million in May.


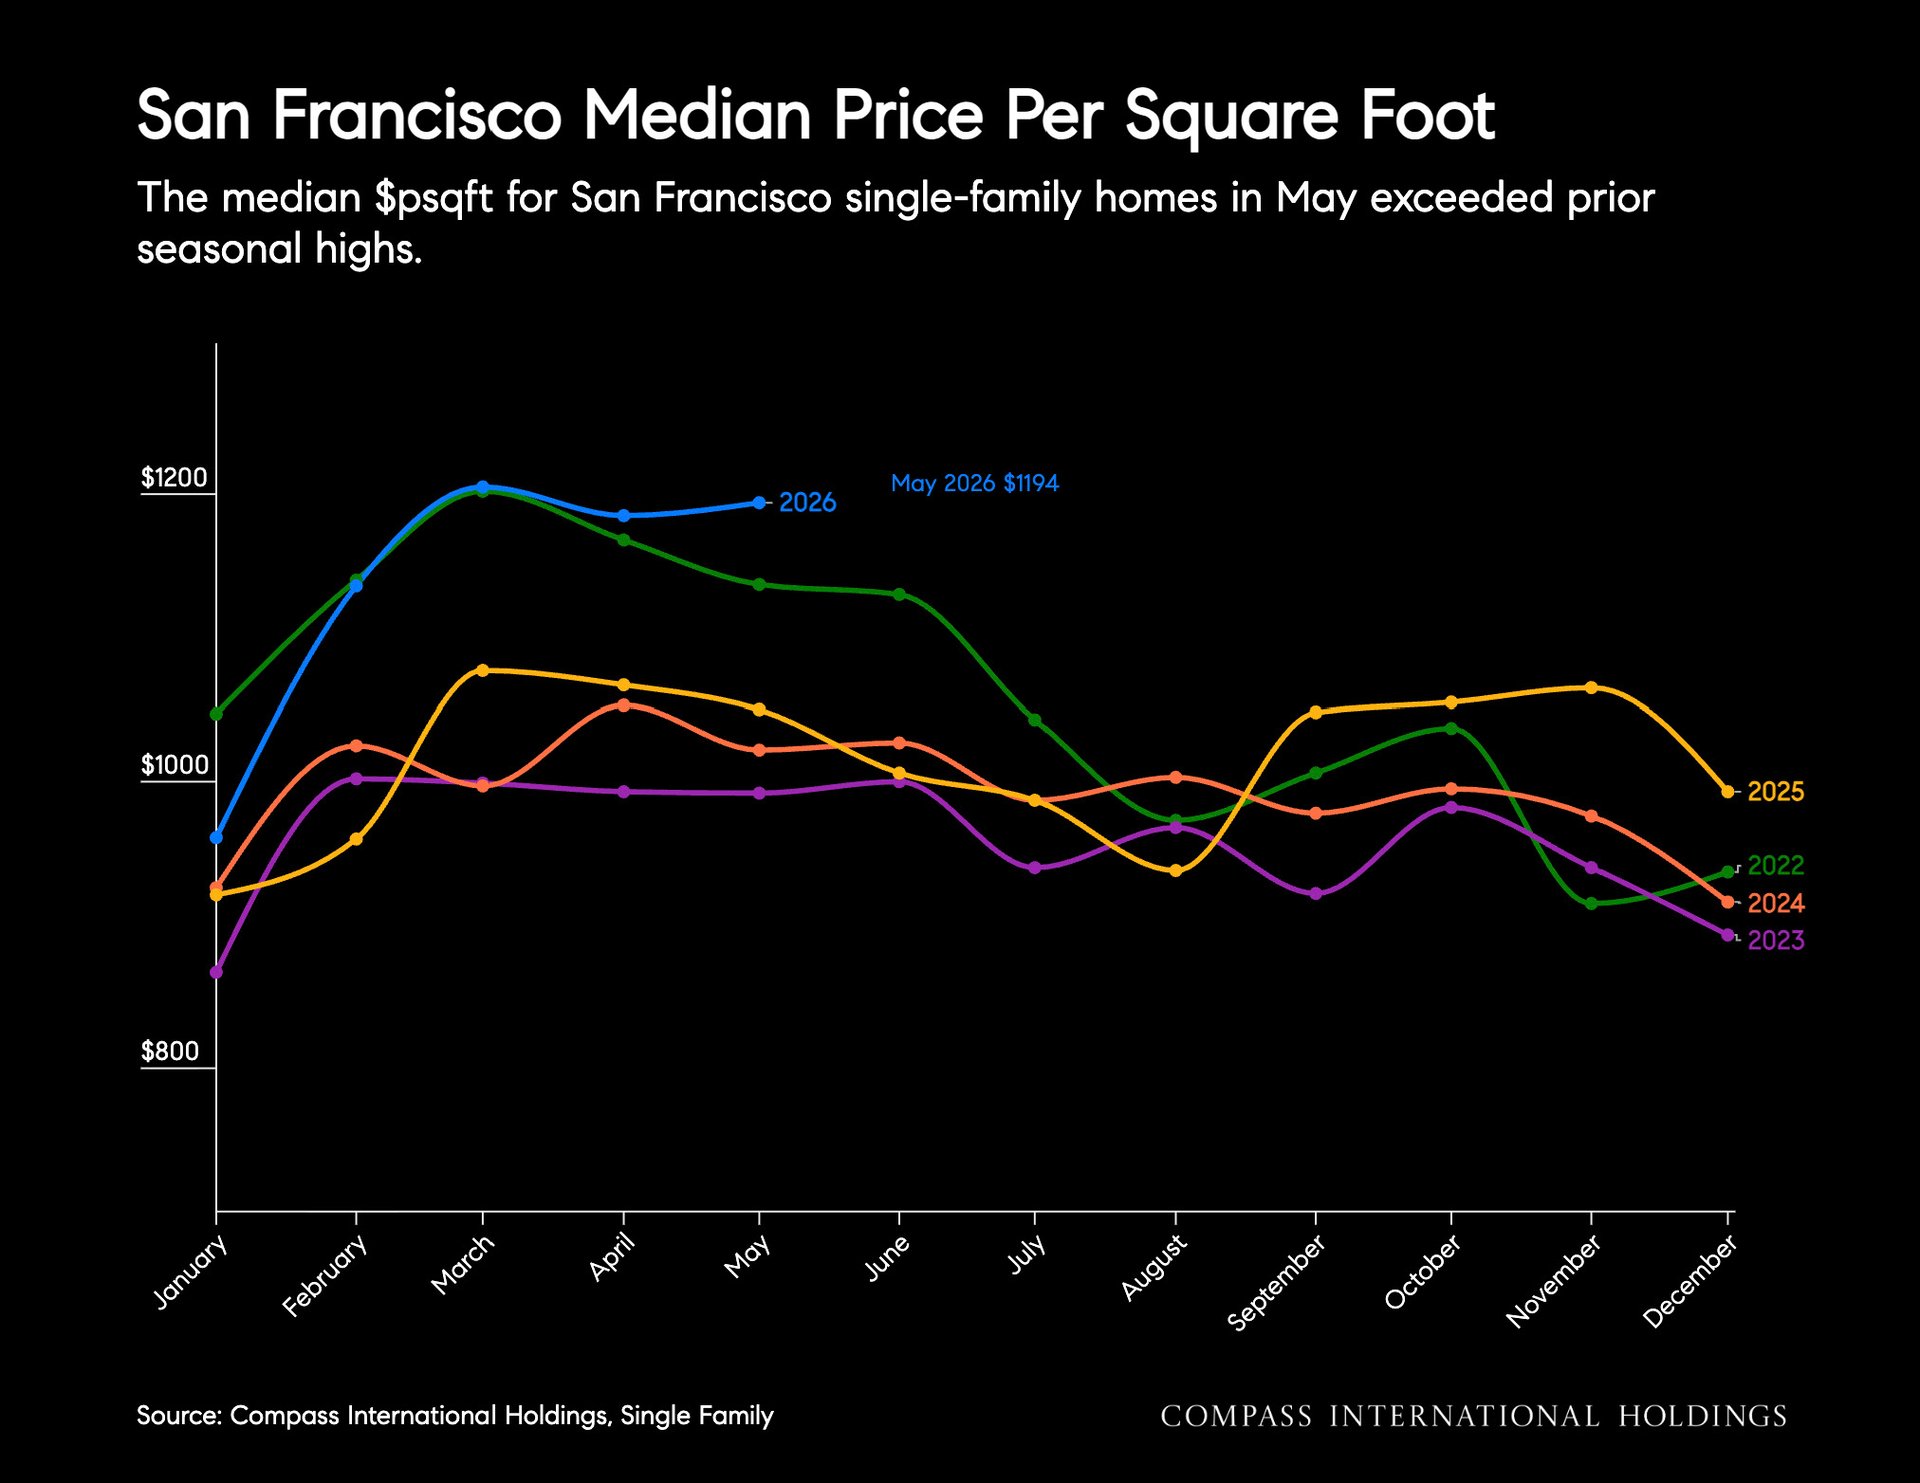
Line chart of San Francisco single-family home median price per square foot, with 2026 reaching $1,194 in May.


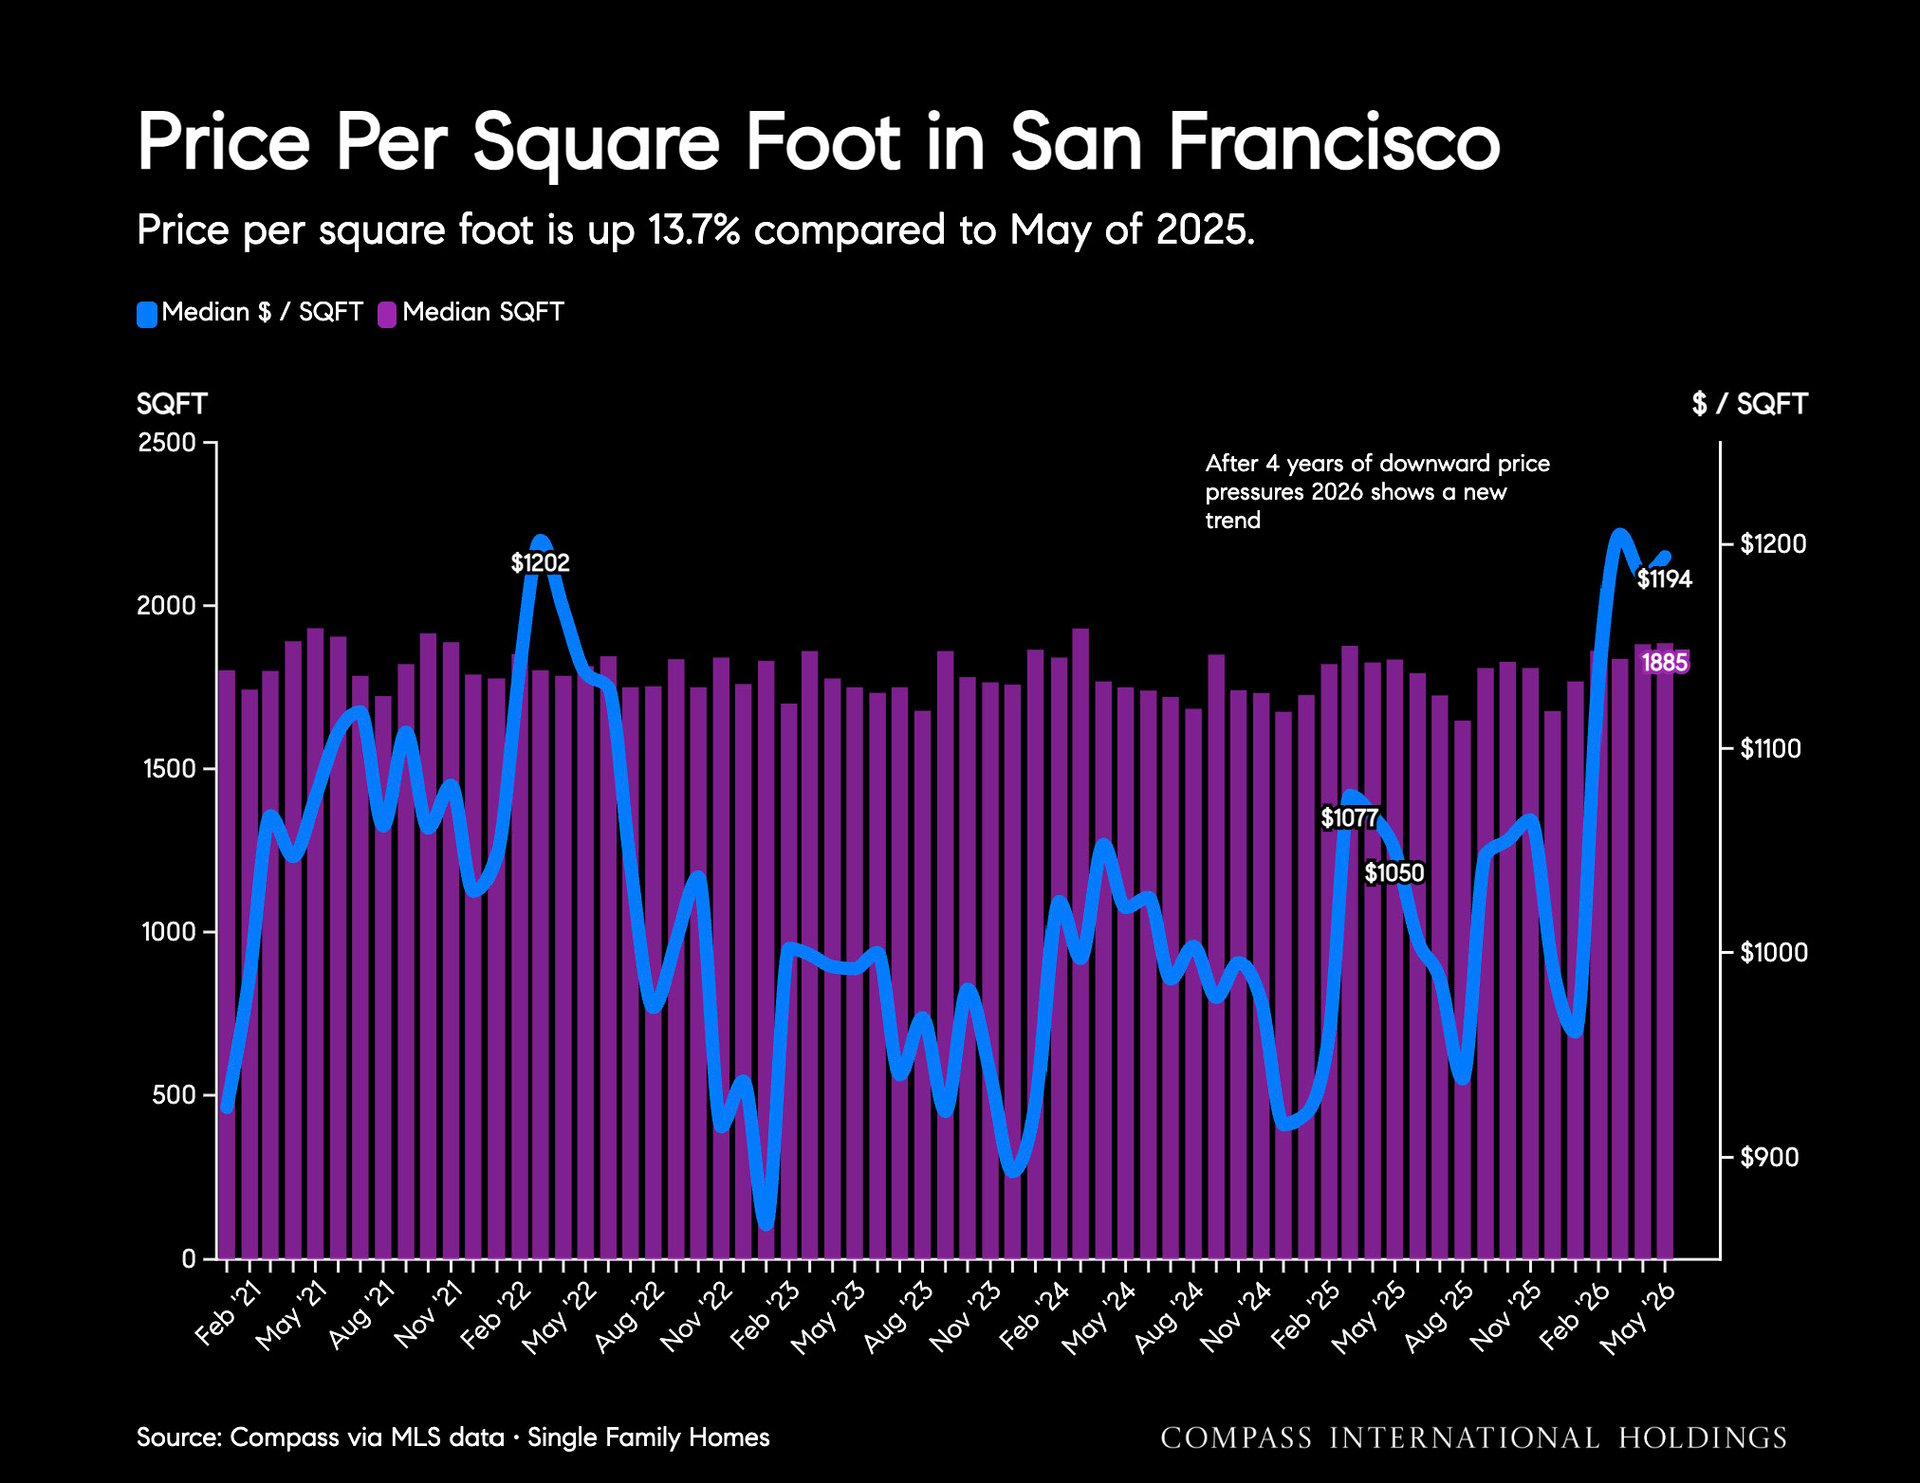
San Francisco housing chart showing median price per square foot and median home size from 2021 to 2026.


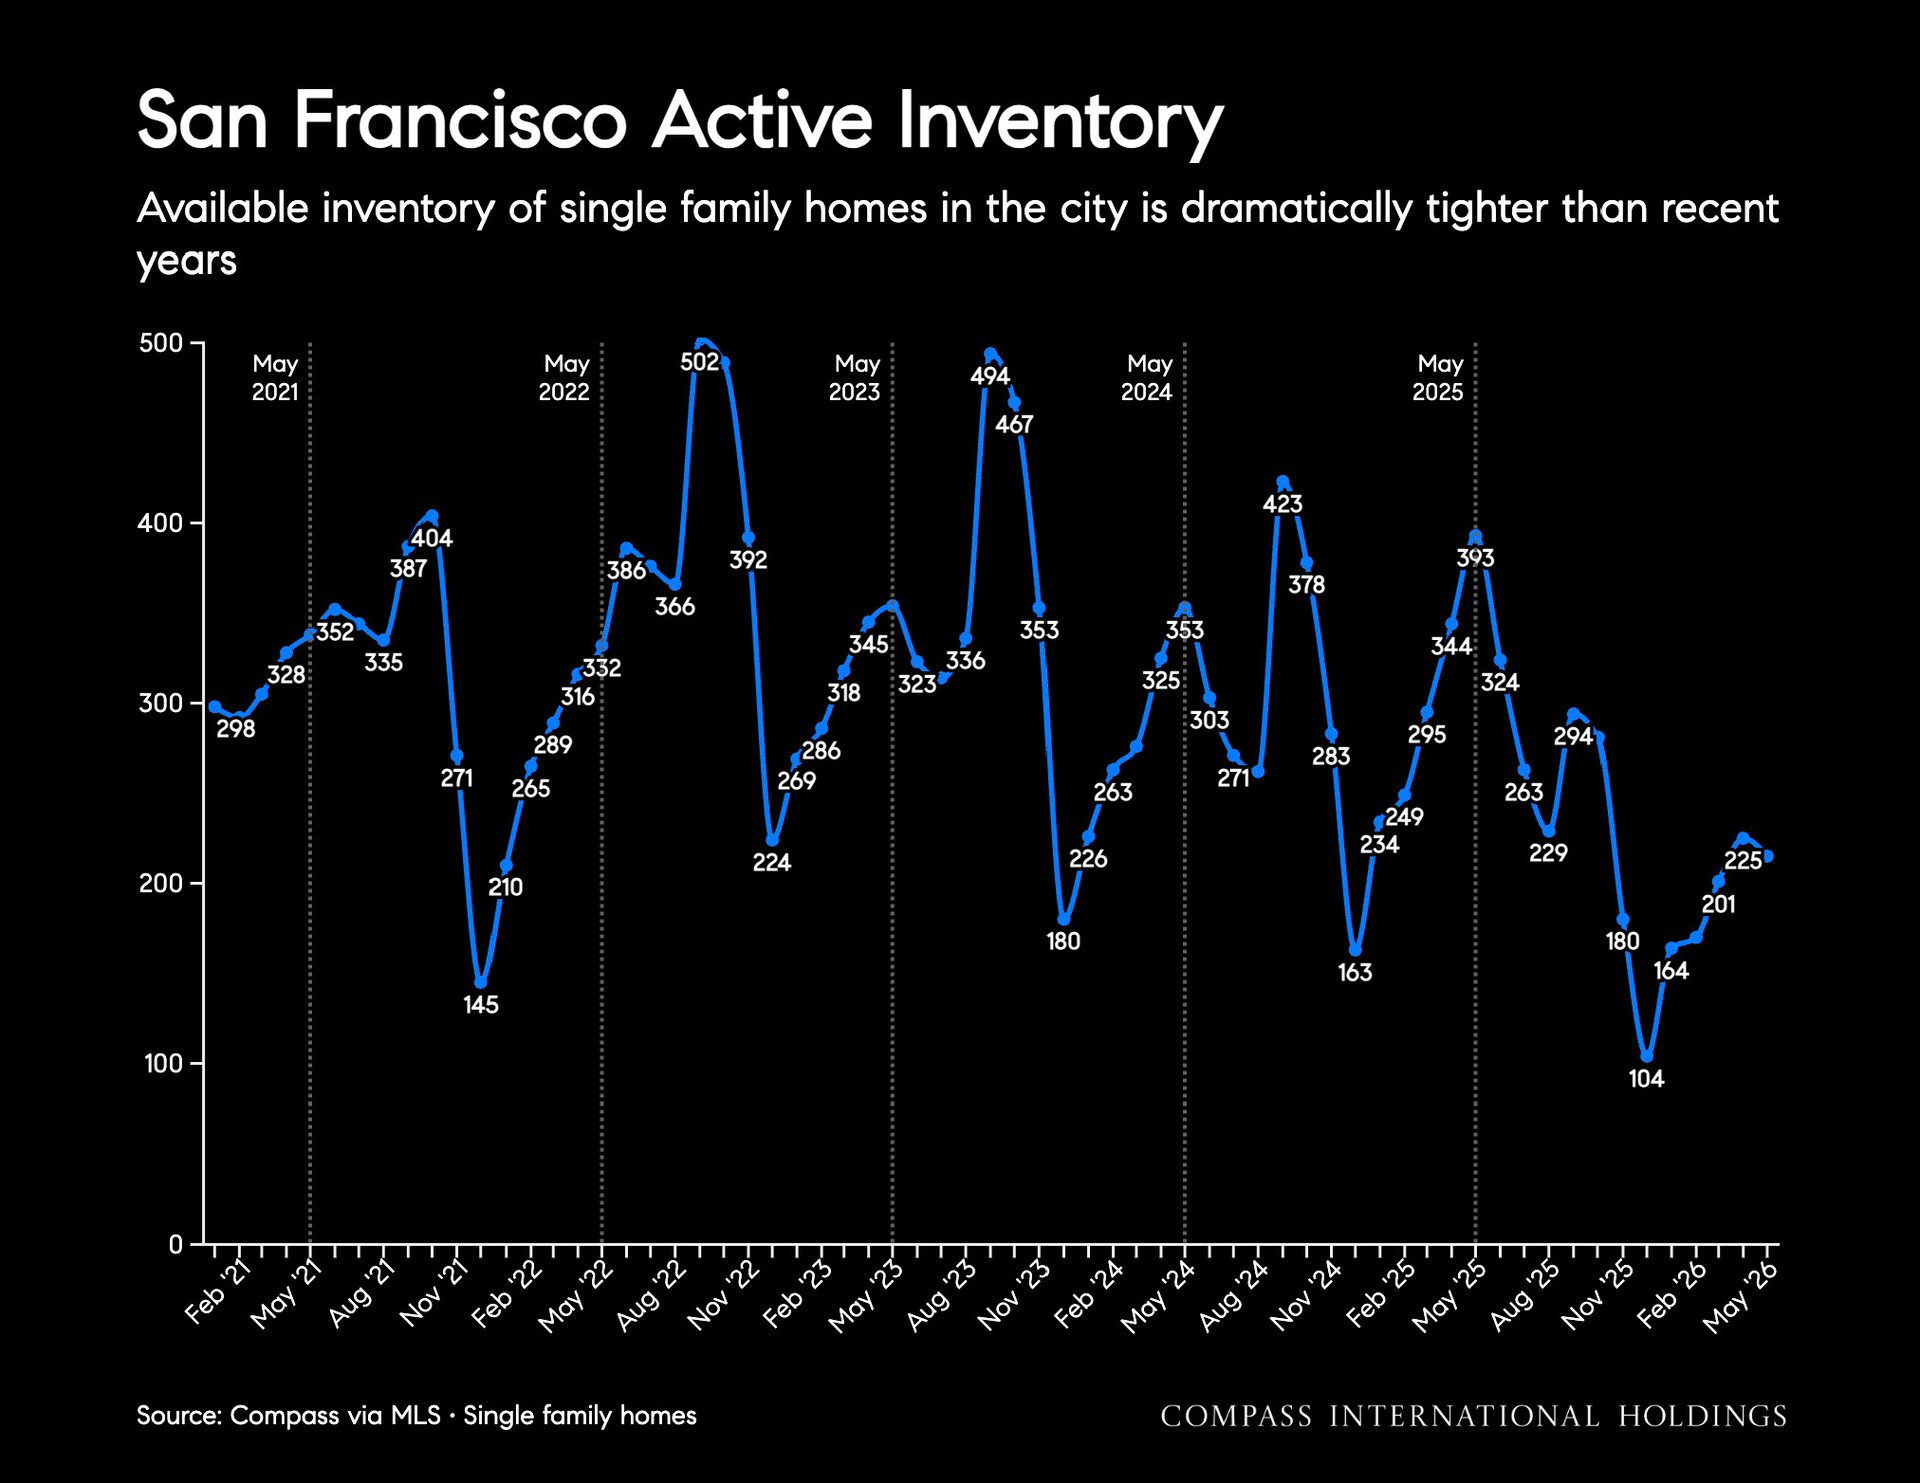
Chart of San Francisco active single-family home inventory from 2021 to 2026, with seasonal peaks and a recent decline.


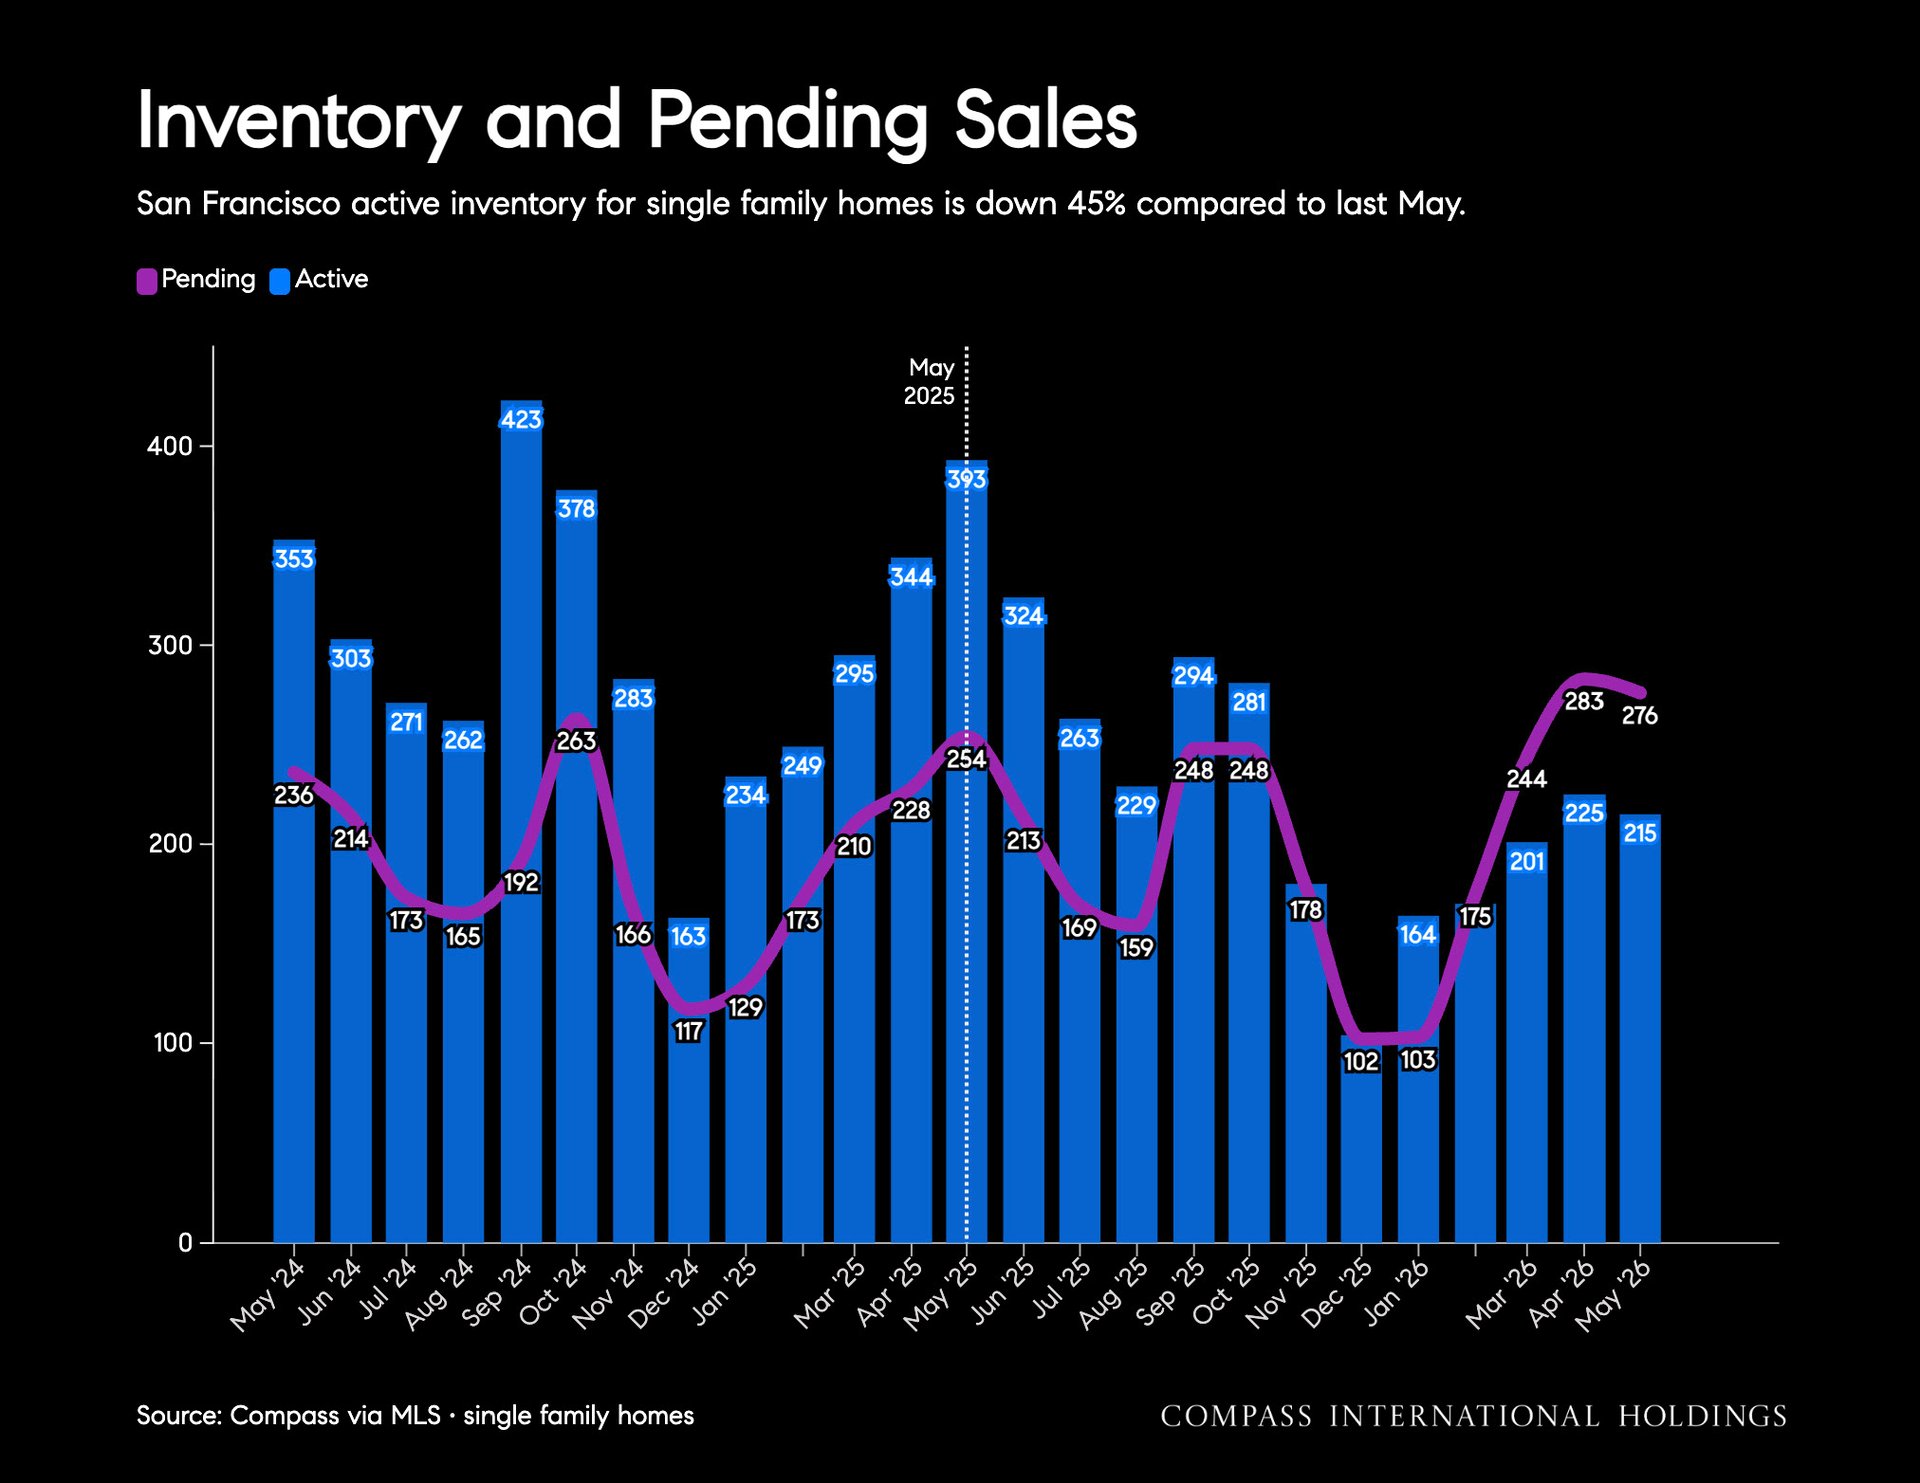
Chart of San Francisco single-family home inventory and pending sales, with active inventory down 45% year over year.


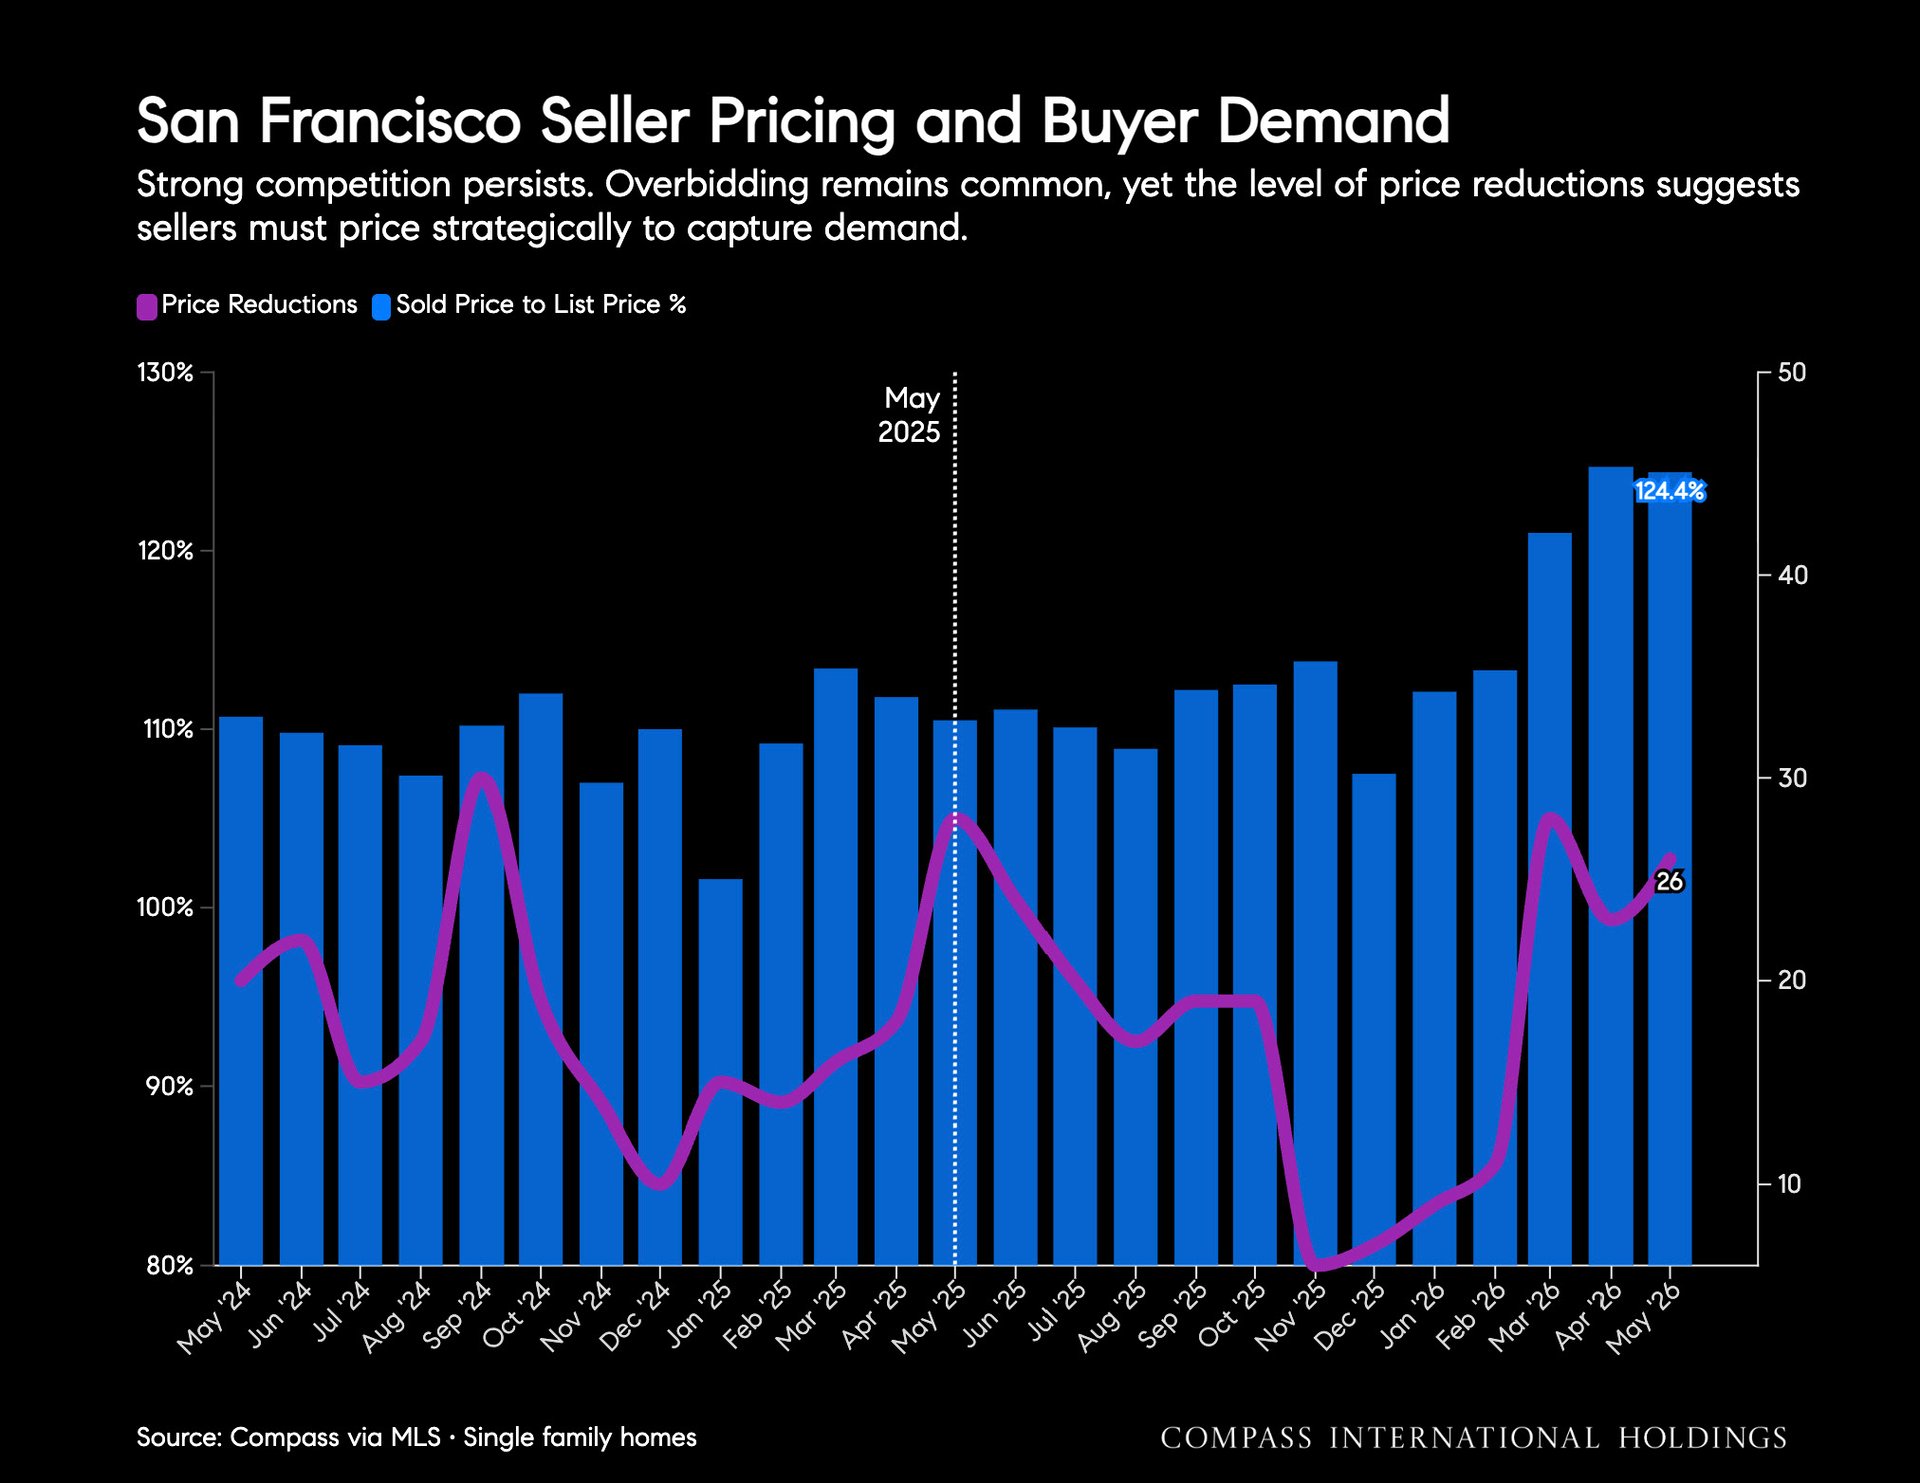
Chart of San Francisco home pricing and demand, May 2024–May 2026; May 2026 sold price-to-list ratio is 124.4%.


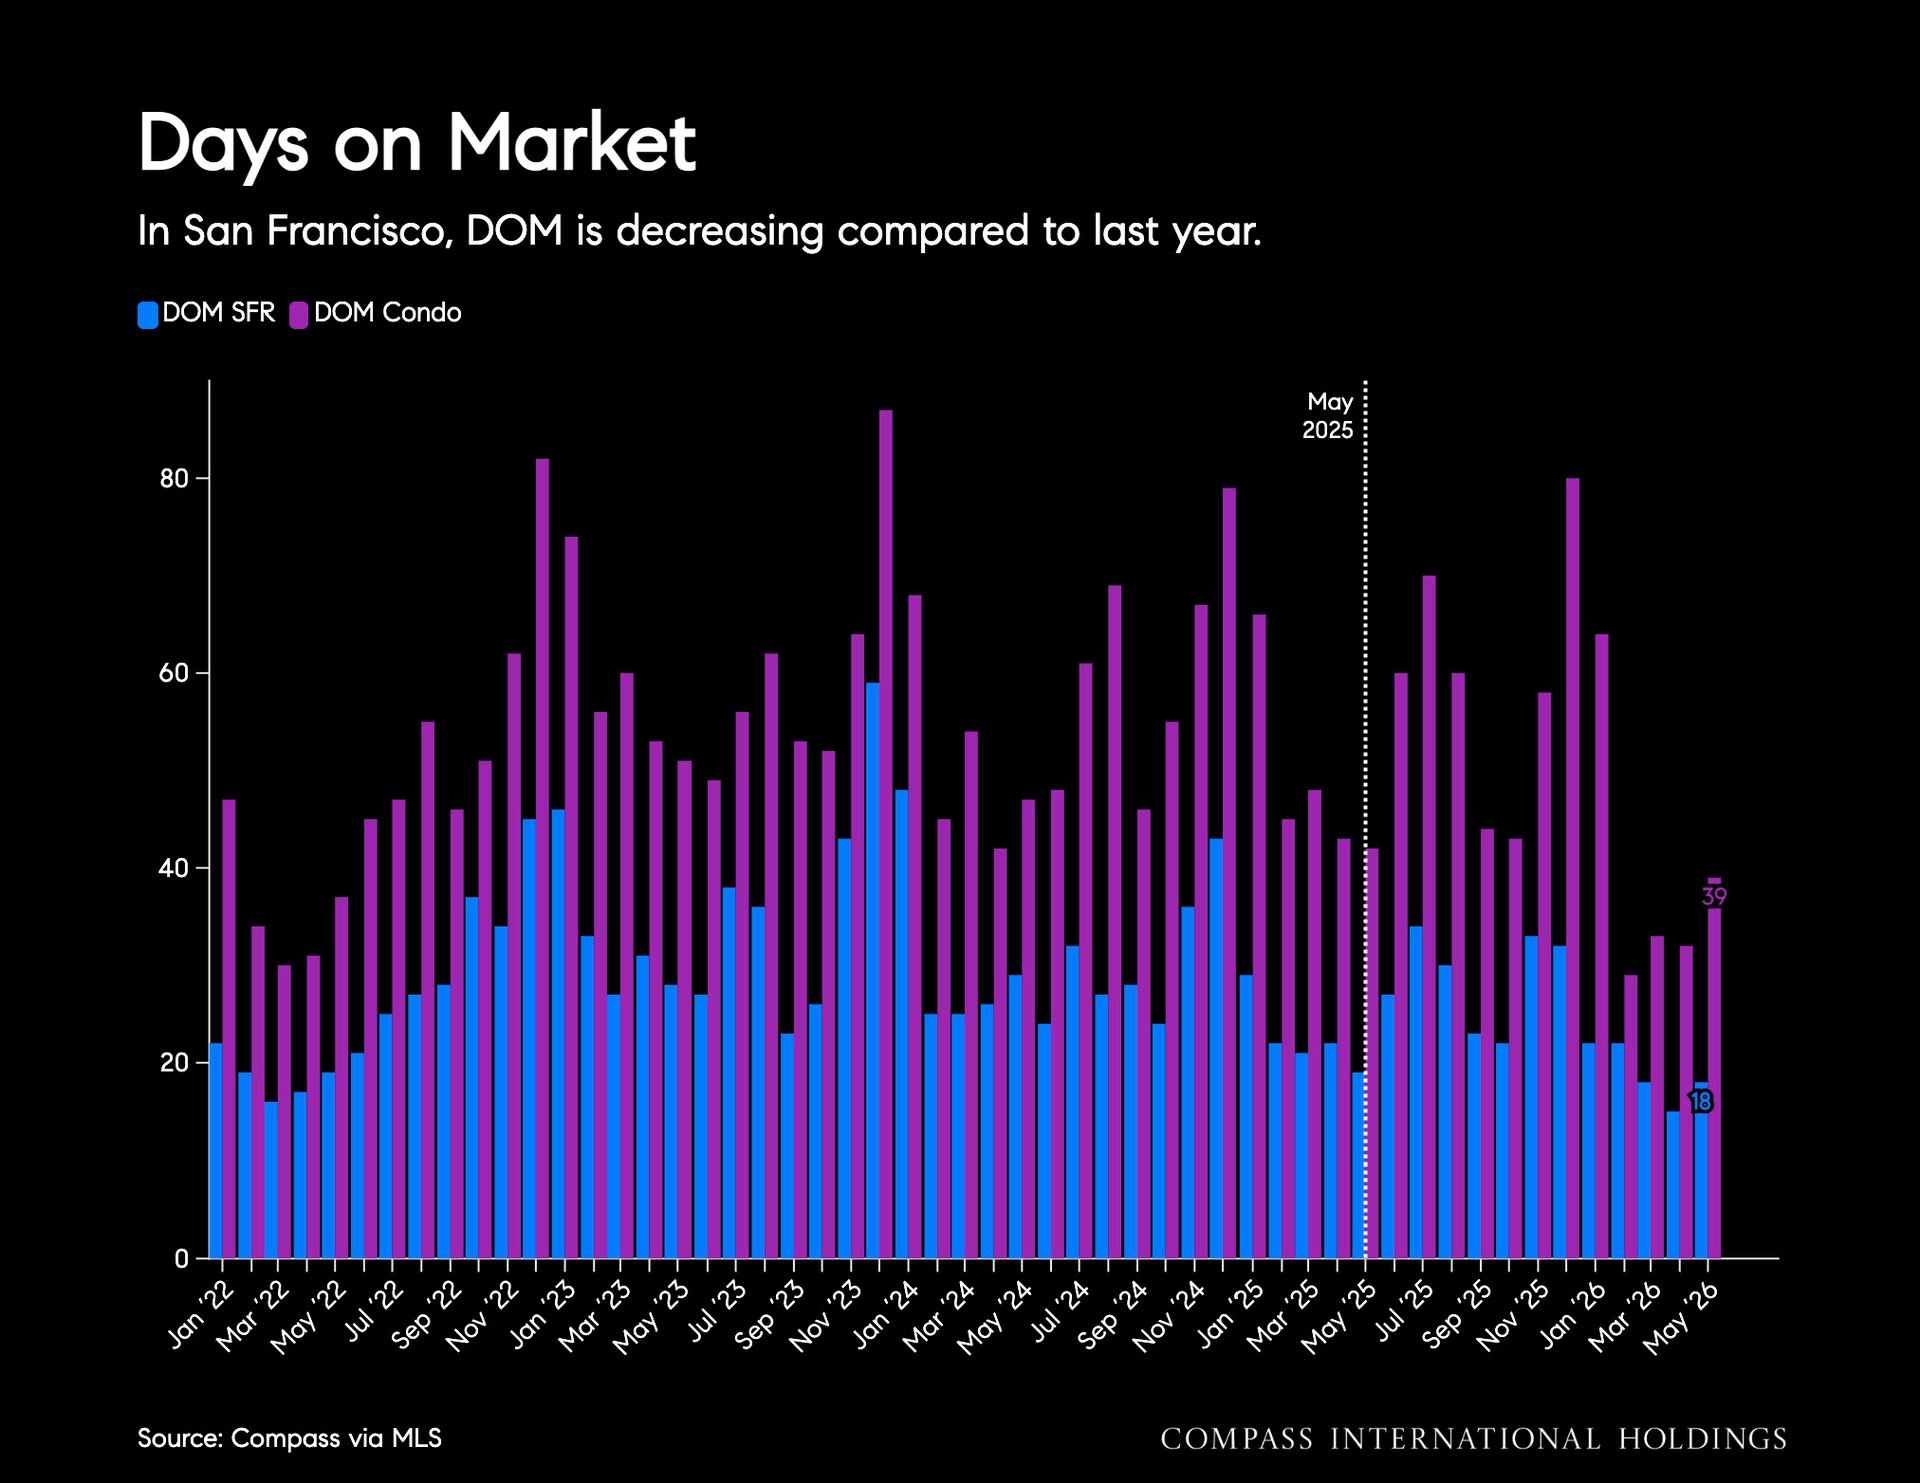
San Francisco days-on-market chart comparing single-family residences and condos from January 2022 to May 2026.


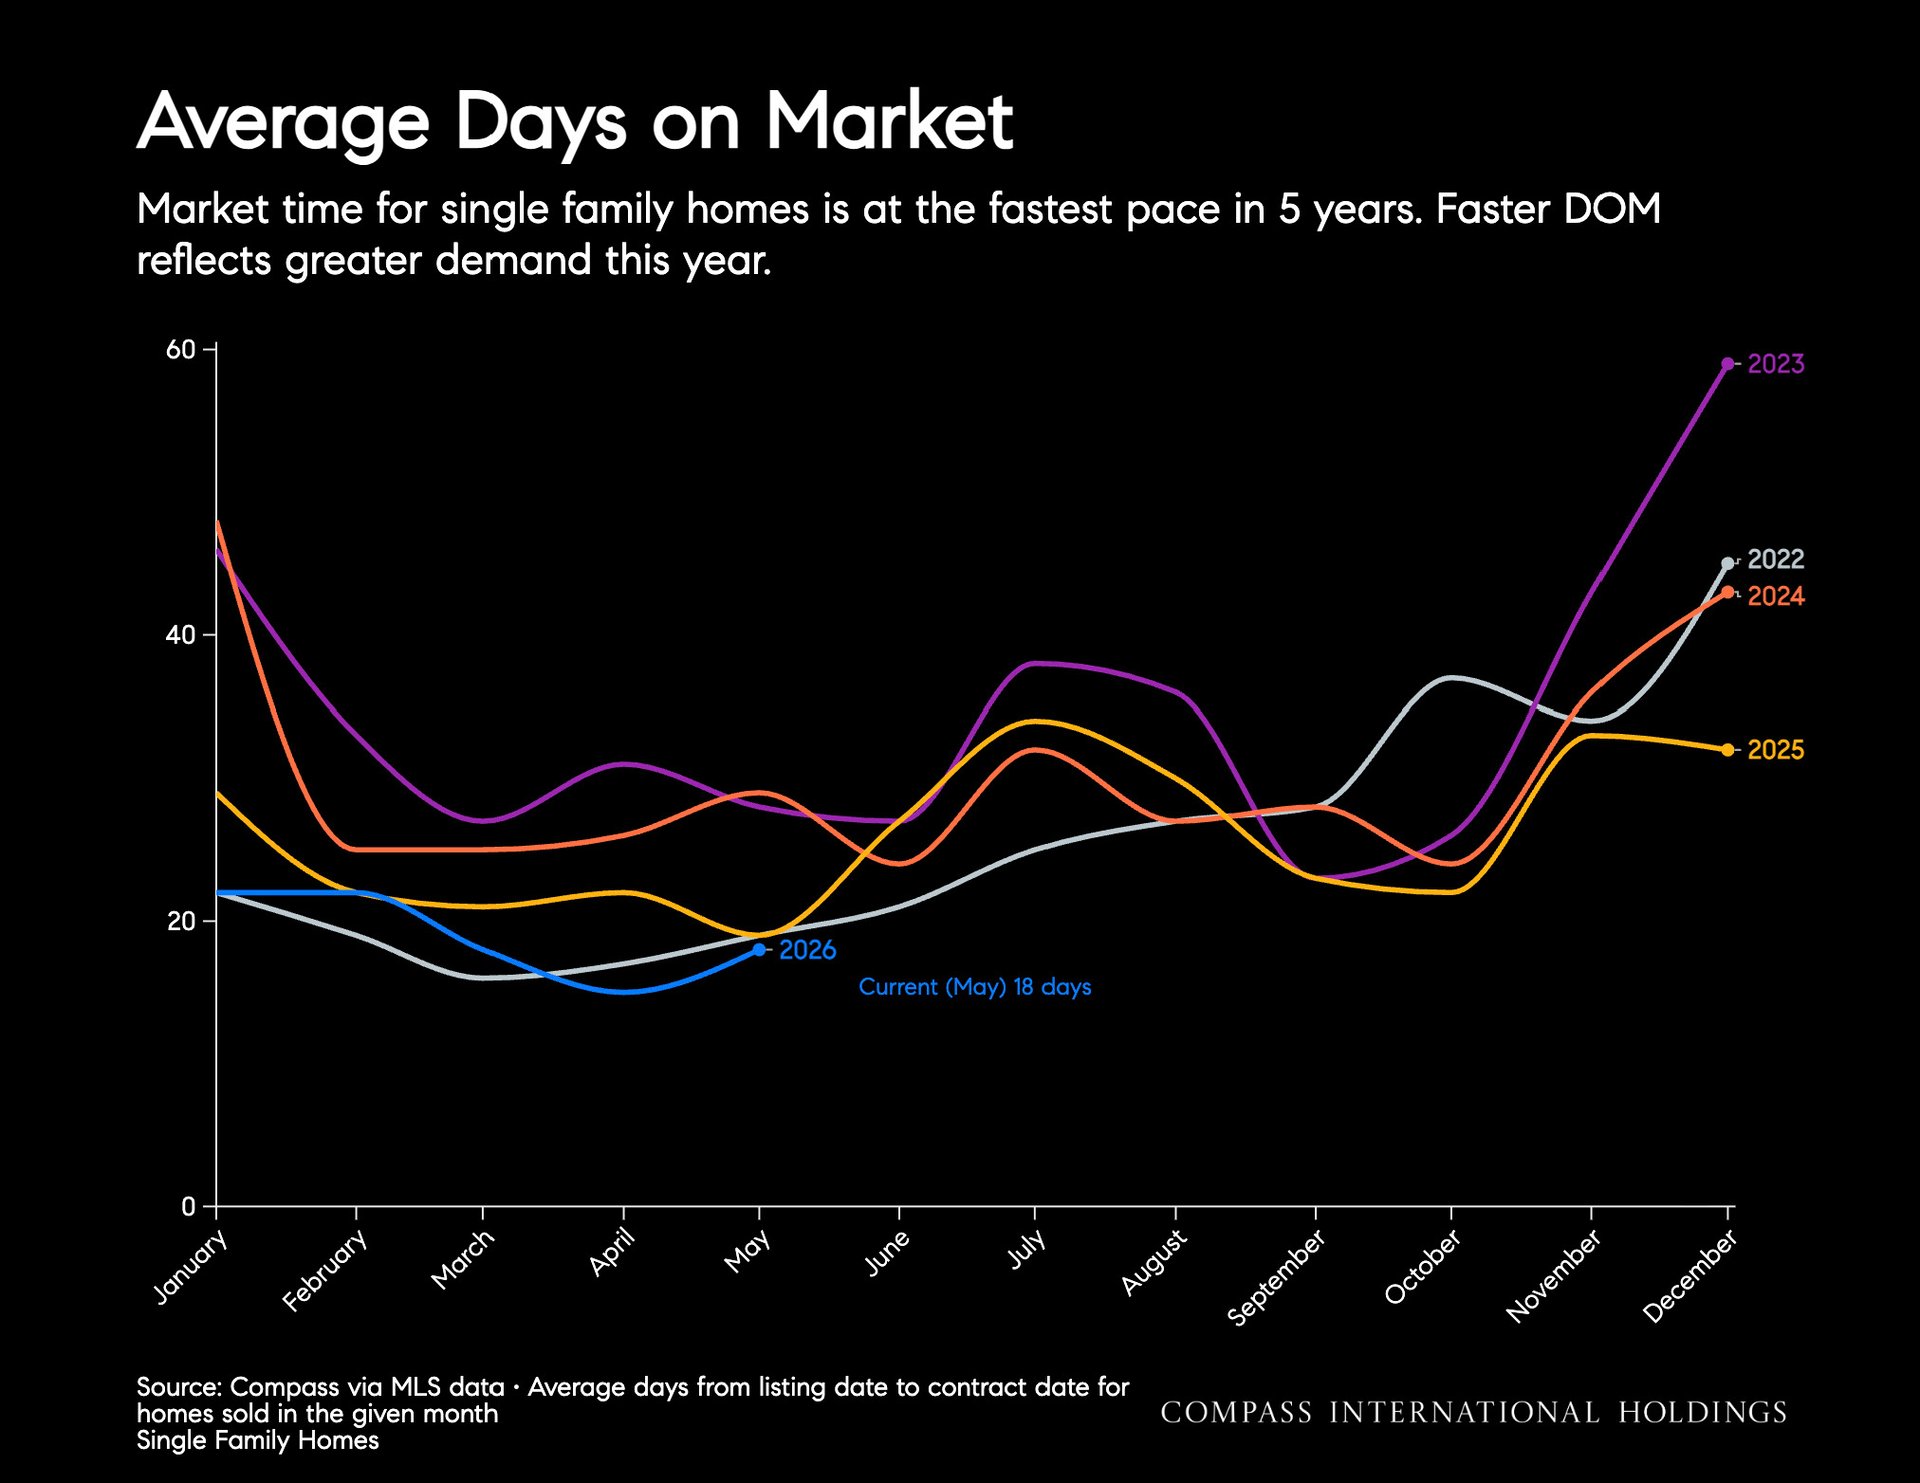
Line chart compares monthly average days on market for single-family homes from 2022 to 2026; May 2026 is 18 days.


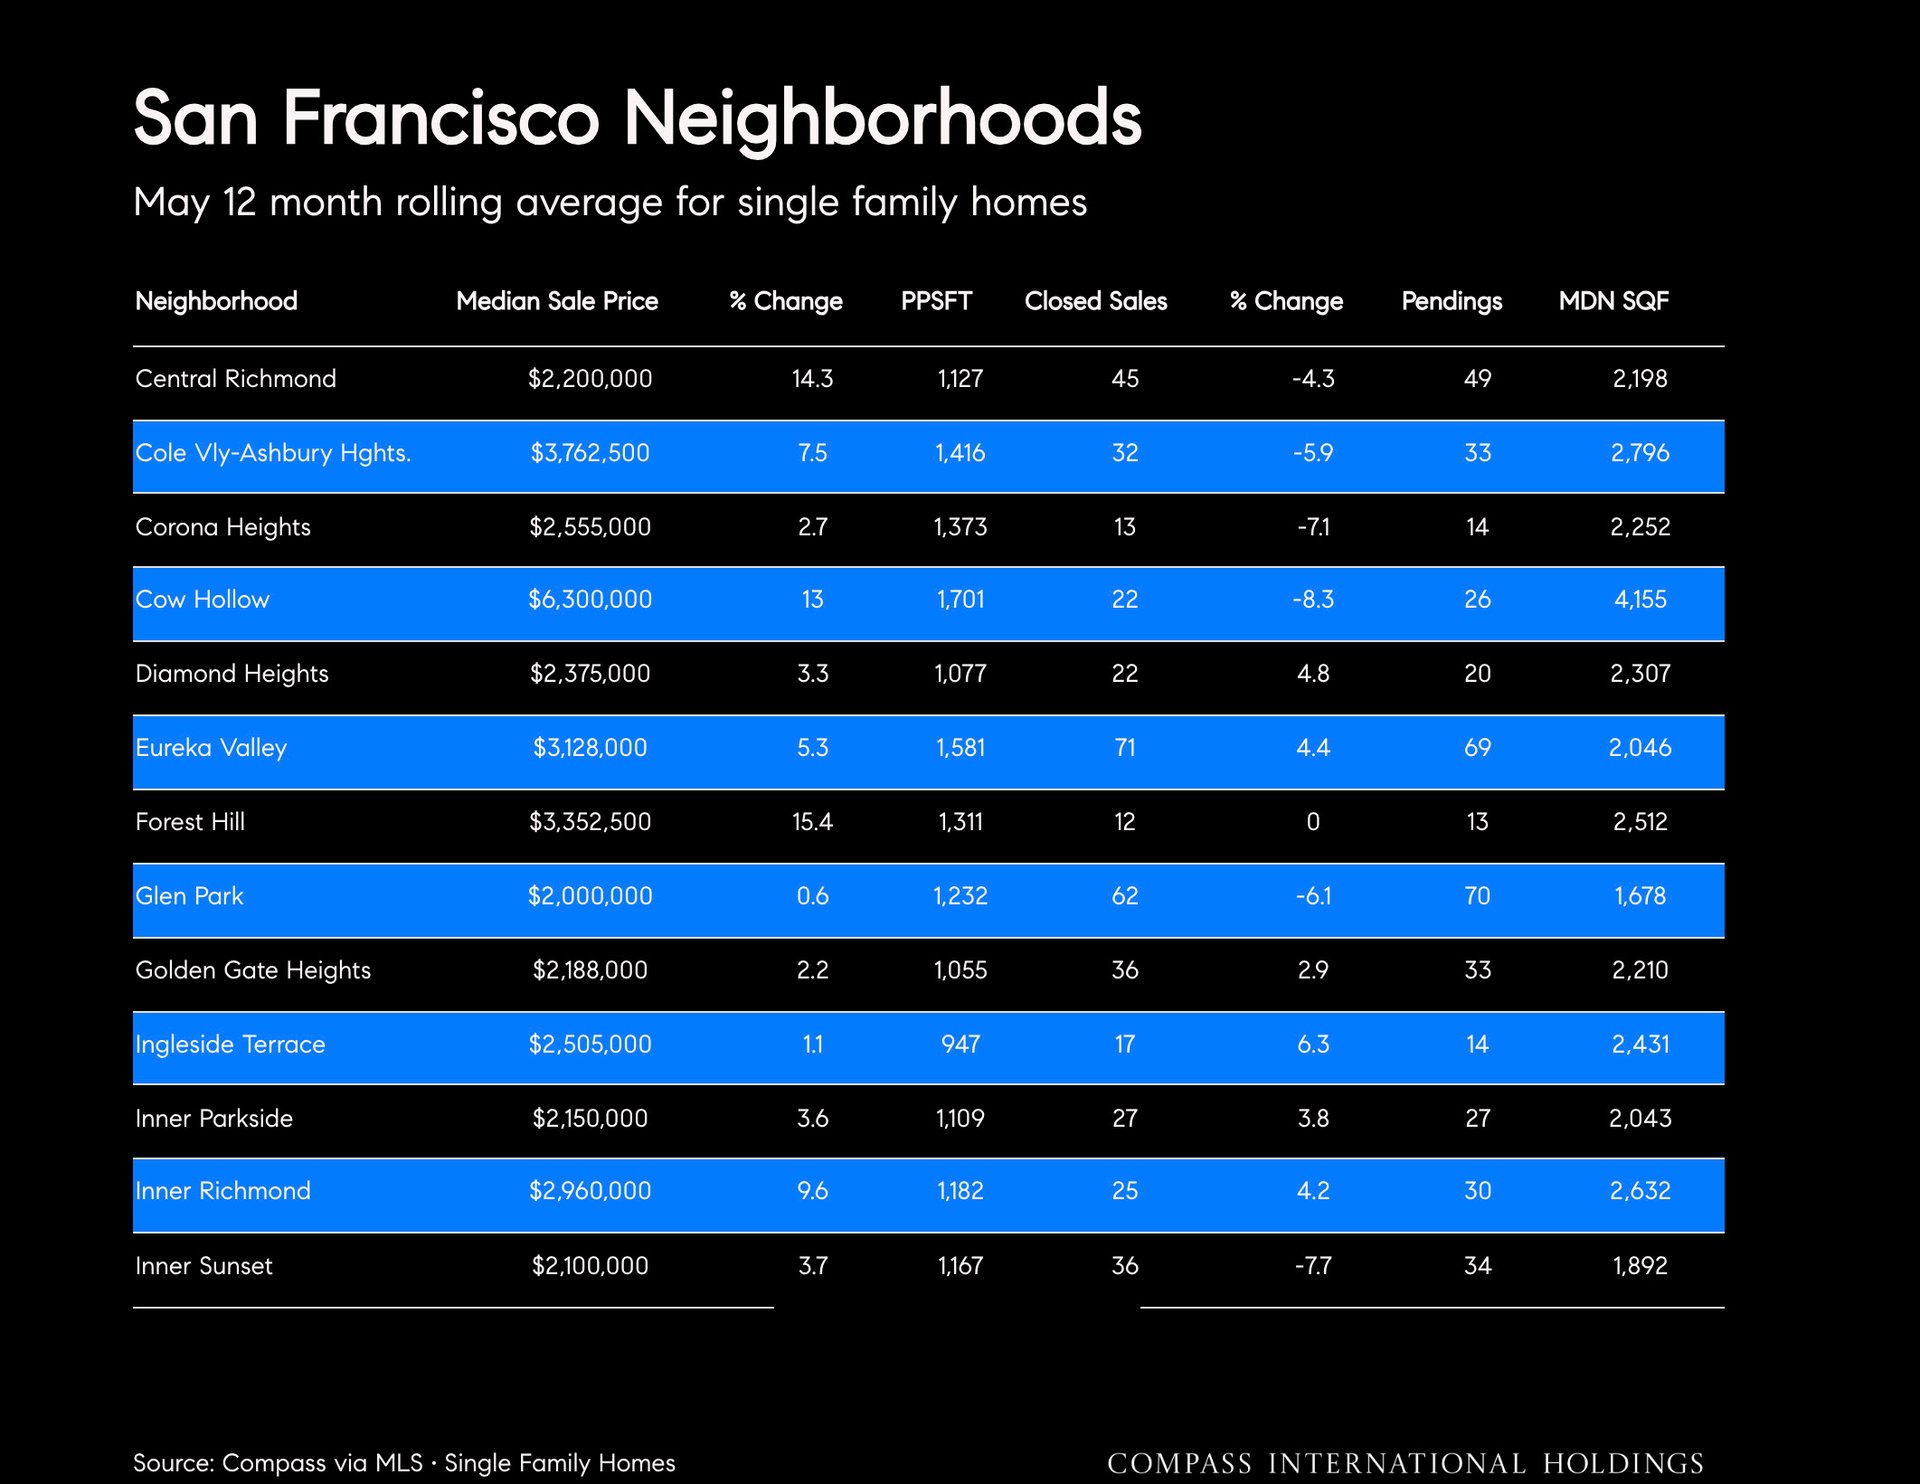
San Francisco neighborhood housing market table with 12-month rolling averages for single-family homes.


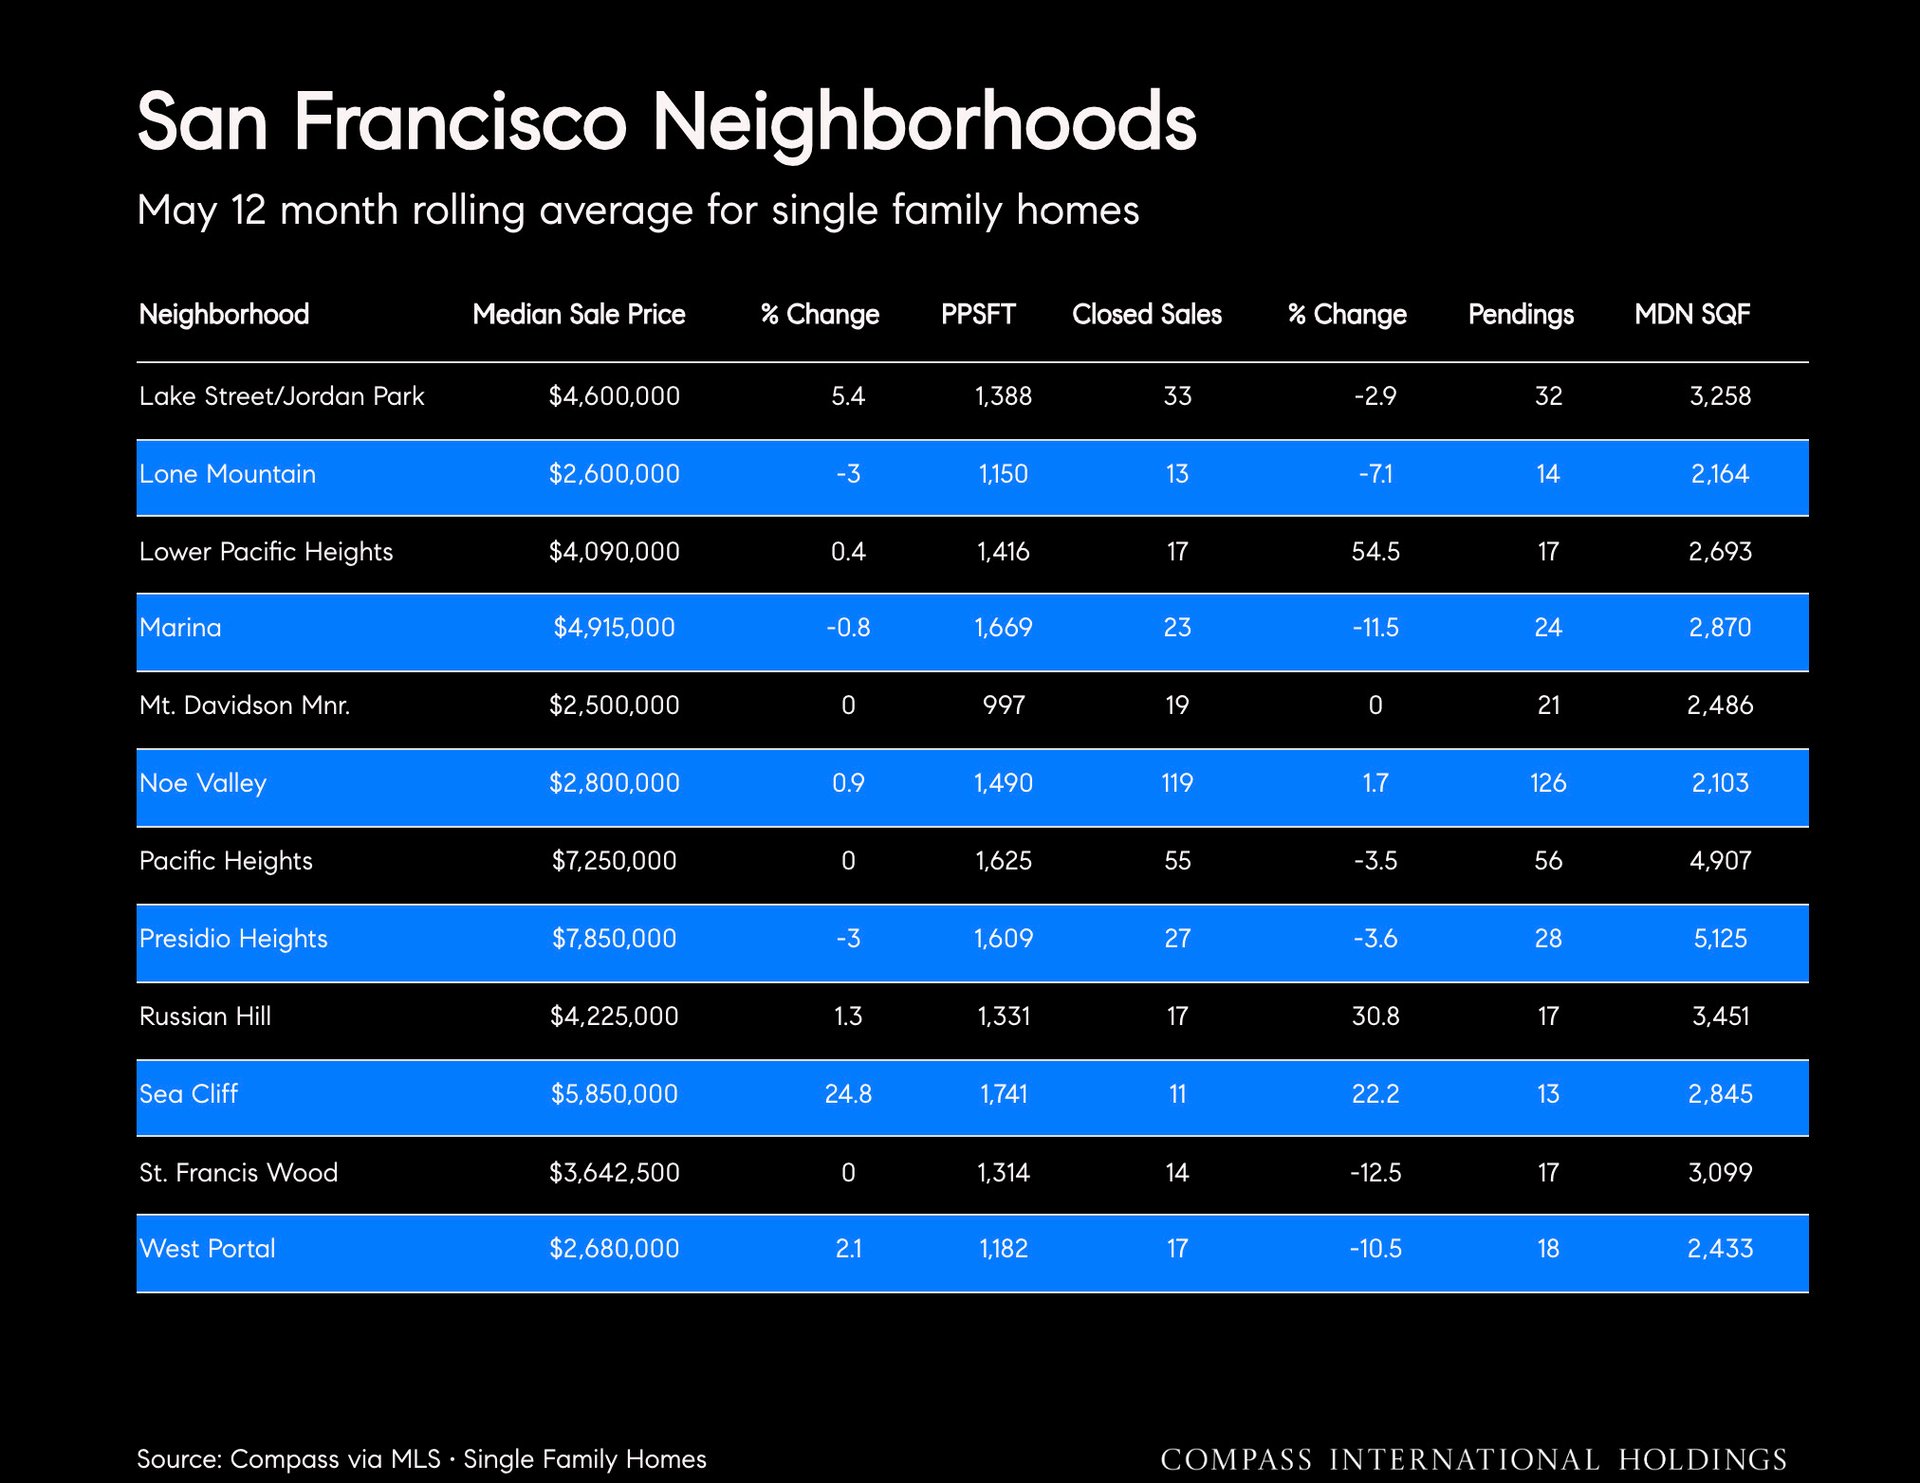
San Francisco neighborhood single-family home market table with prices, sales, pending listings, and square footage.


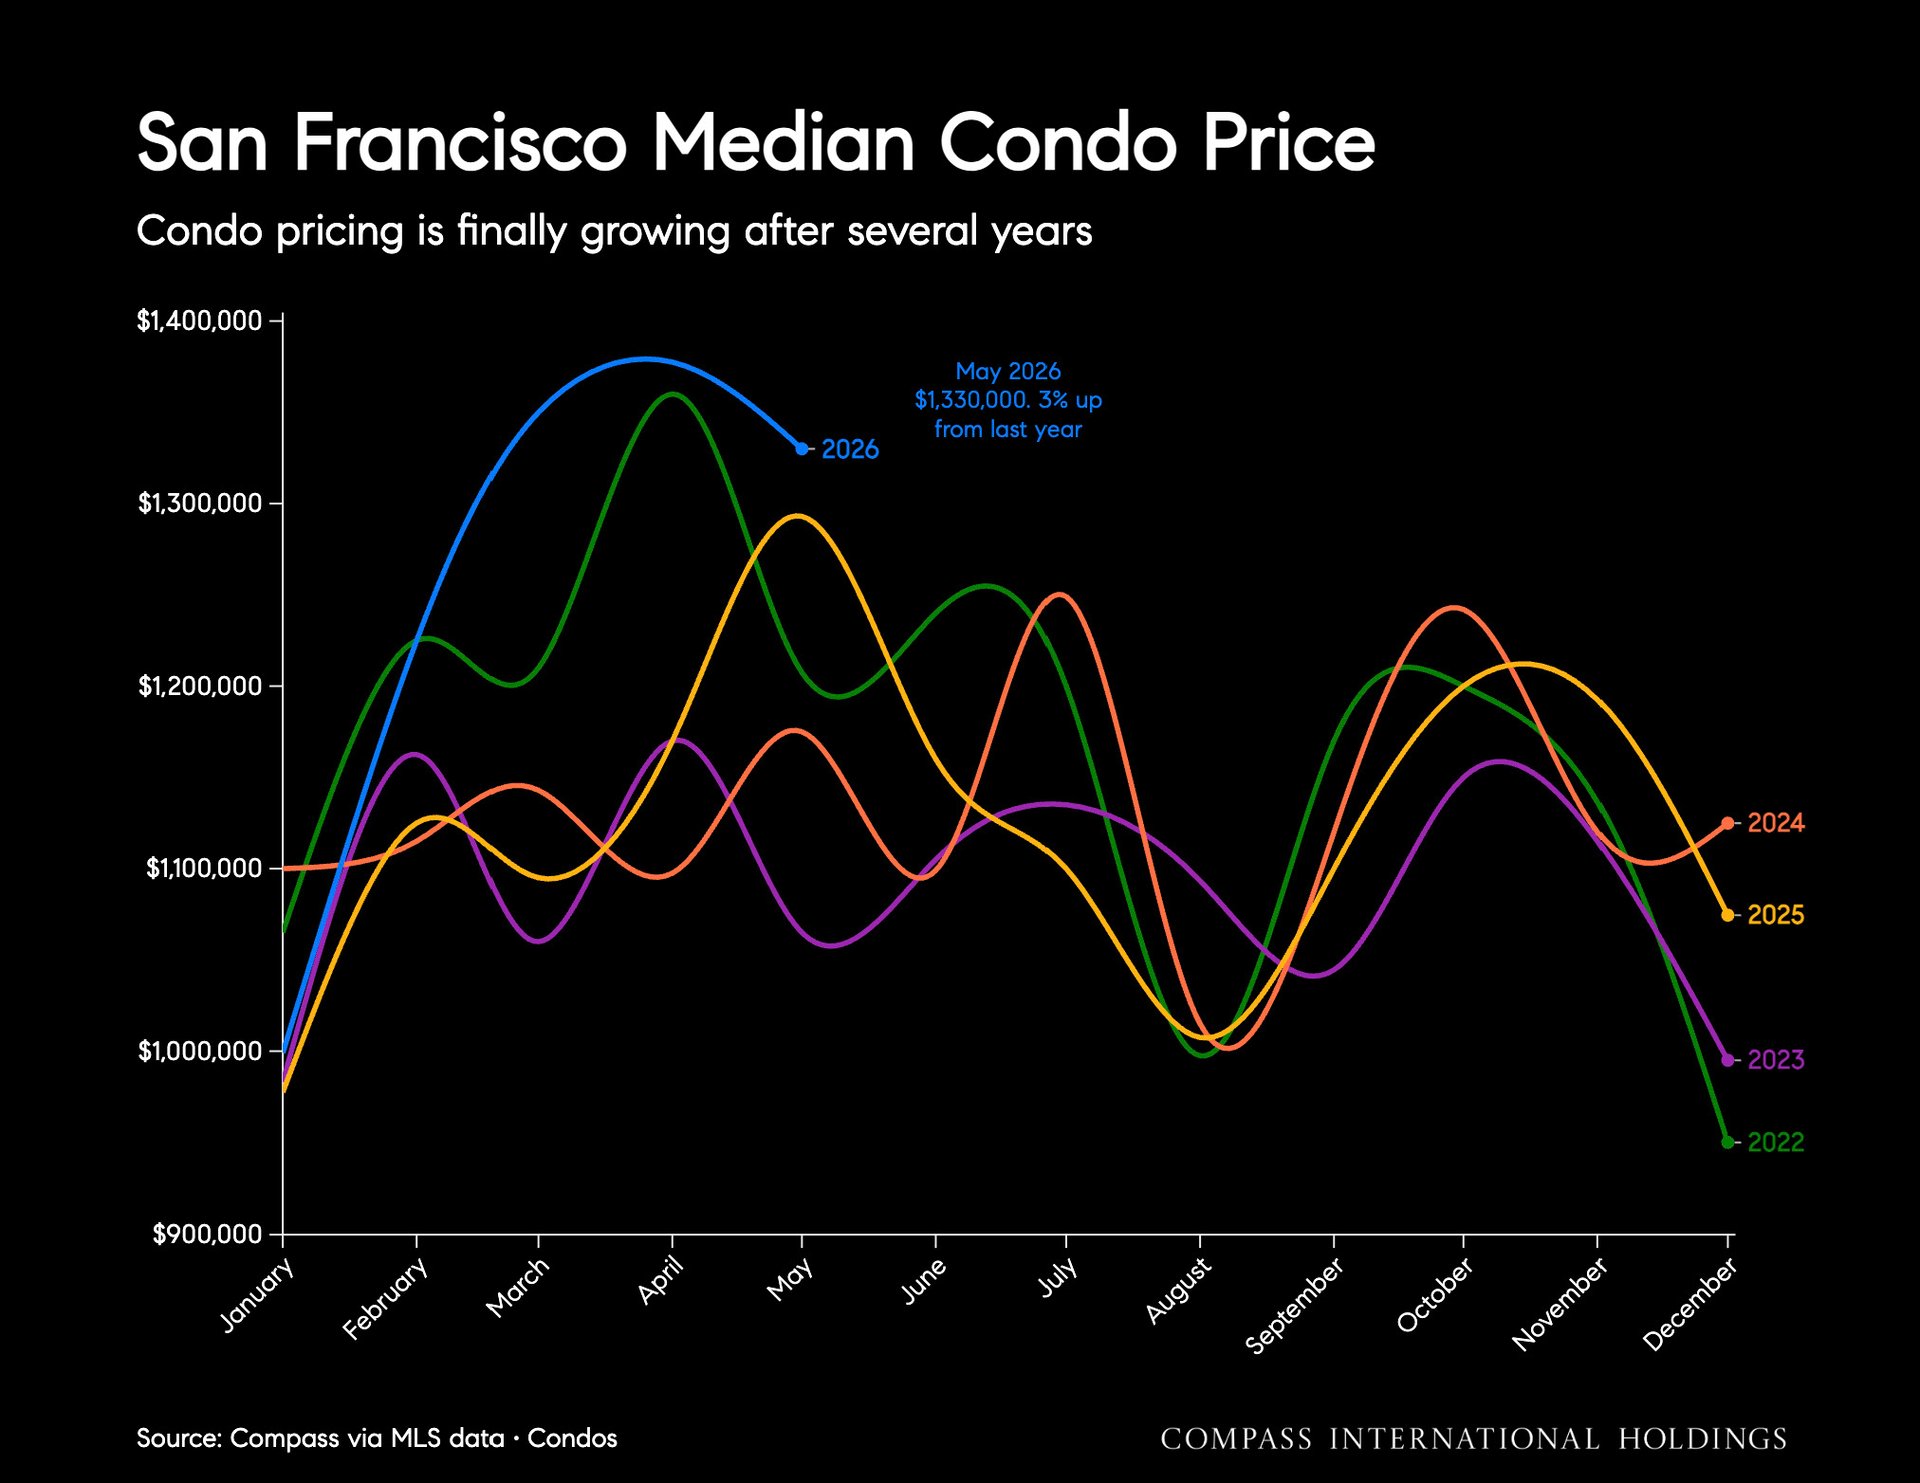
Line chart of San Francisco median condo prices by month, with May 2026 at $1.33 million, up 3% year over year.


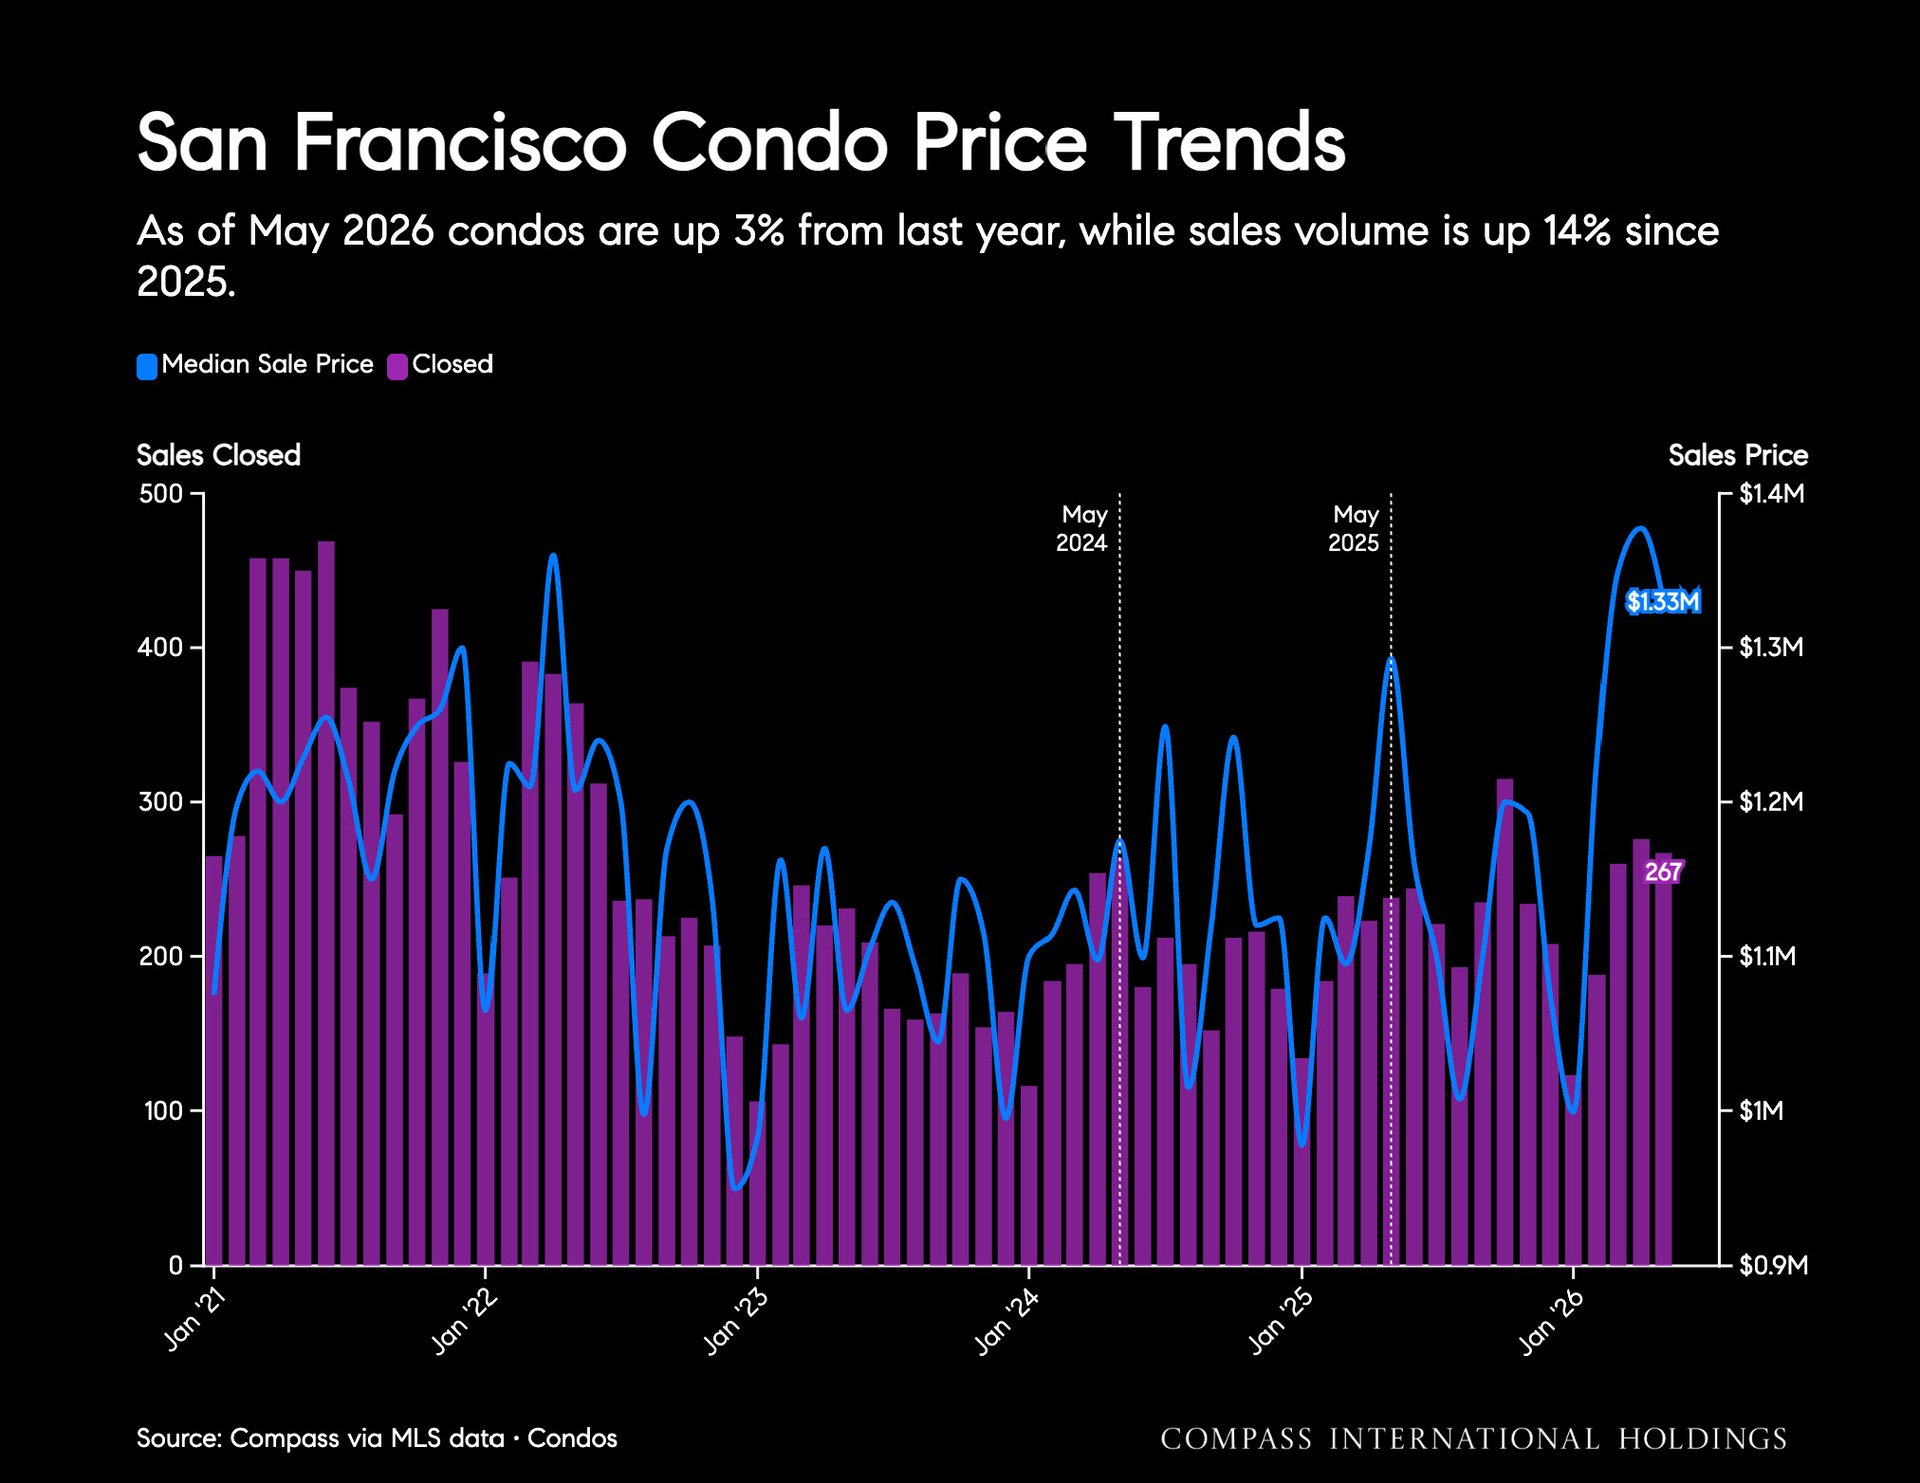
Chart of San Francisco condo prices and closed sales from 2021 to May 2026, with latest values of $1.33 million and 267 sales.


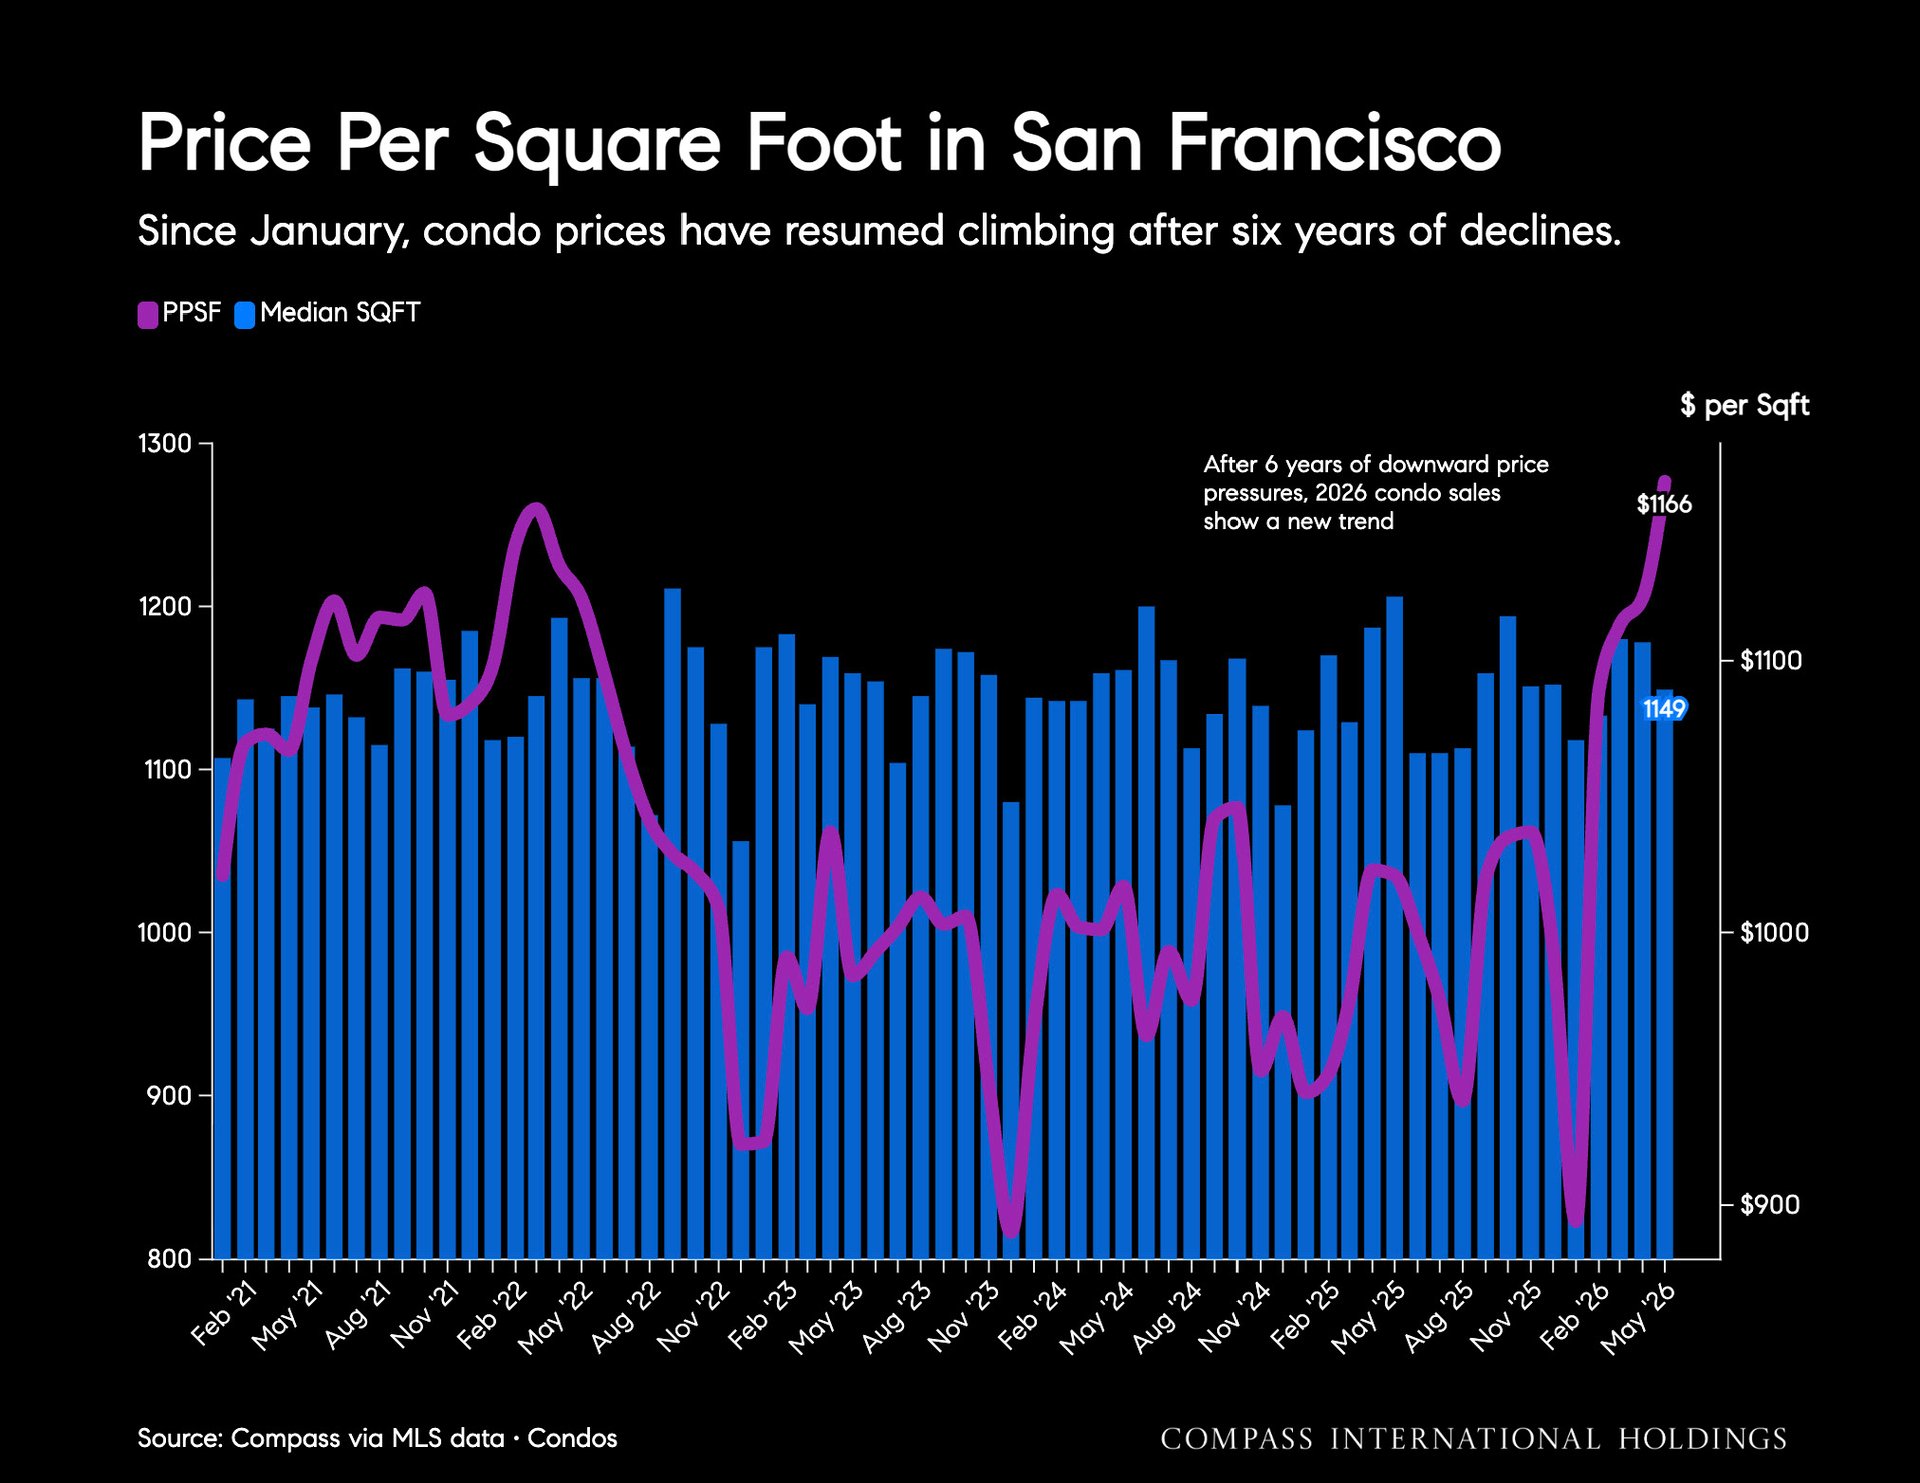
Chart of San Francisco condo prices and median size, with price per square foot rising to $1,166 in May 2026.


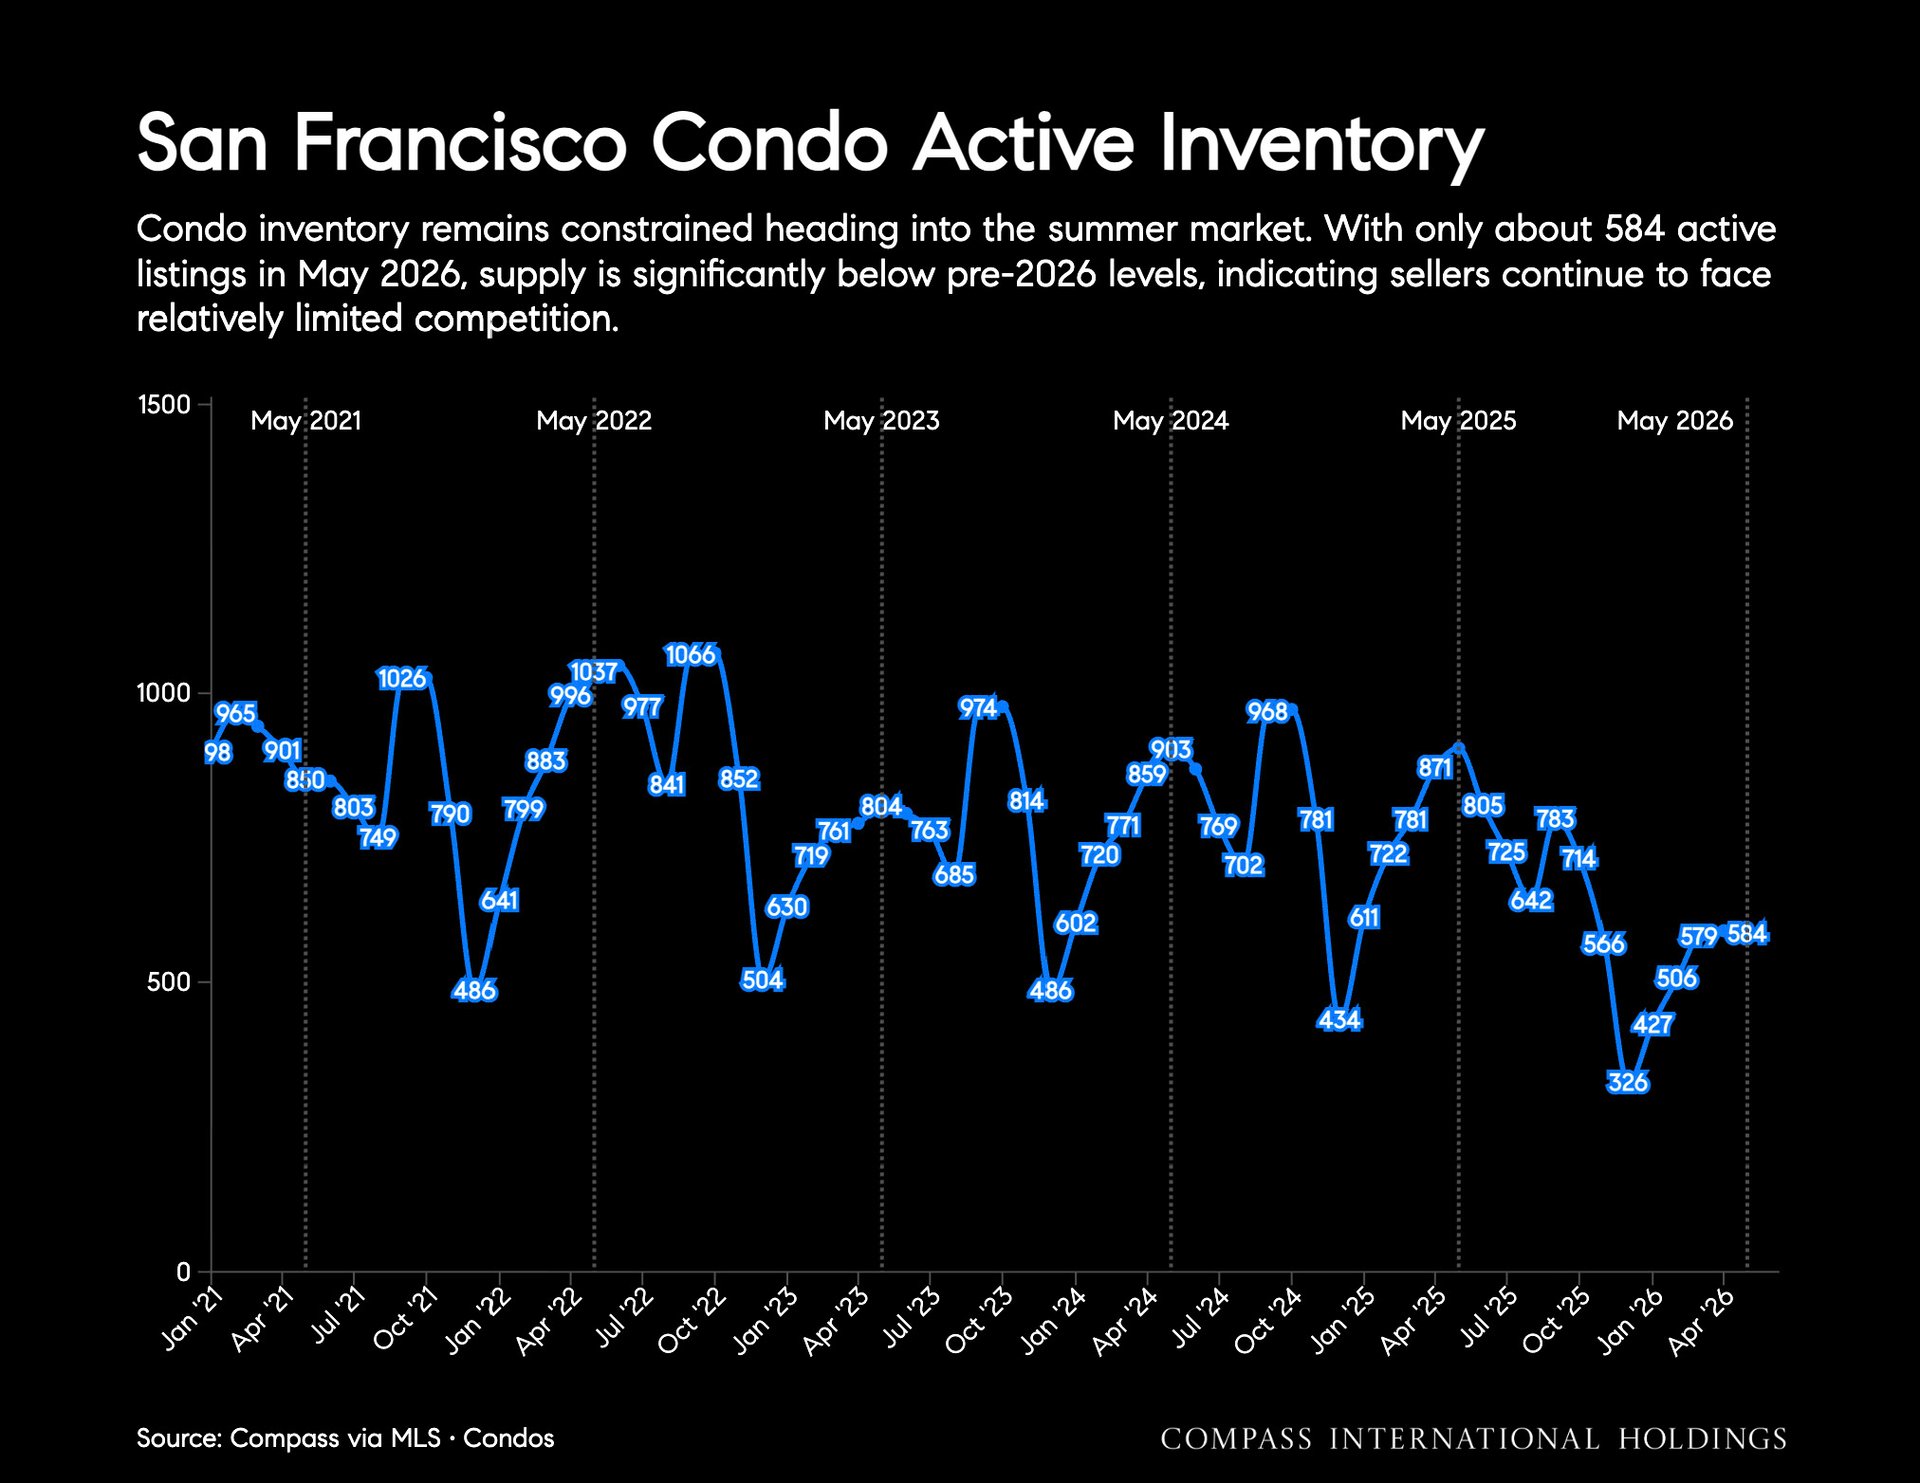
Line chart of San Francisco condo inventory, ending at 584 active listings in May 2026.


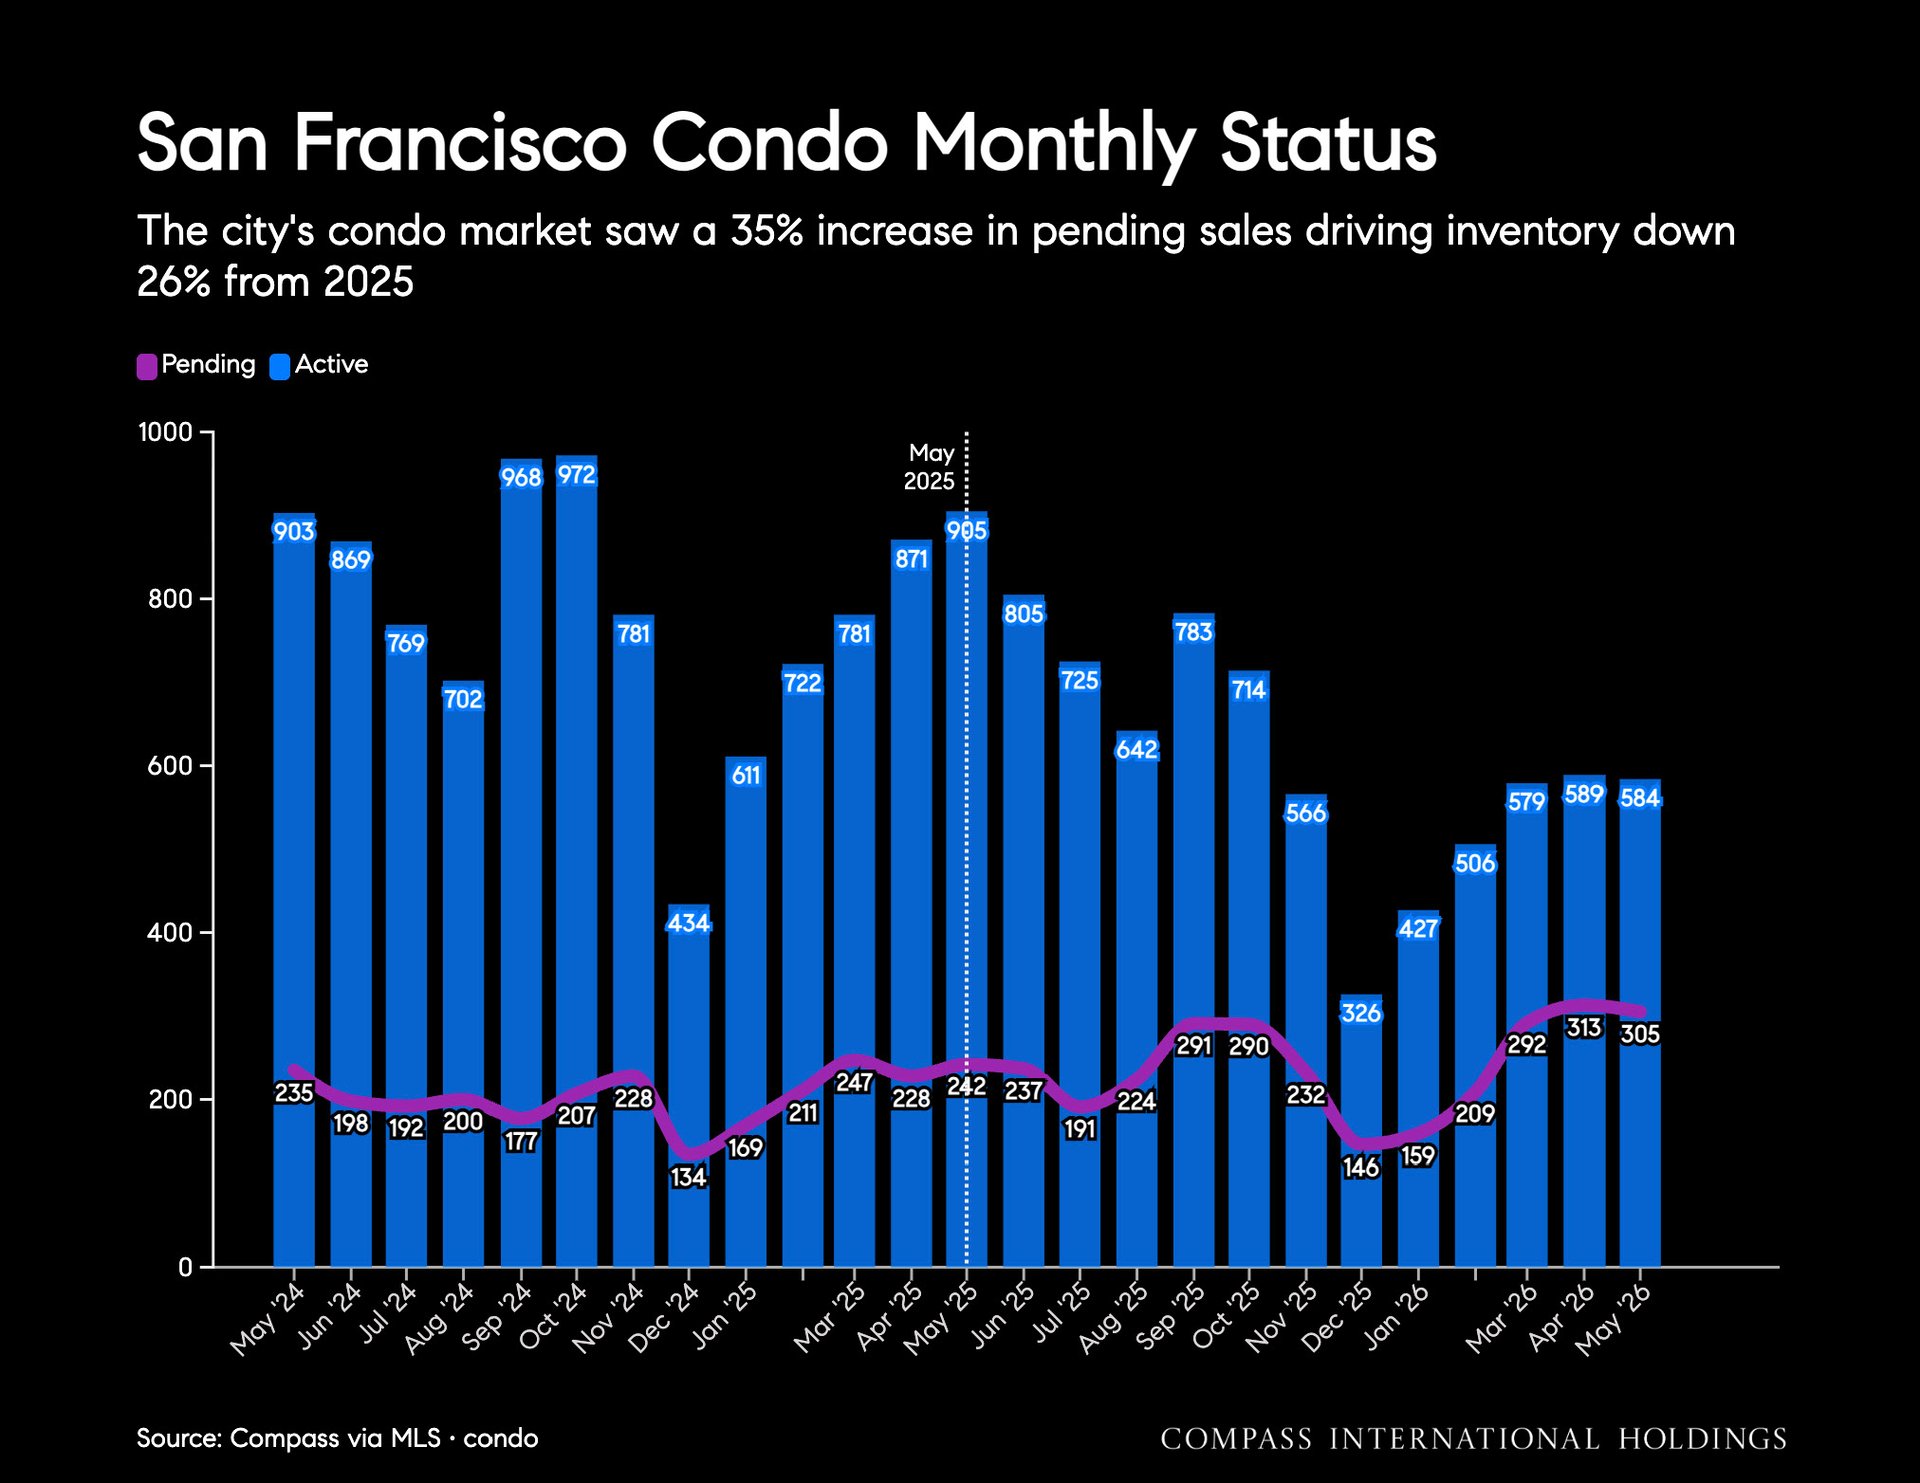
San Francisco condo market chart comparing monthly pending sales and active listings from May 2024 to May 2026.


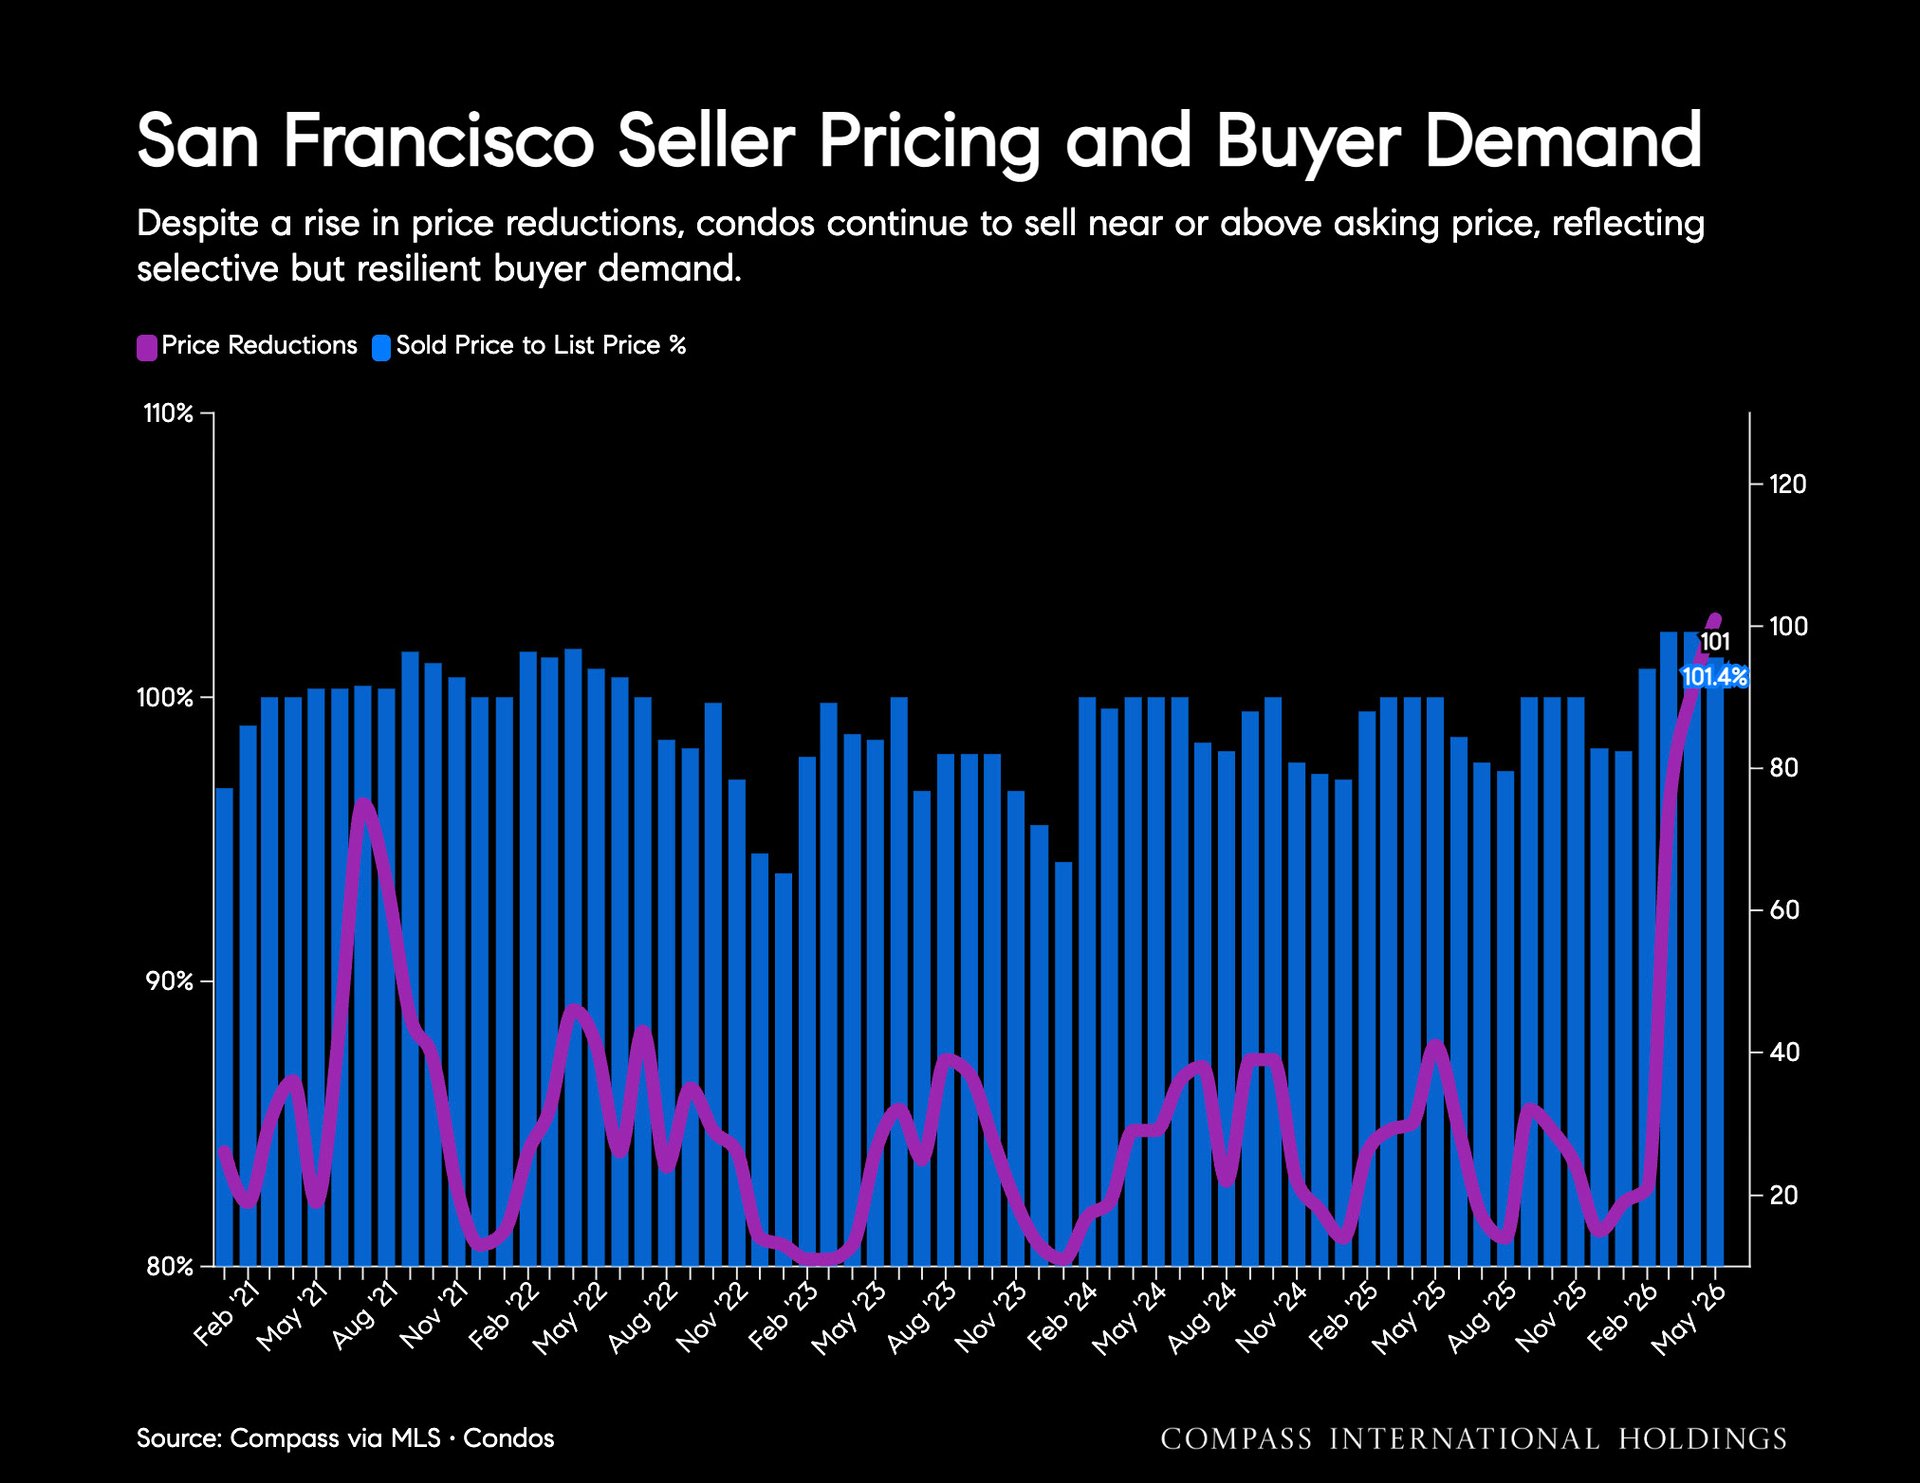
San Francisco condo market chart comparing price reductions and sold-to-list price percentages from 2021 to 2026.


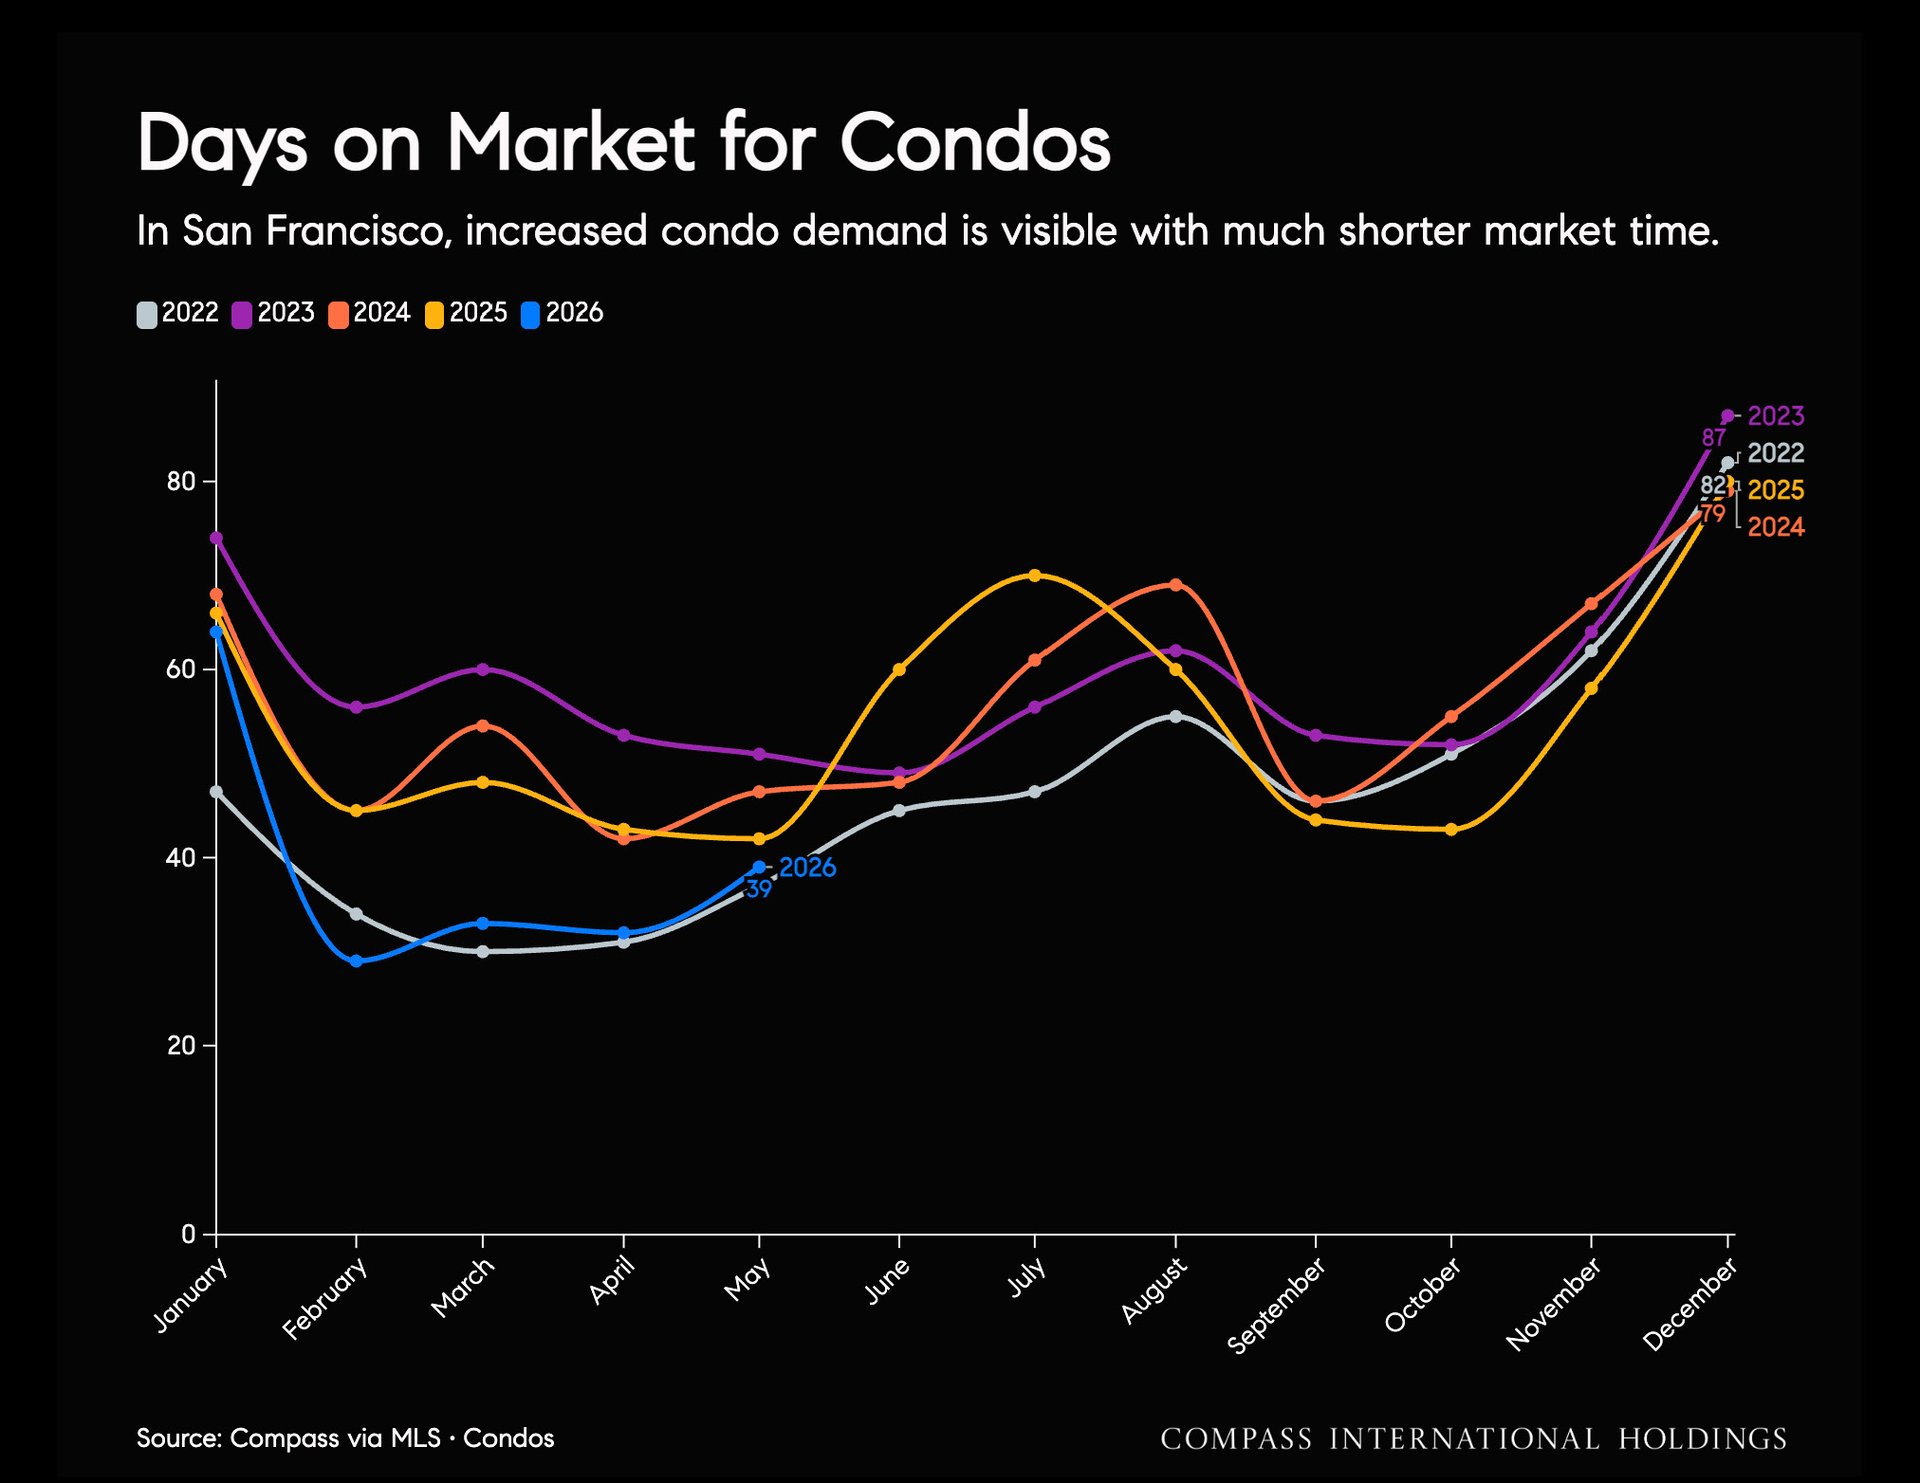
Line chart comparing monthly San Francisco condo days on market from 2022 to 2026; 2026 reaches 39 days in May.


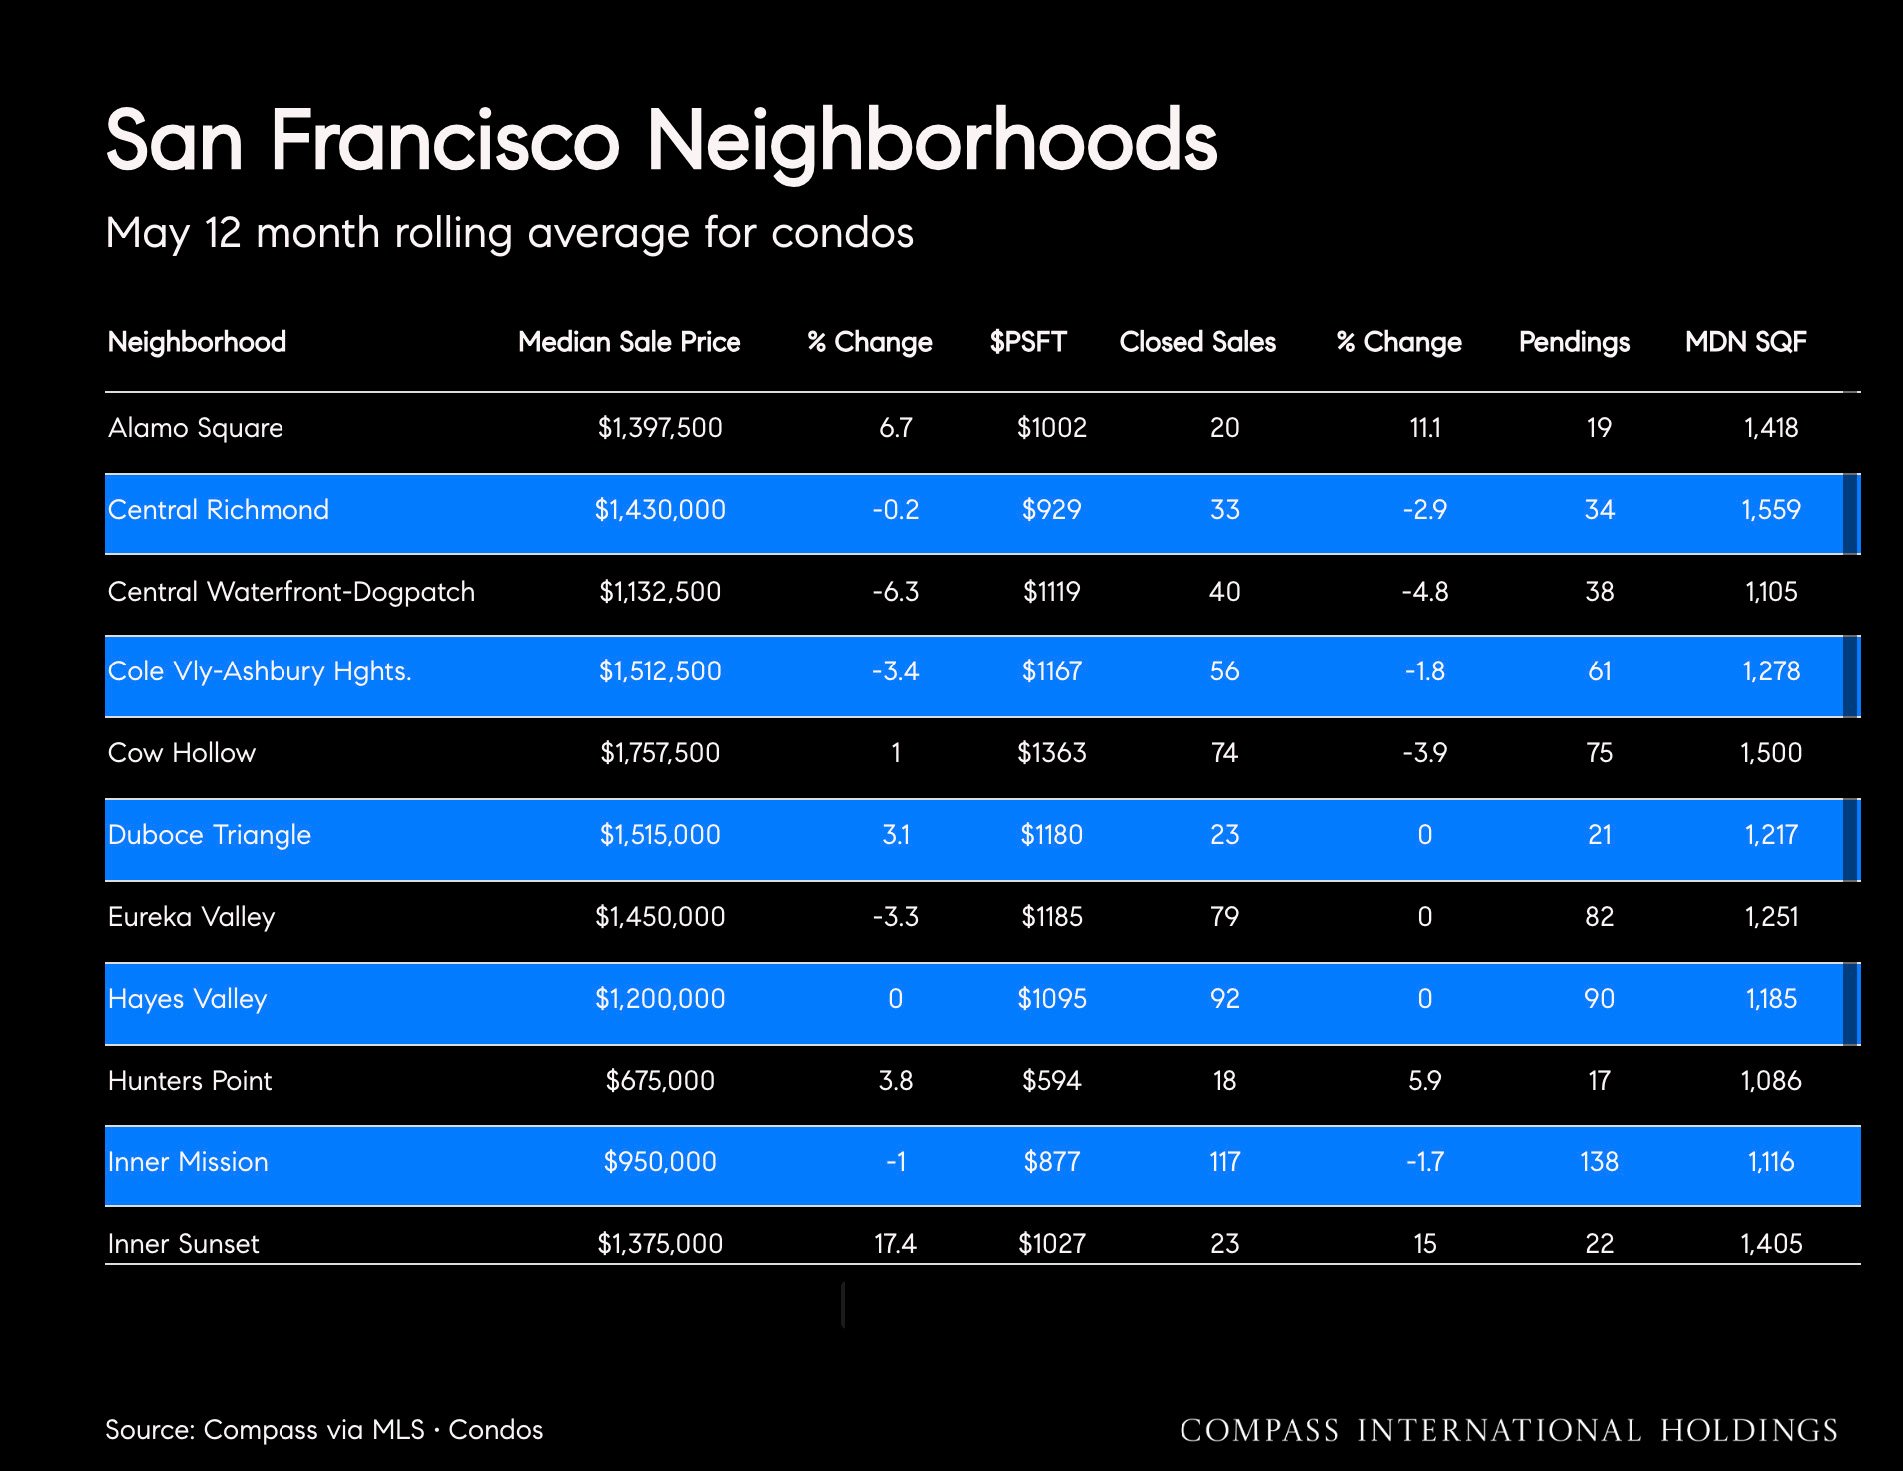
San Francisco condo market table showing May rolling averages by neighborhood, including sale prices, sales, pendings, and square footage.


Work With Us

We pride ourselves in providing personalized solutions that bring our clients closer to their dream properties and enhance their long-term wealth.
Contact Us

Follow Us On Instagram