Blog

San Francisco 2025 June Market Update

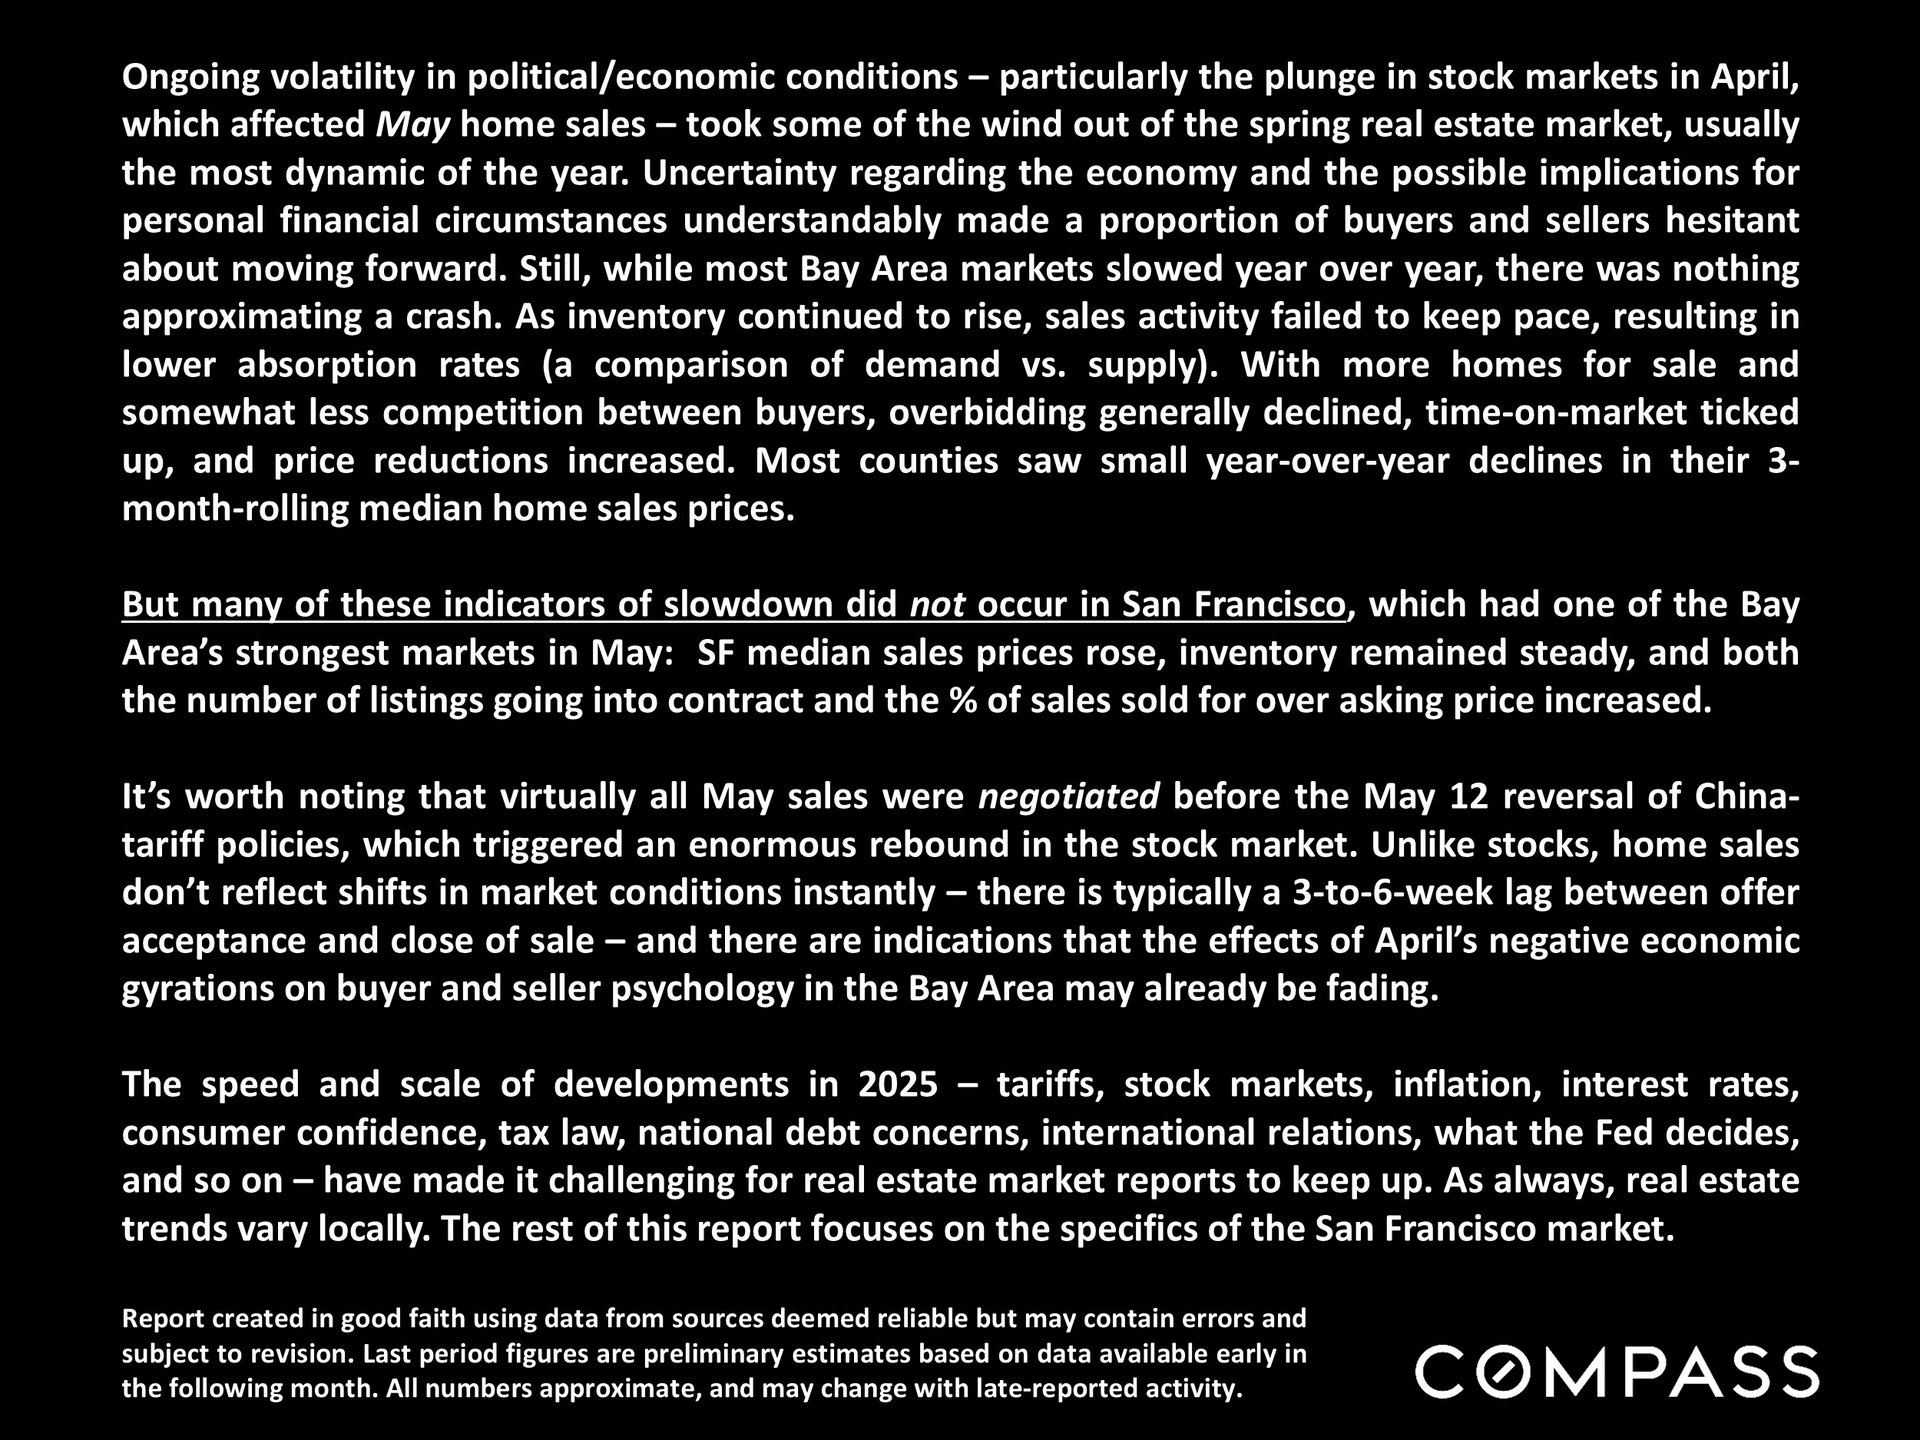
Ongoing volatility in political/economic conditions – particularly the plunge in stock markets in April, which affected May home sales – took some of the wind out of the spring real estate market, usually the most dynamic of the year. Uncertainty regarding the economy and the possible implications for personal financial circumstances understandably made a proportion of buyers and sellers hesitant to move forward. Still, while most Bay Area markets slowed year over year, there was nothing approximating a crash. As inventory continued to rise, sales activity failed to keep pace, resulting in lower absorption rates (a comparison of demand vs. supply). With more homes for sale and somewhat less competition between buyers, overbidding typically declined, time-on-market ticked up, and price reductions increased. Most counties saw small year-over-year declines in their 3-month-rolling median home sales prices, but many homes still sold quickly for well over asking price. It’s worth noting that virtually all May sales were negotiated before the early May reversal of China-tariff policies, which triggered an enormous rebound in the stock market. Unlike stocks, home sales don’t reflect shifts in market conditions instantly – there is typically a 3-to-6-week lag between offer acceptance and close of sale – and there are indications that the effects of April’s negative economic gyrations on buyer and seller psychology may already be fading. The speed and scale of developments in 2025 – tariffs, stock markets, inflation, interest rates, consumer confidence, tax law, national debt concerns, international relations, what the Fed decides, and so on – have made it challenging for real estate market reports to keep up. As always, real estate trends vary locally. The rest of this report focuses on the specifics of our regional market.

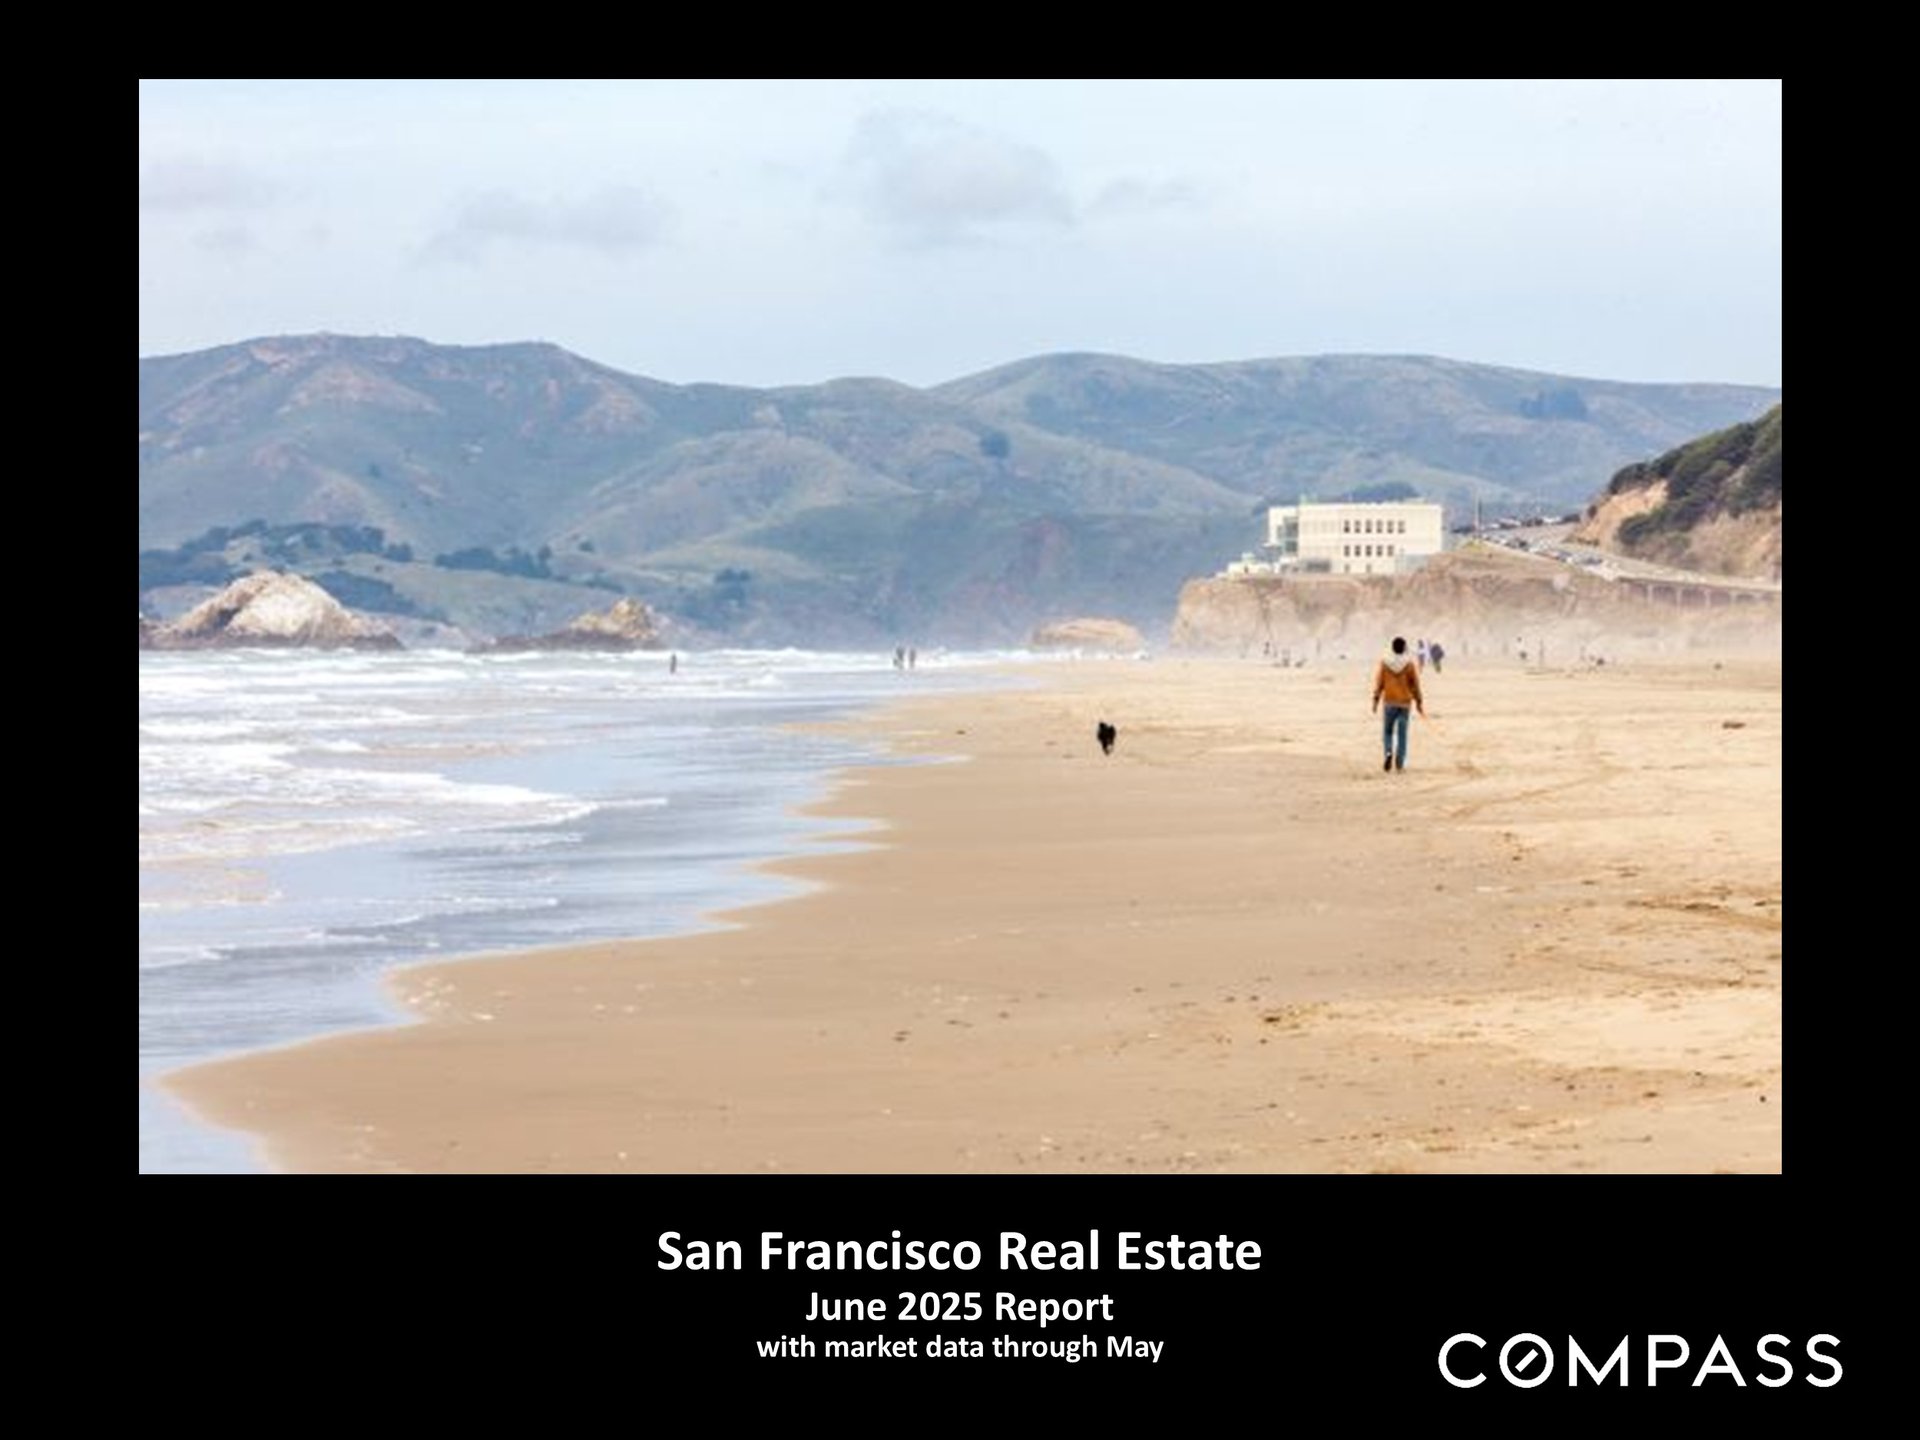
San Francisco Real Estate June 2025 Report, with market data through May.


San Francisco June market update describing local home sales and broader Bay Area real estate trends.


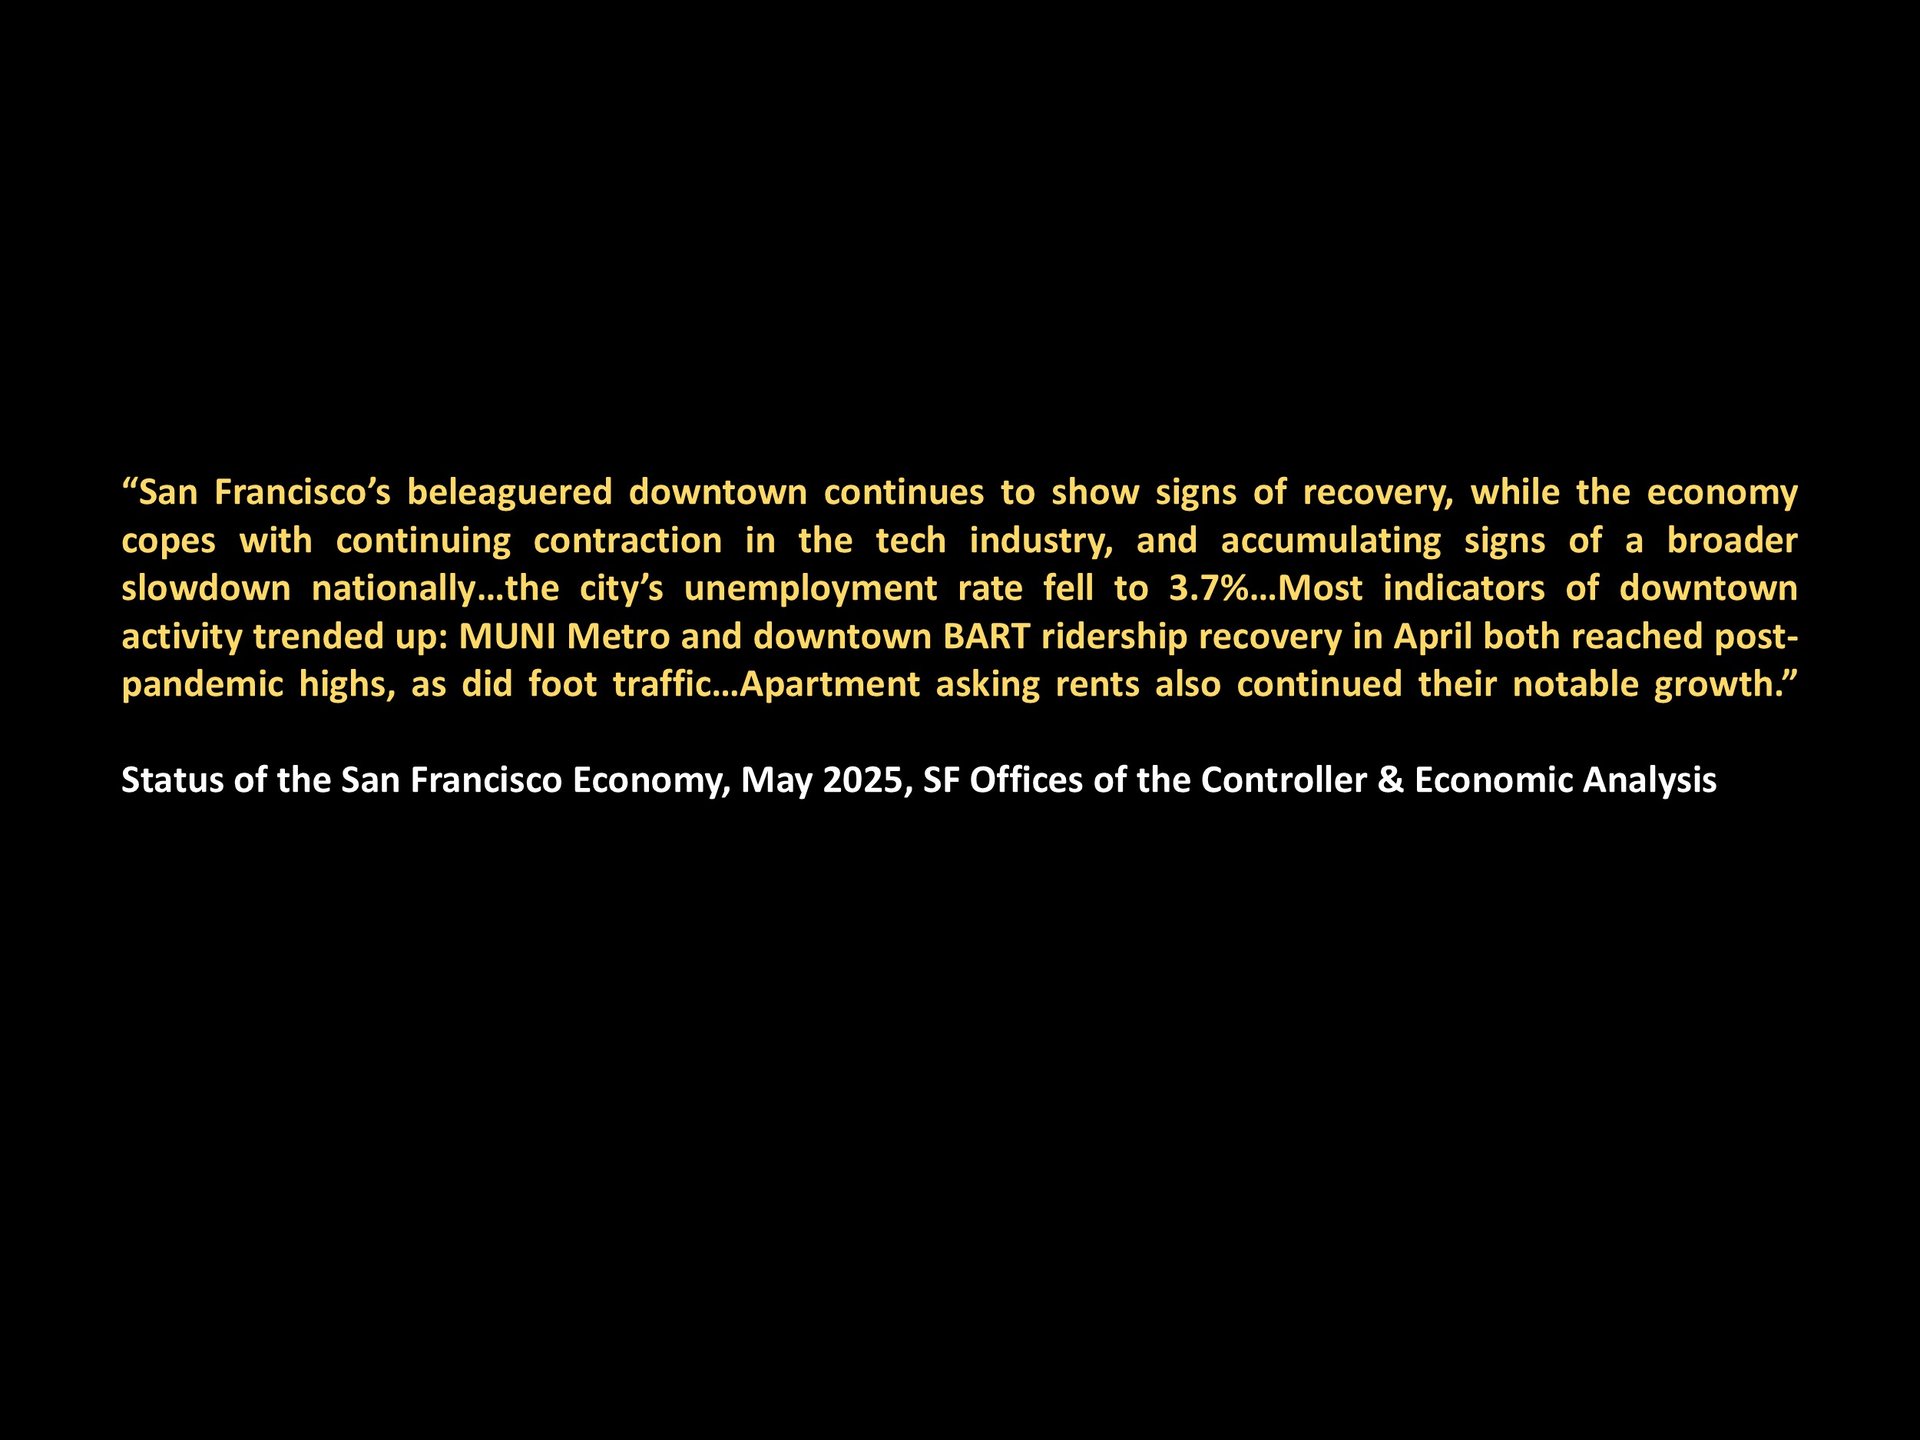
Quote on San Francisco’s economic recovery, with May 2025 source attribution.


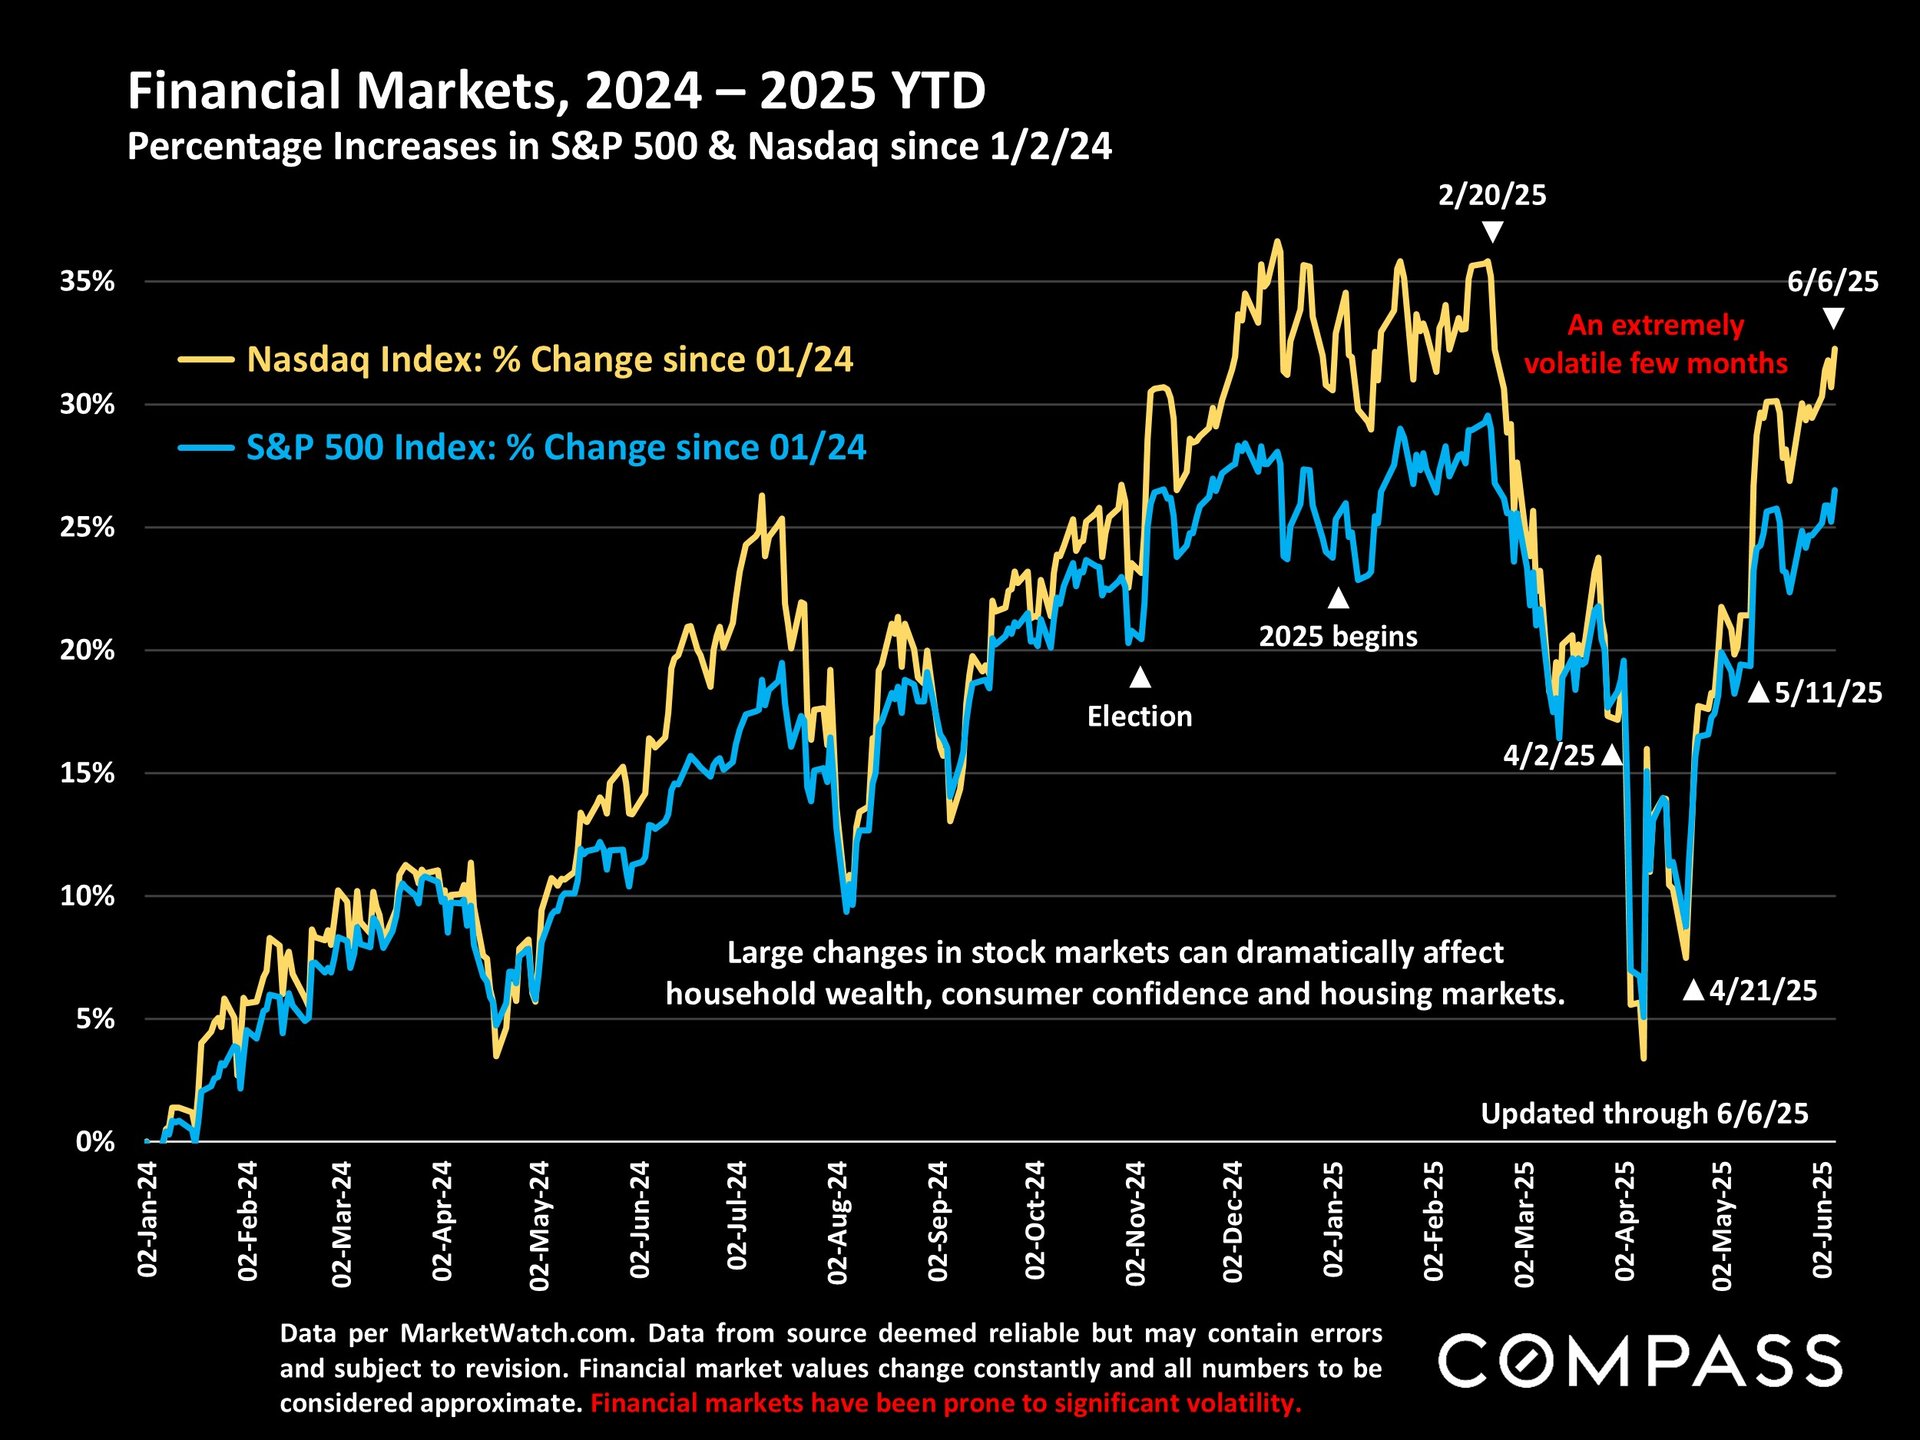
Chart comparing Nasdaq and S&P 500 gains from January 2024 through June 2025, including a sharp April decline and recovery.


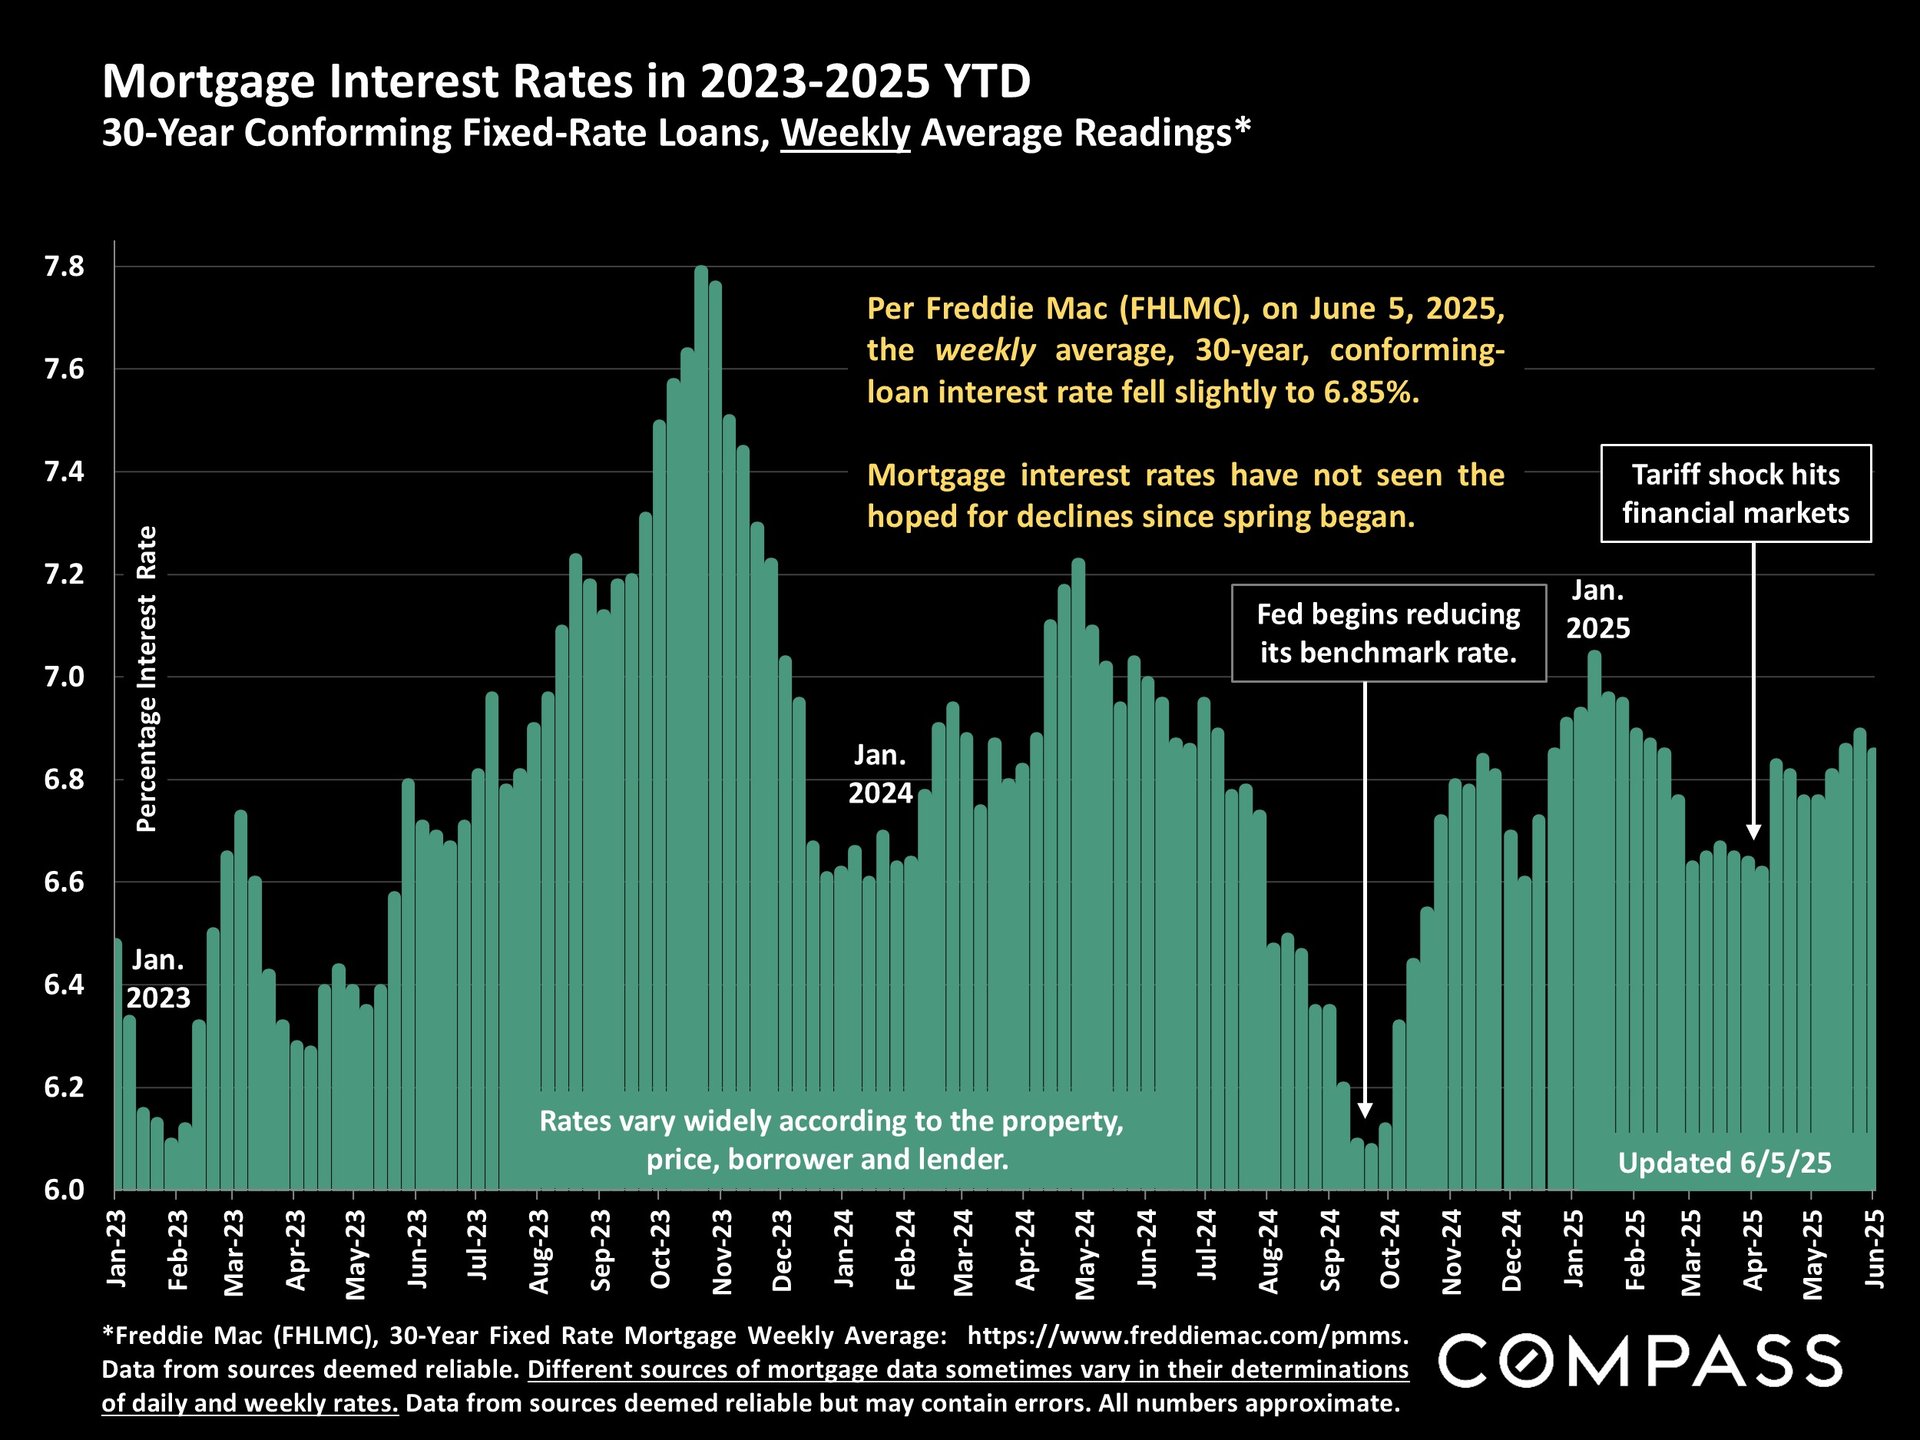
Chart of weekly 30-year mortgage rates from 2023 to June 2025, ending at 6.85%.


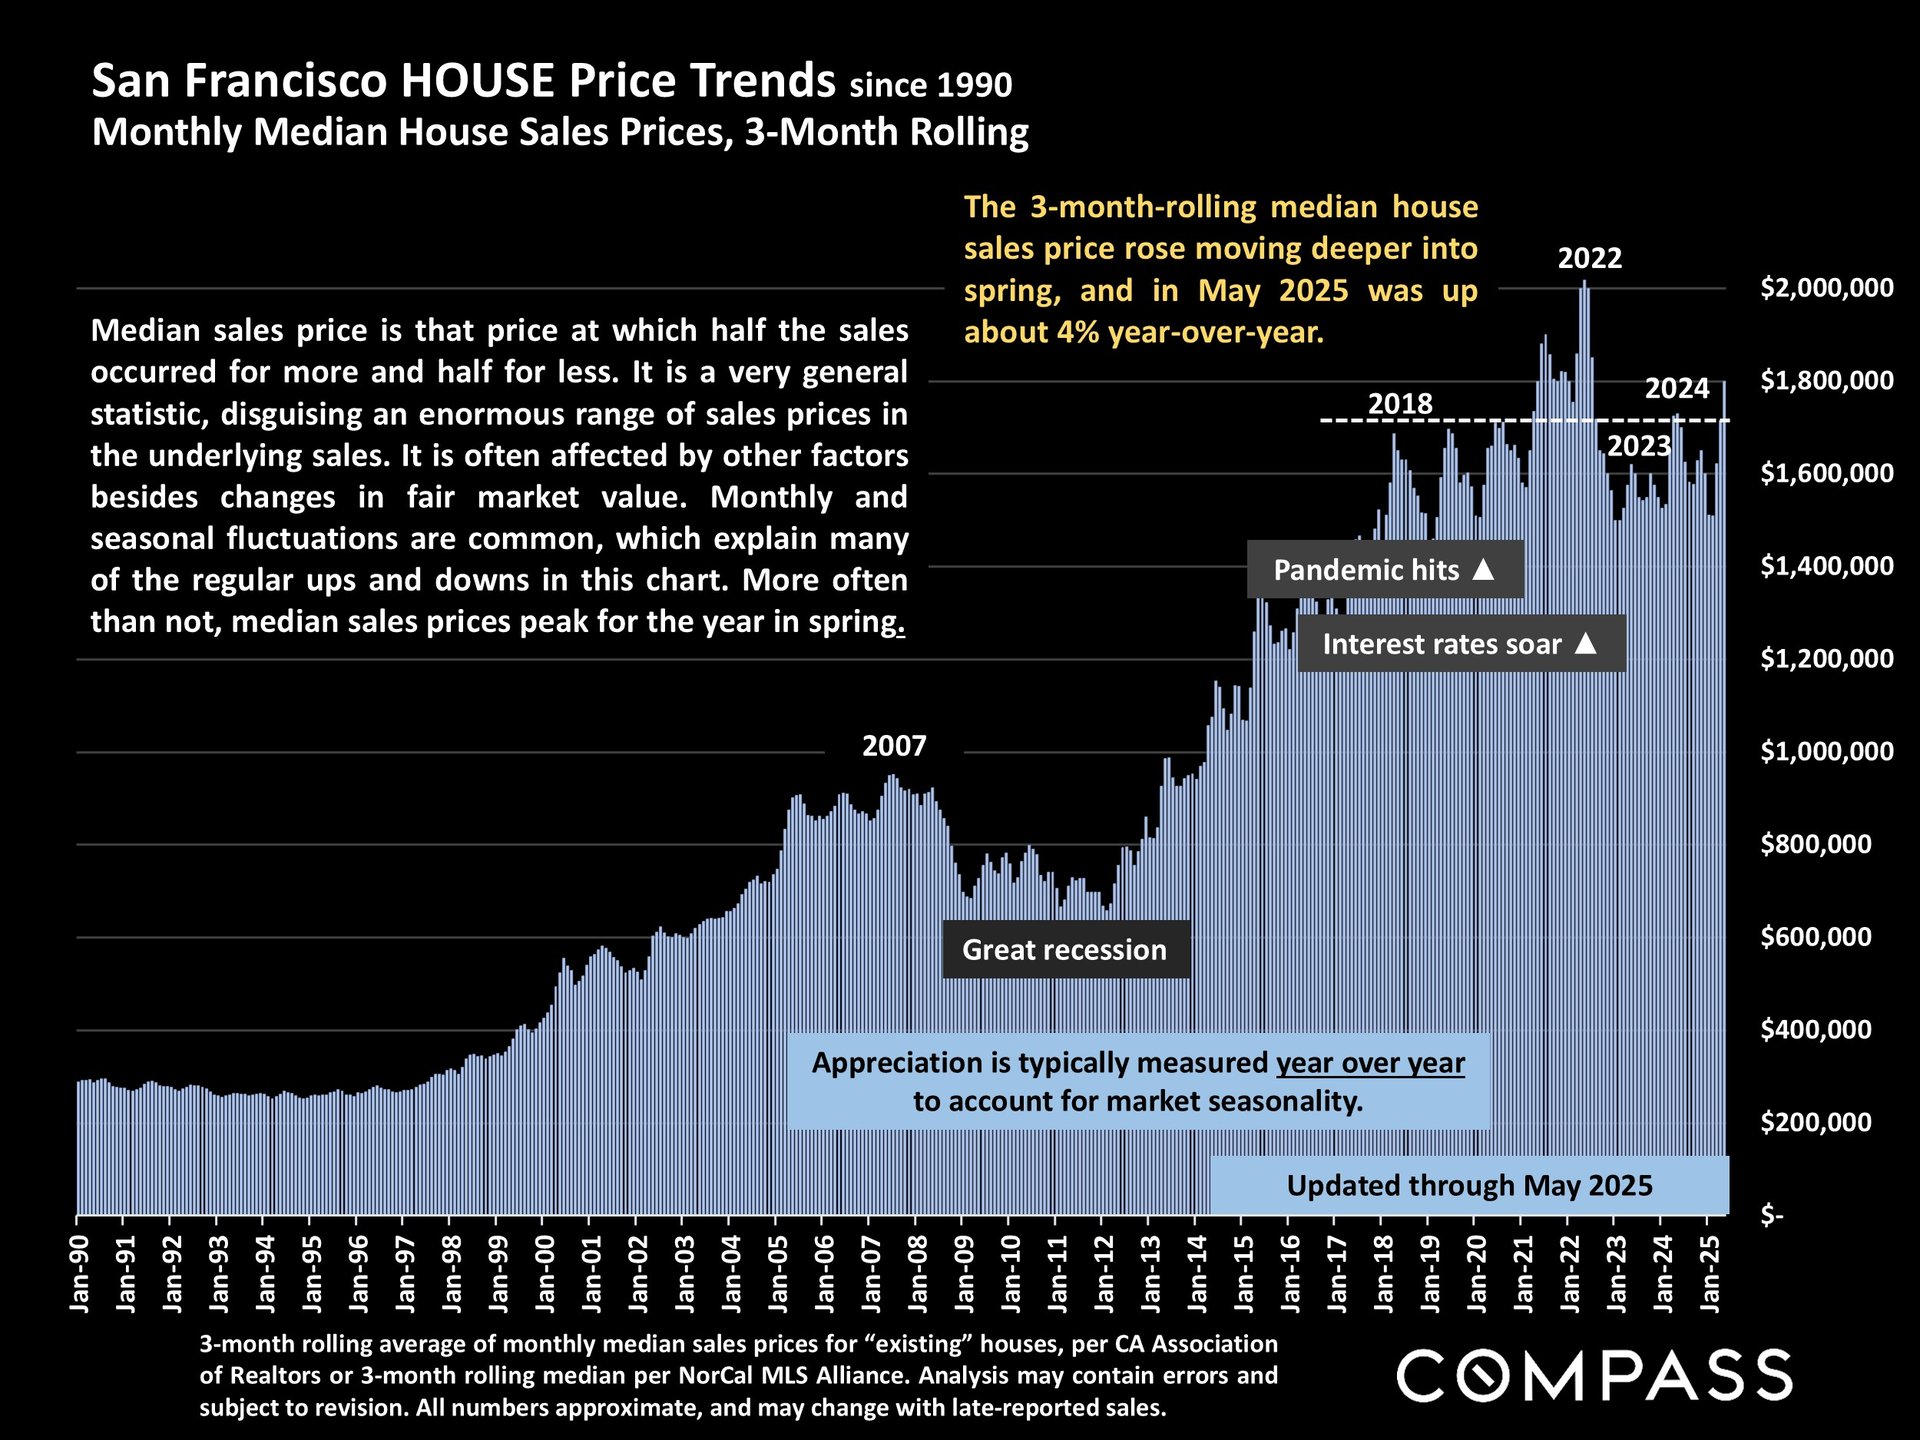
Chart of San Francisco median house prices from 1990 to May 2025, with a 2022 peak and recent fluctuations.


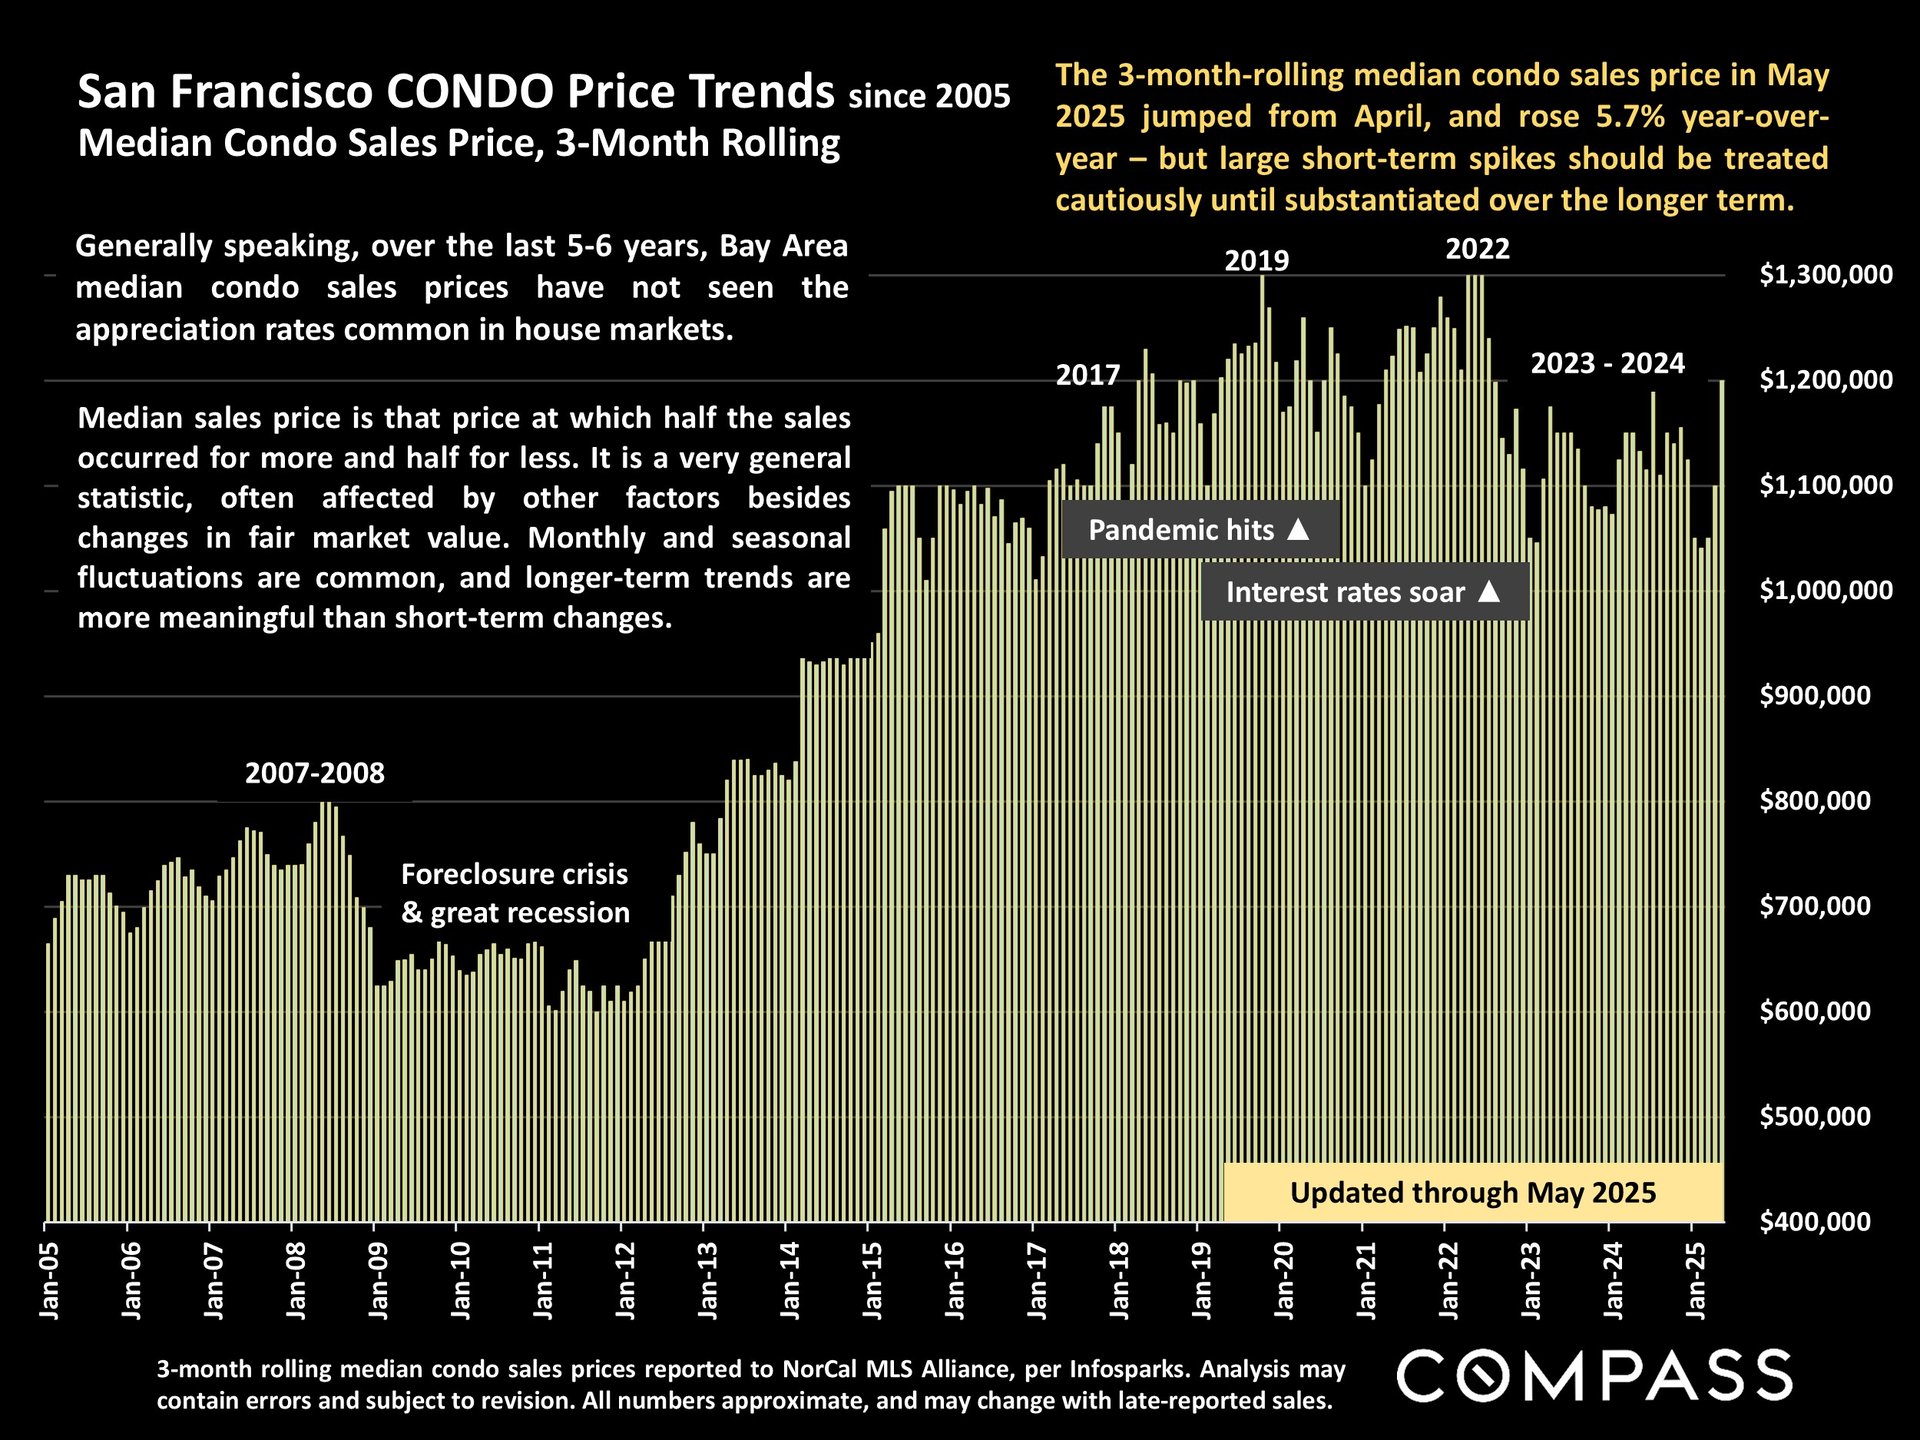
San Francisco condo price trends chart, with monthly median prices from 2005 to May 2025 and major market events annotated.


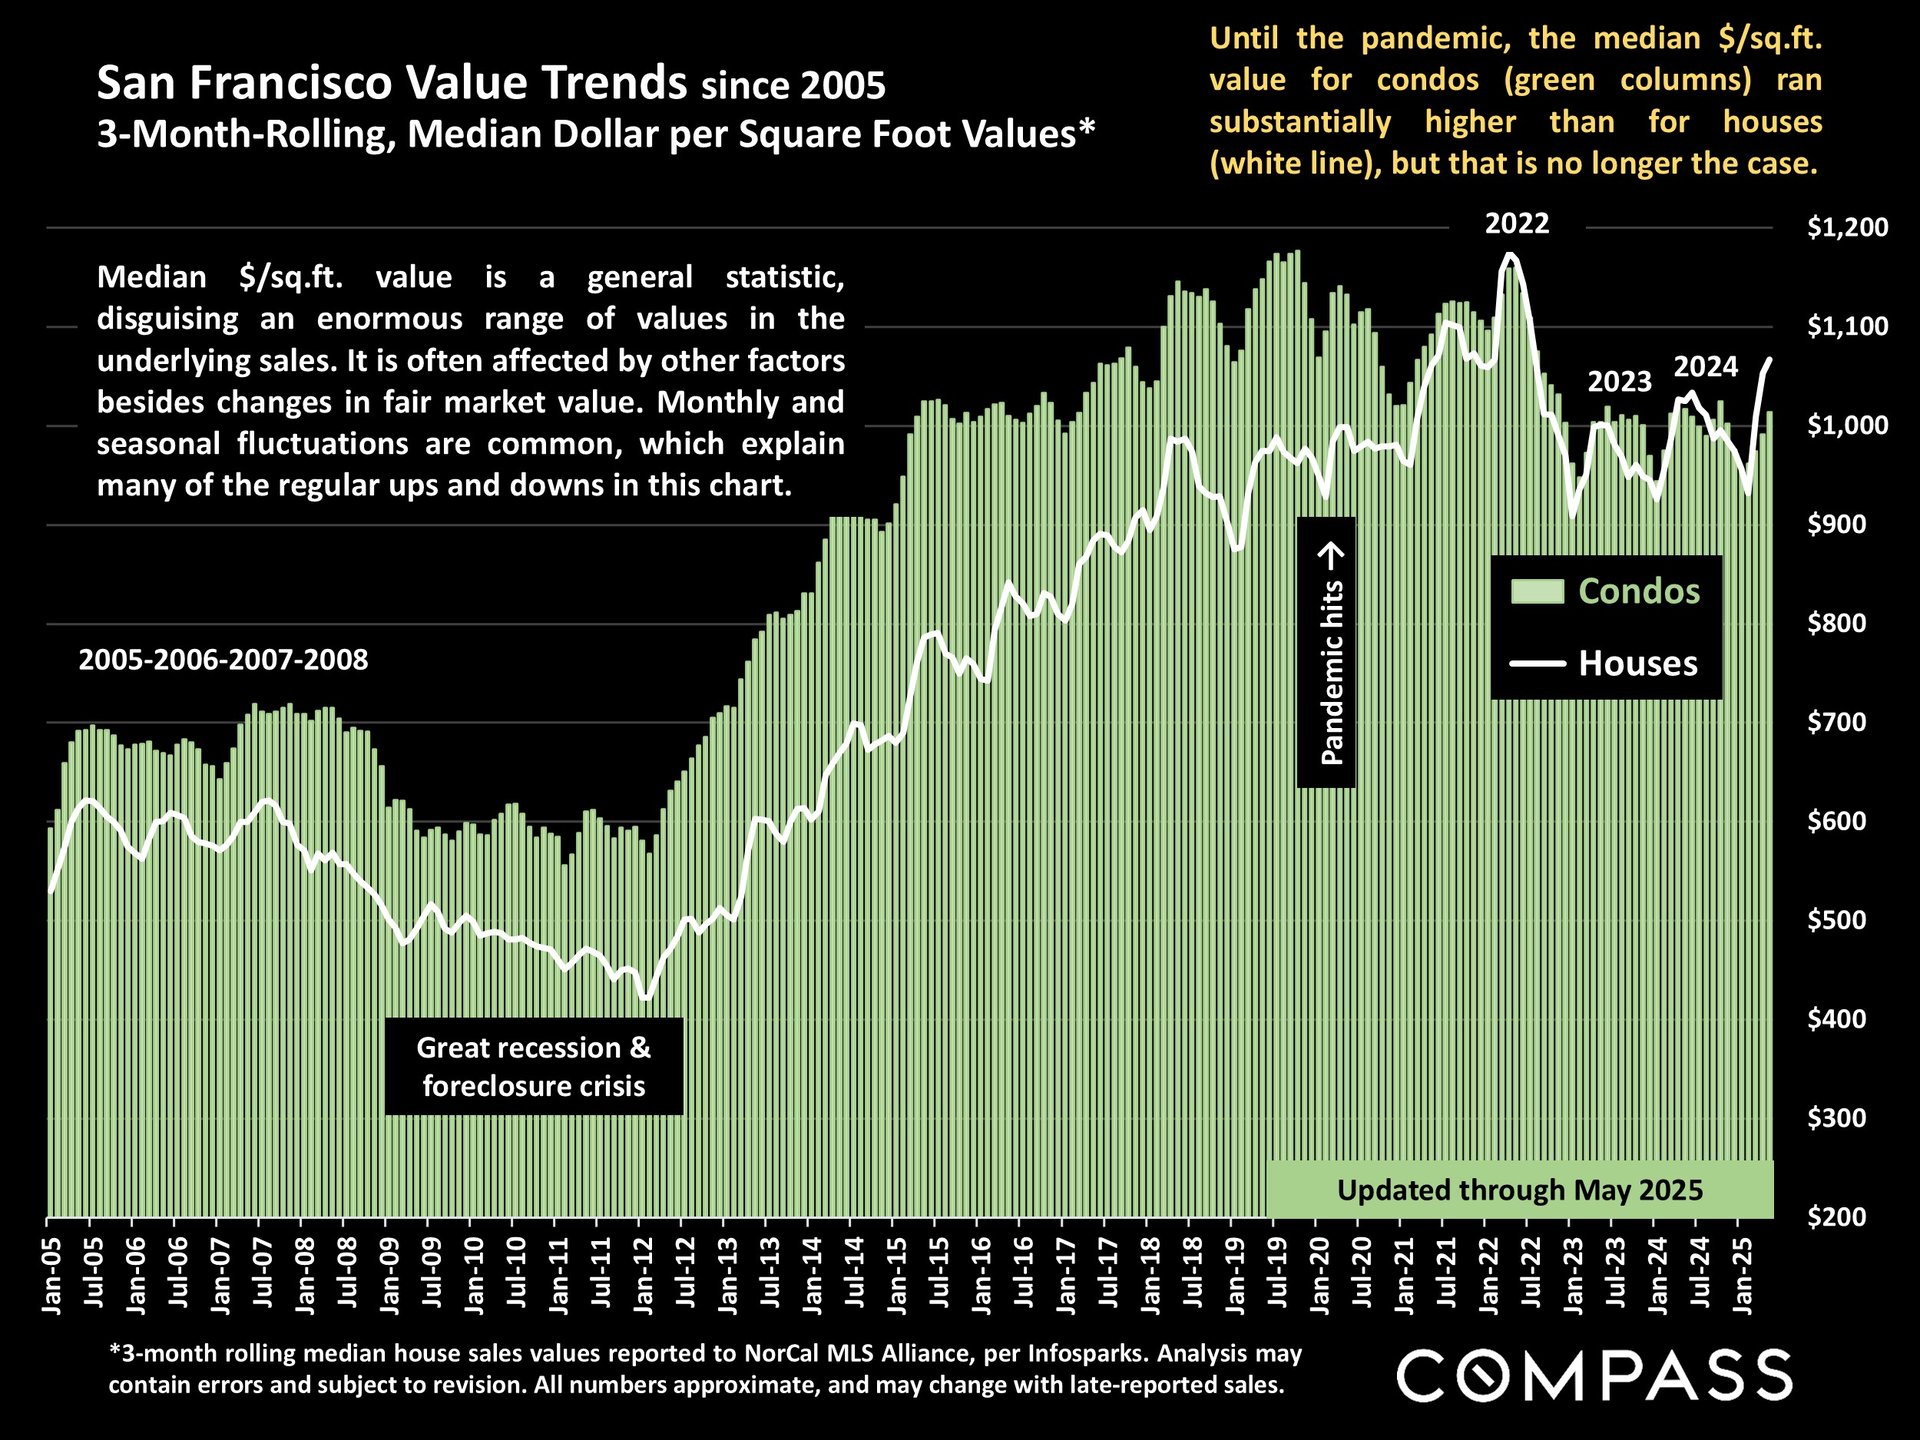
Chart comparing San Francisco median condo and house values per square foot from 2005 through May 2025.


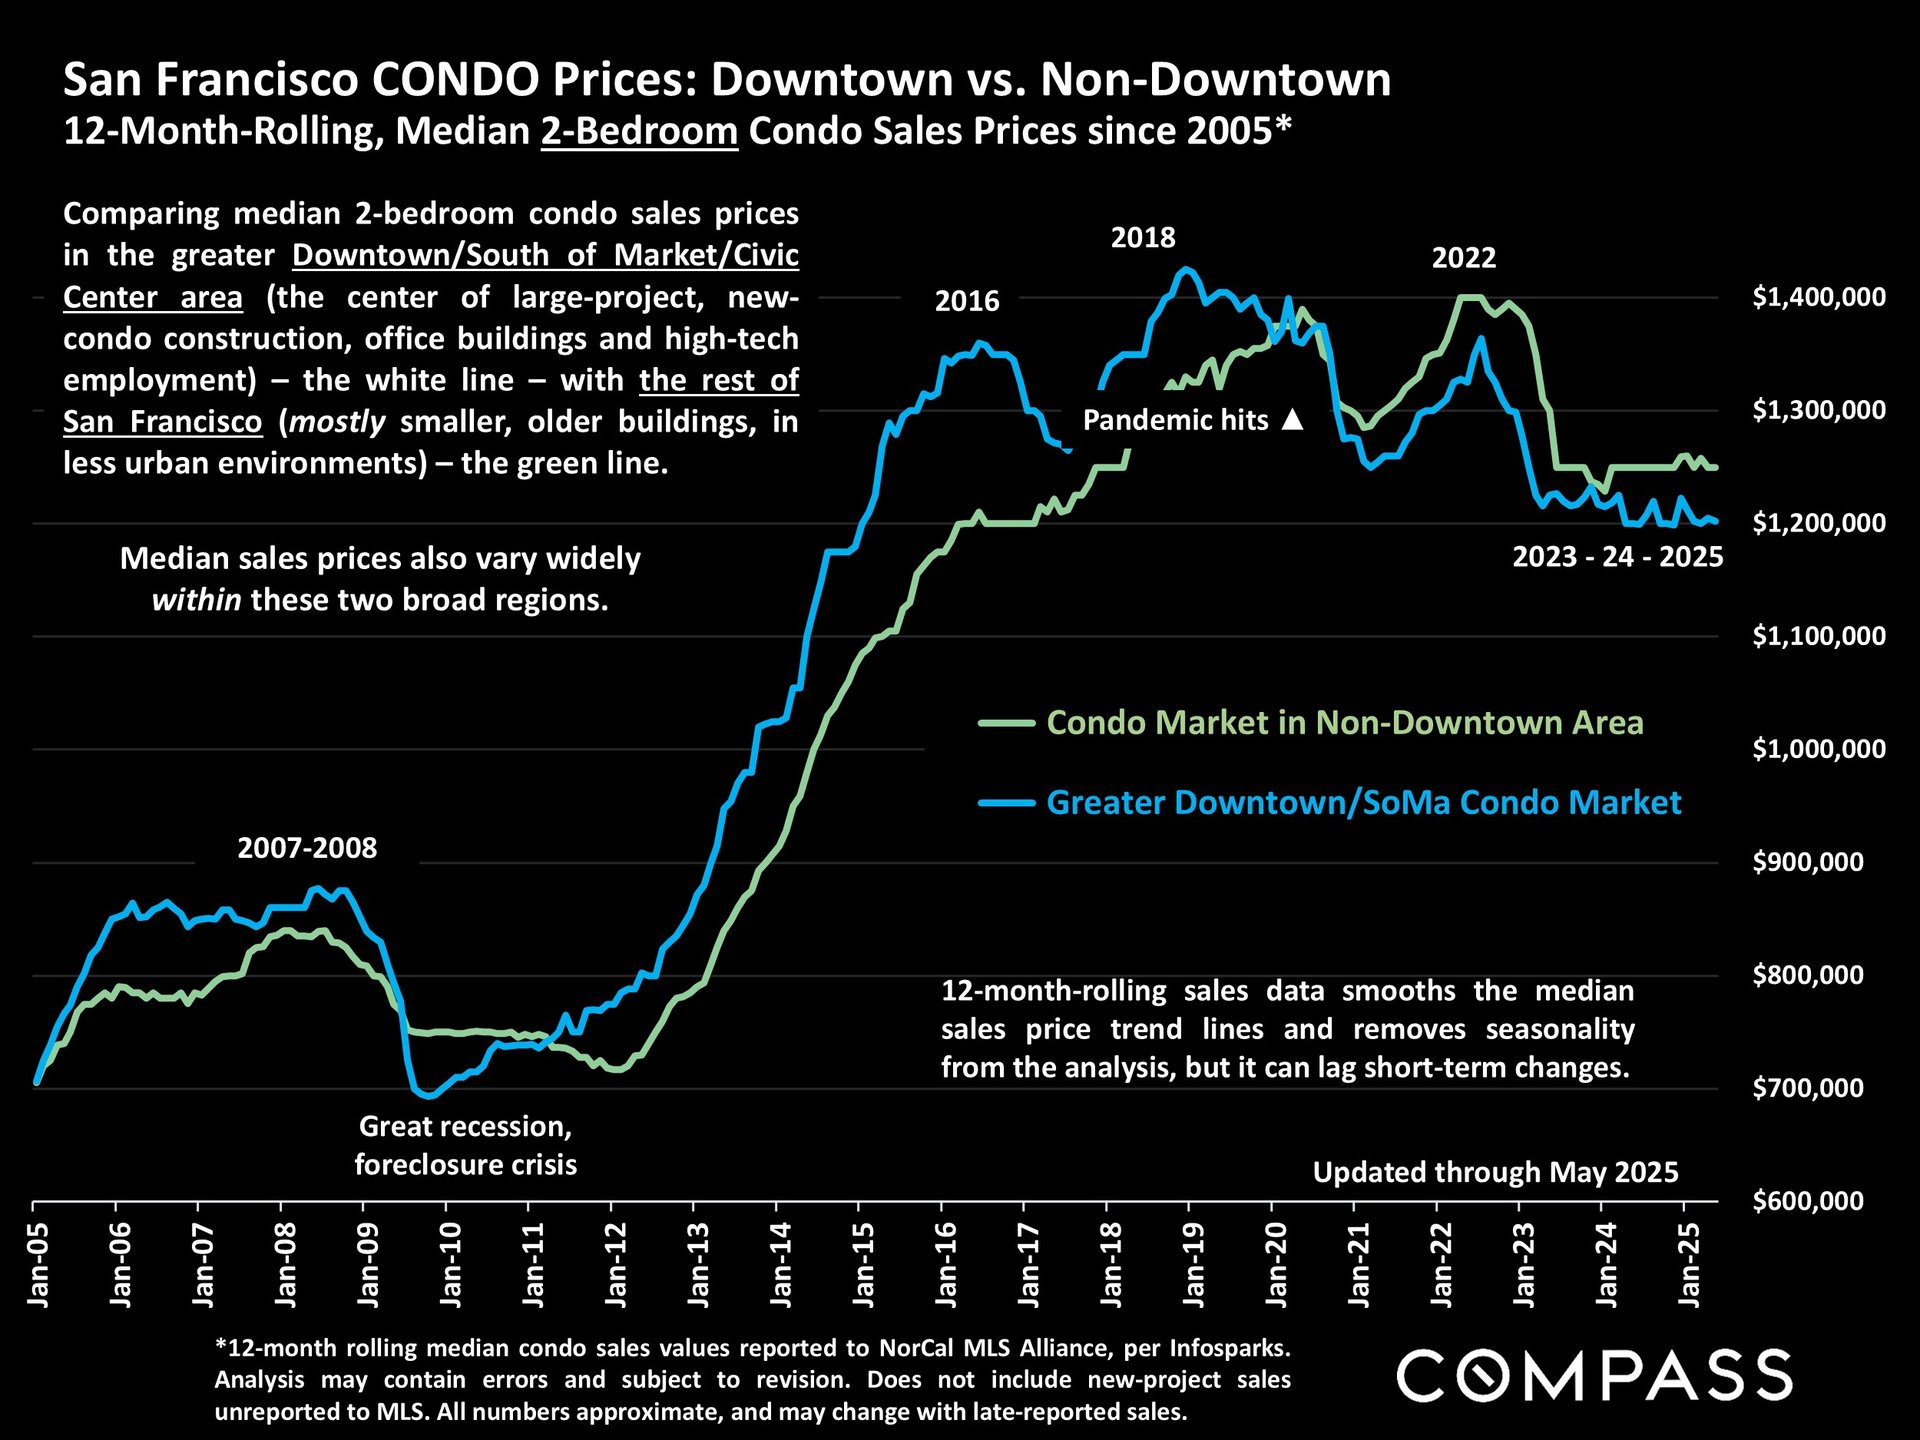
Chart comparing San Francisco two-bedroom condo median prices downtown and non-downtown, 2005–2025.


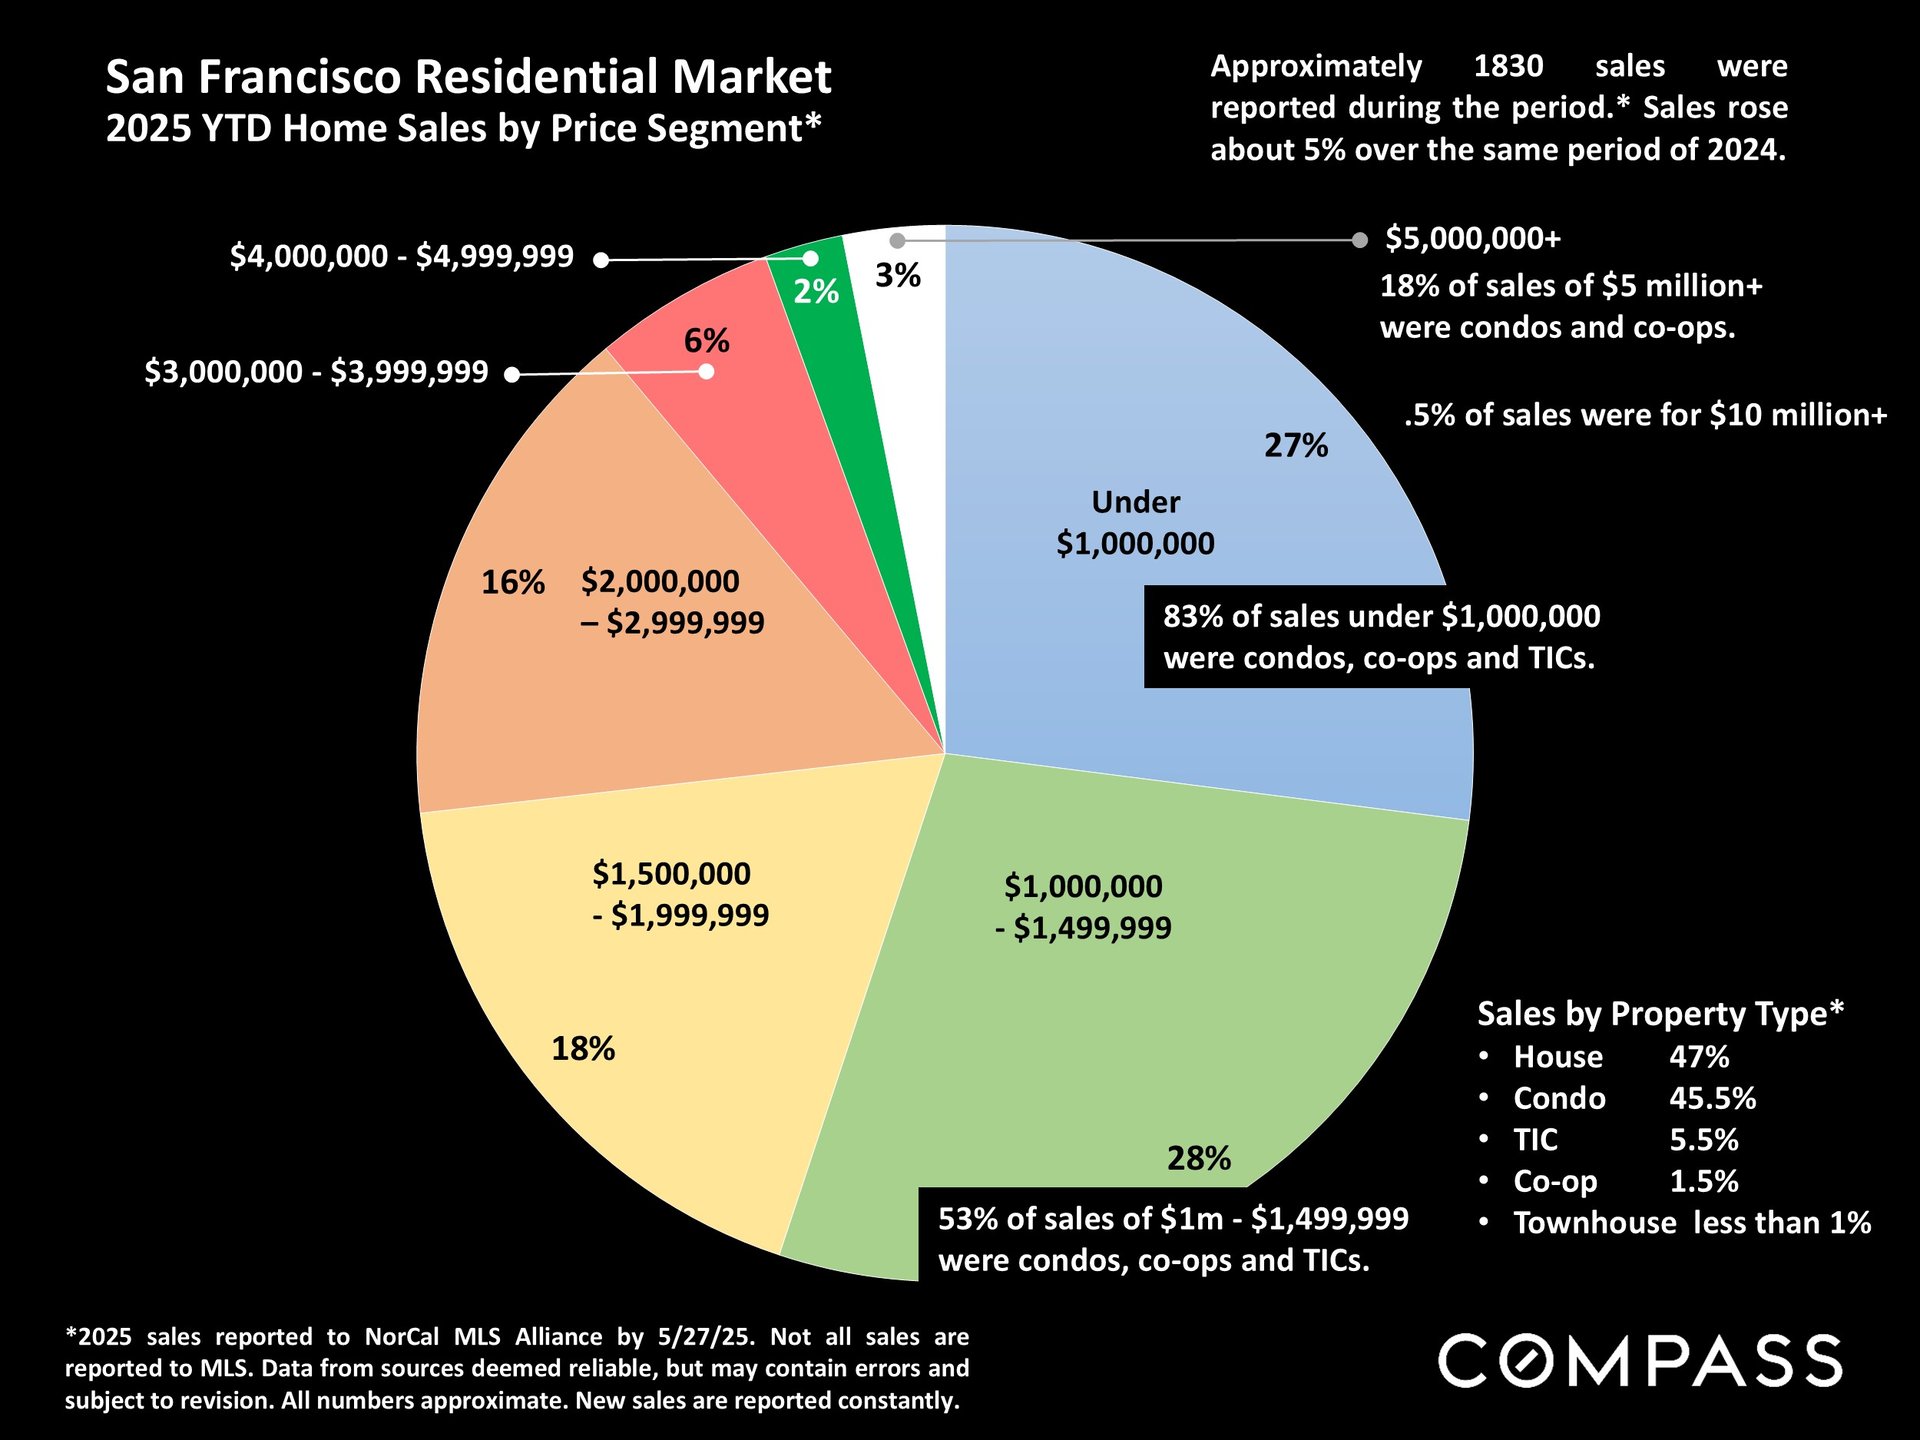
San Francisco 2025 home sales by price segment, shown in a pie chart with sales and property-type statistics.


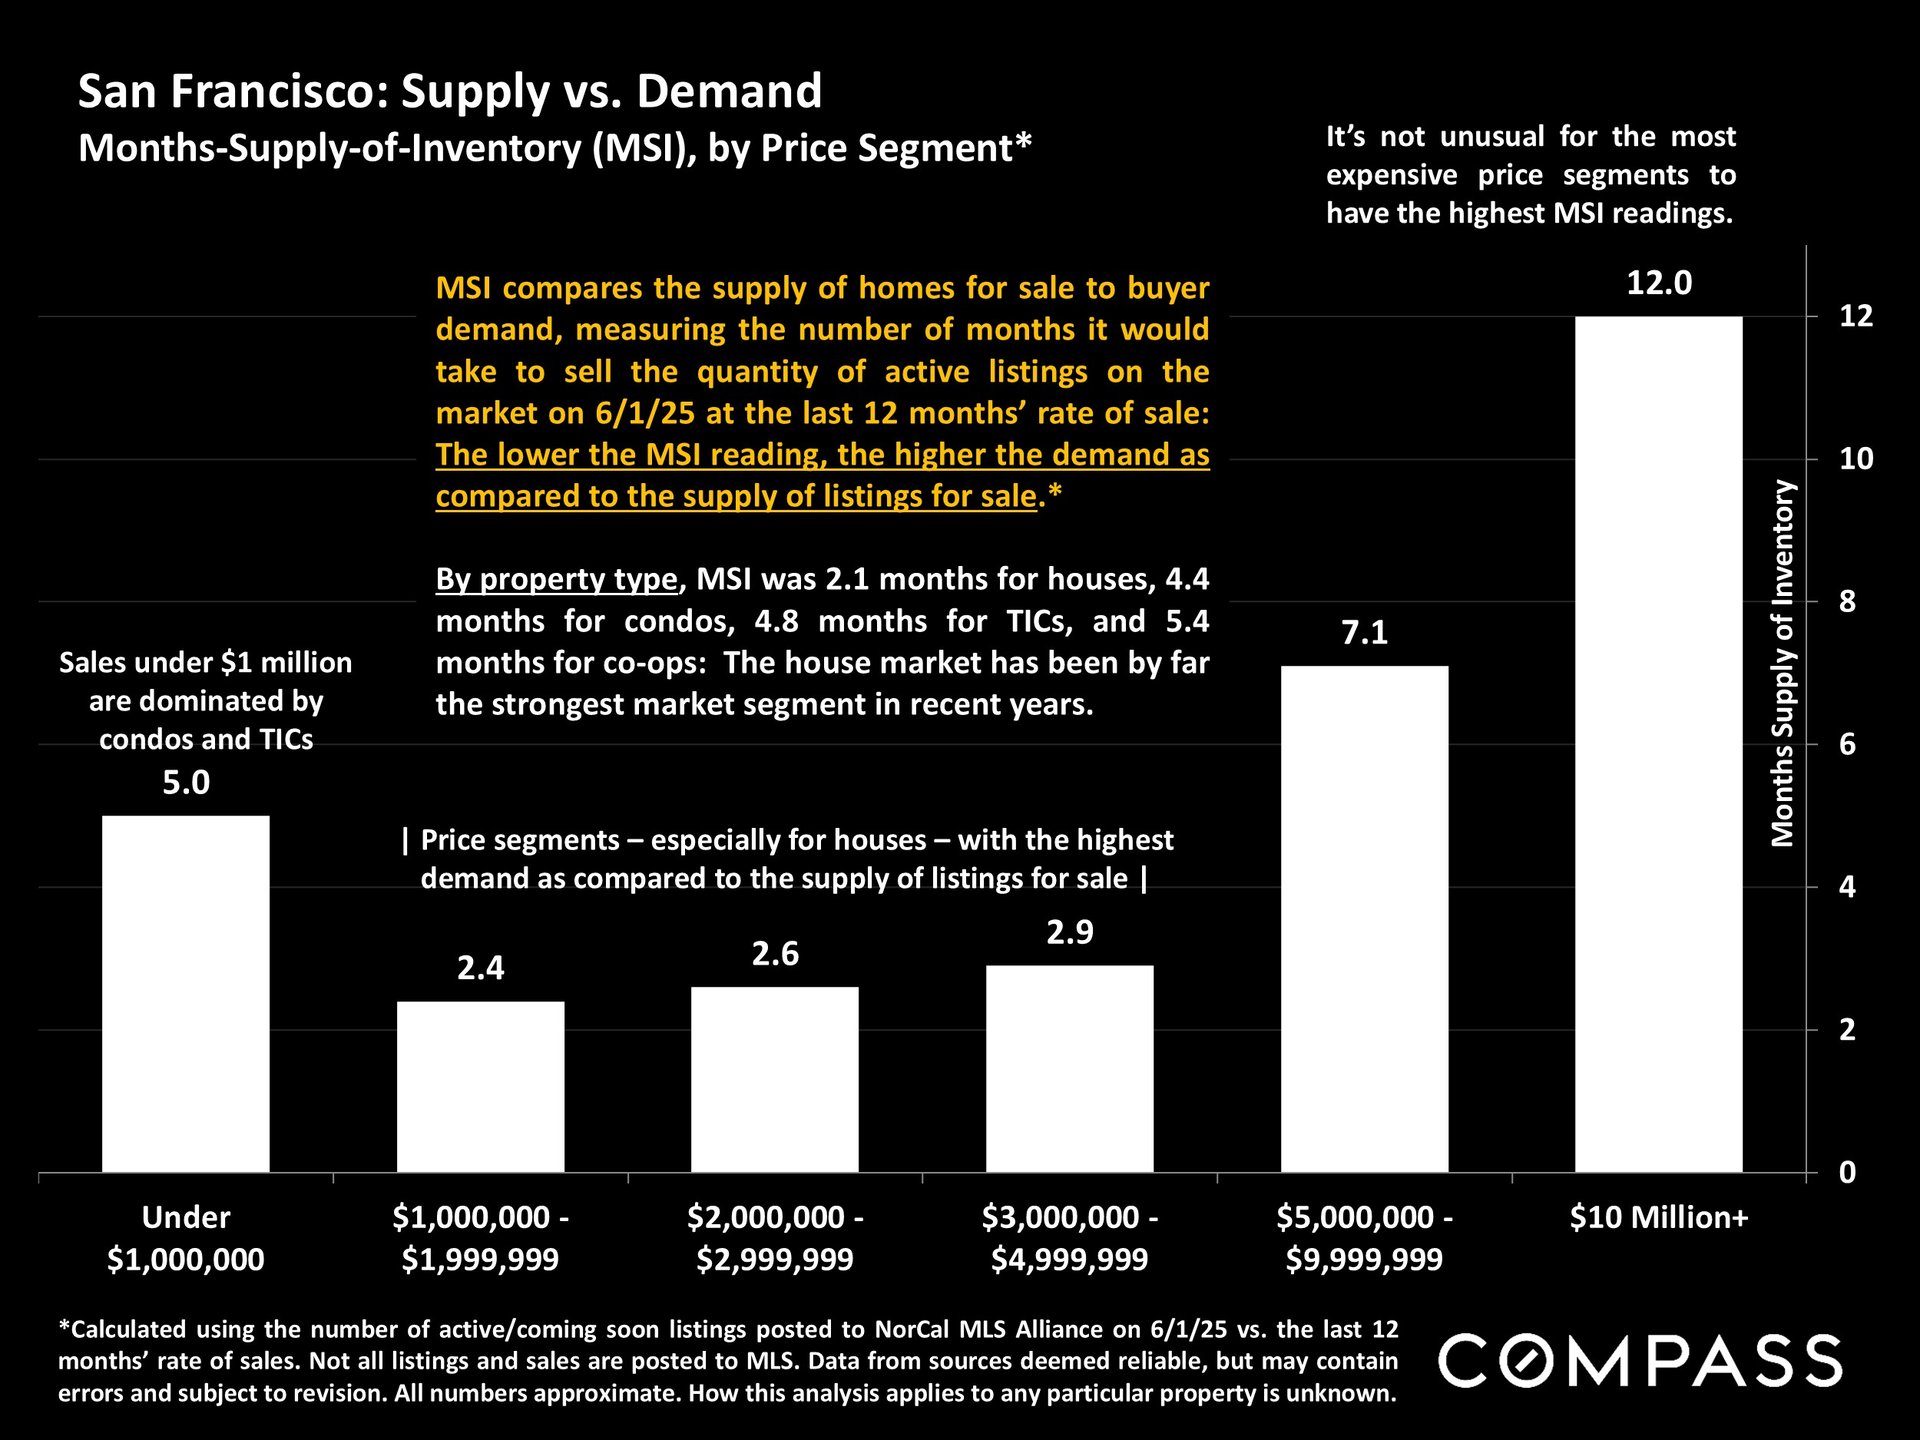
San Francisco inventory chart shows MSI rising from 2.4–2.9 in mid-price ranges to 12.0 above $10 million.


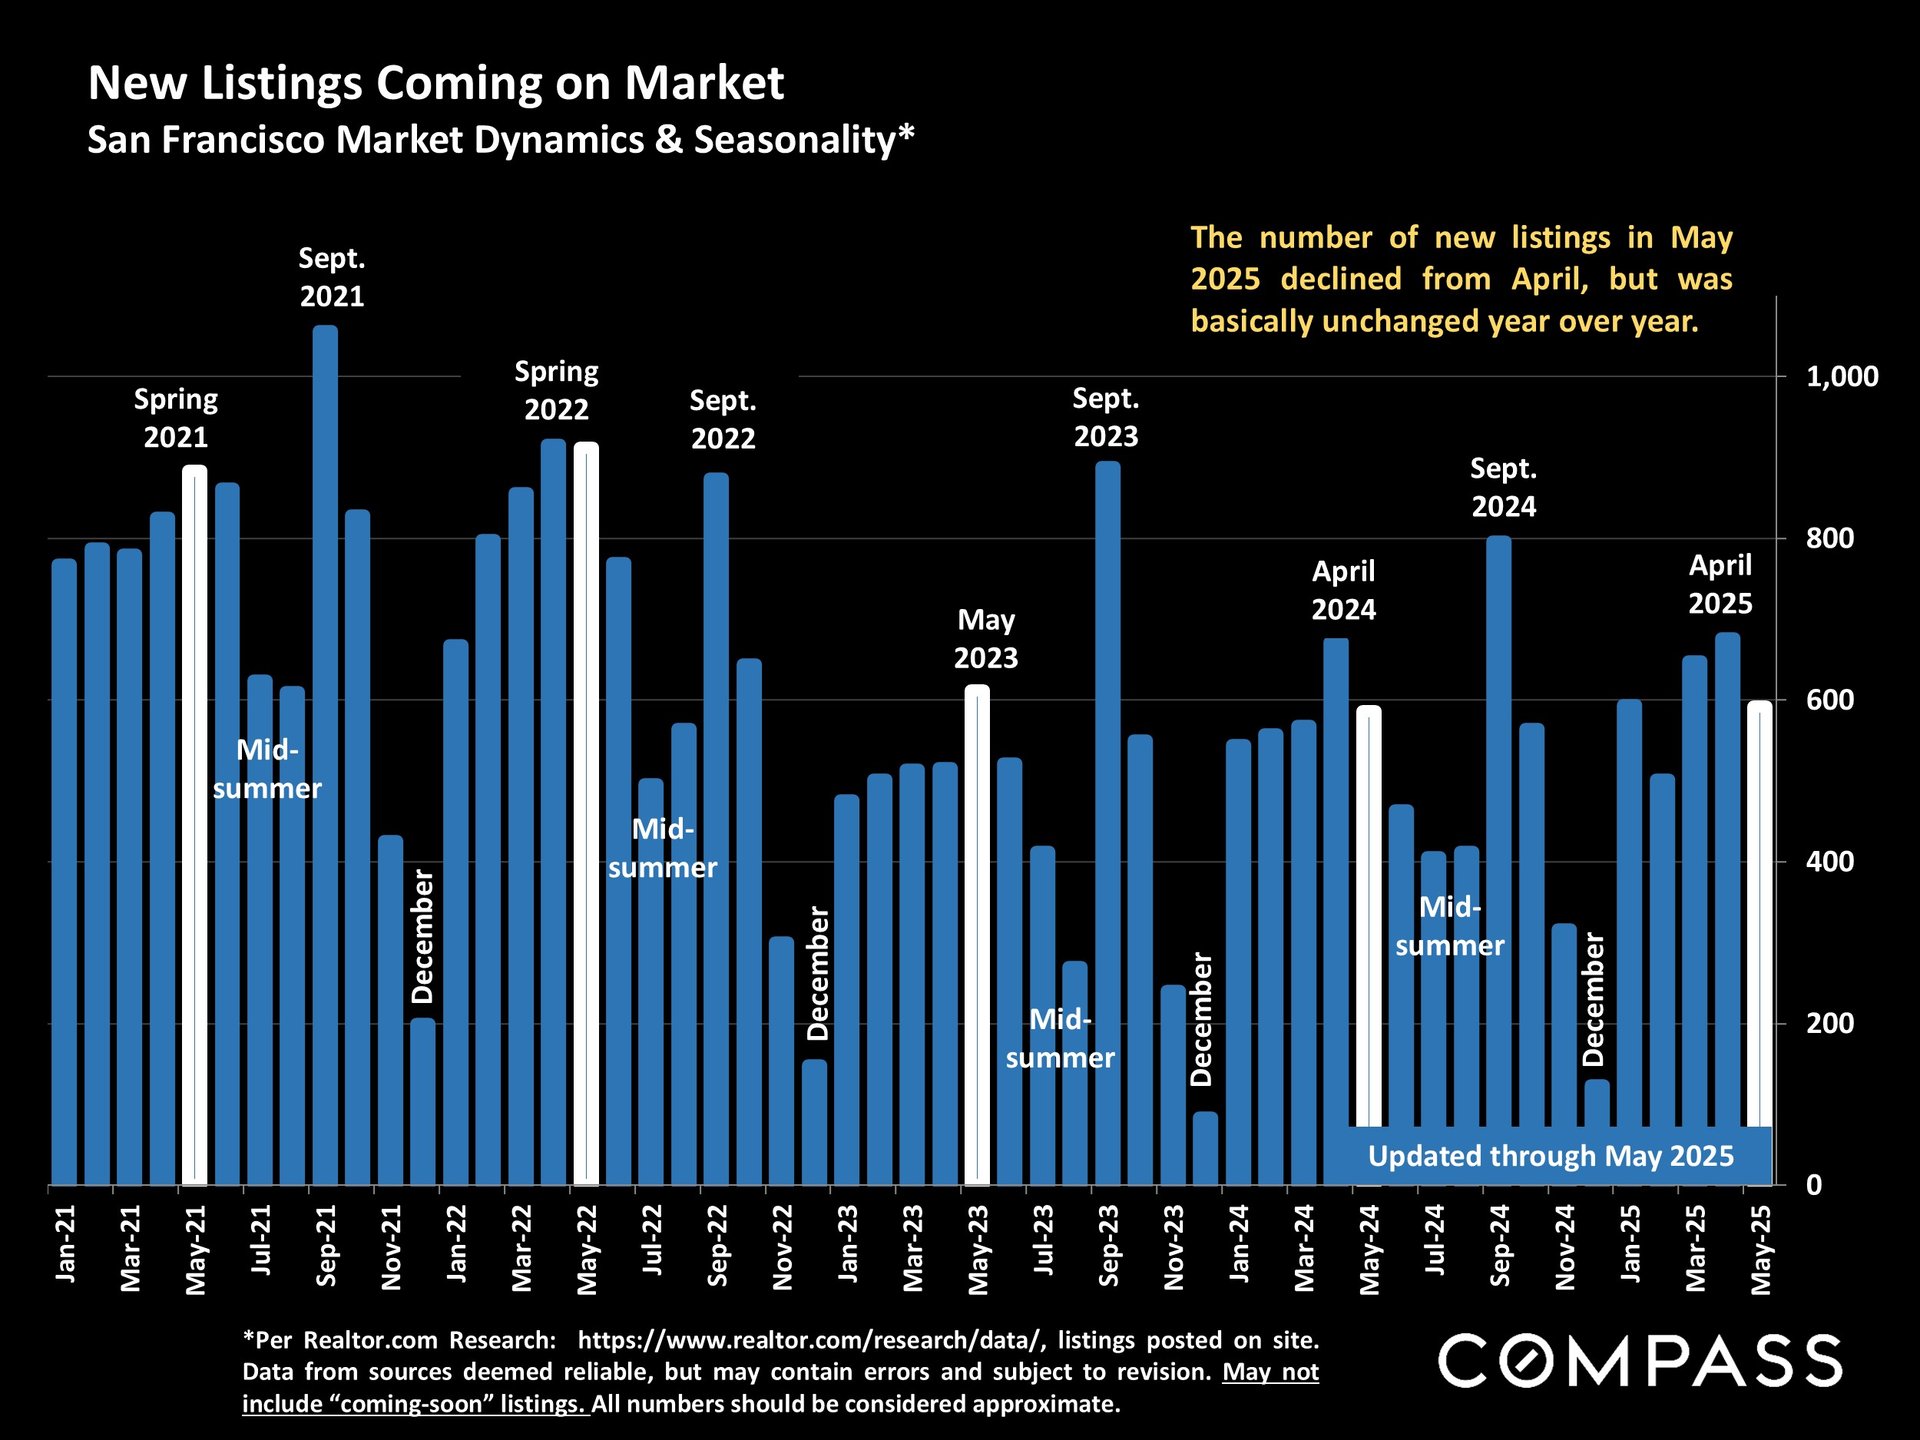
San Francisco monthly new-listing chart, January 2021–May 2025; May 2025 listings were nearly unchanged year over year.


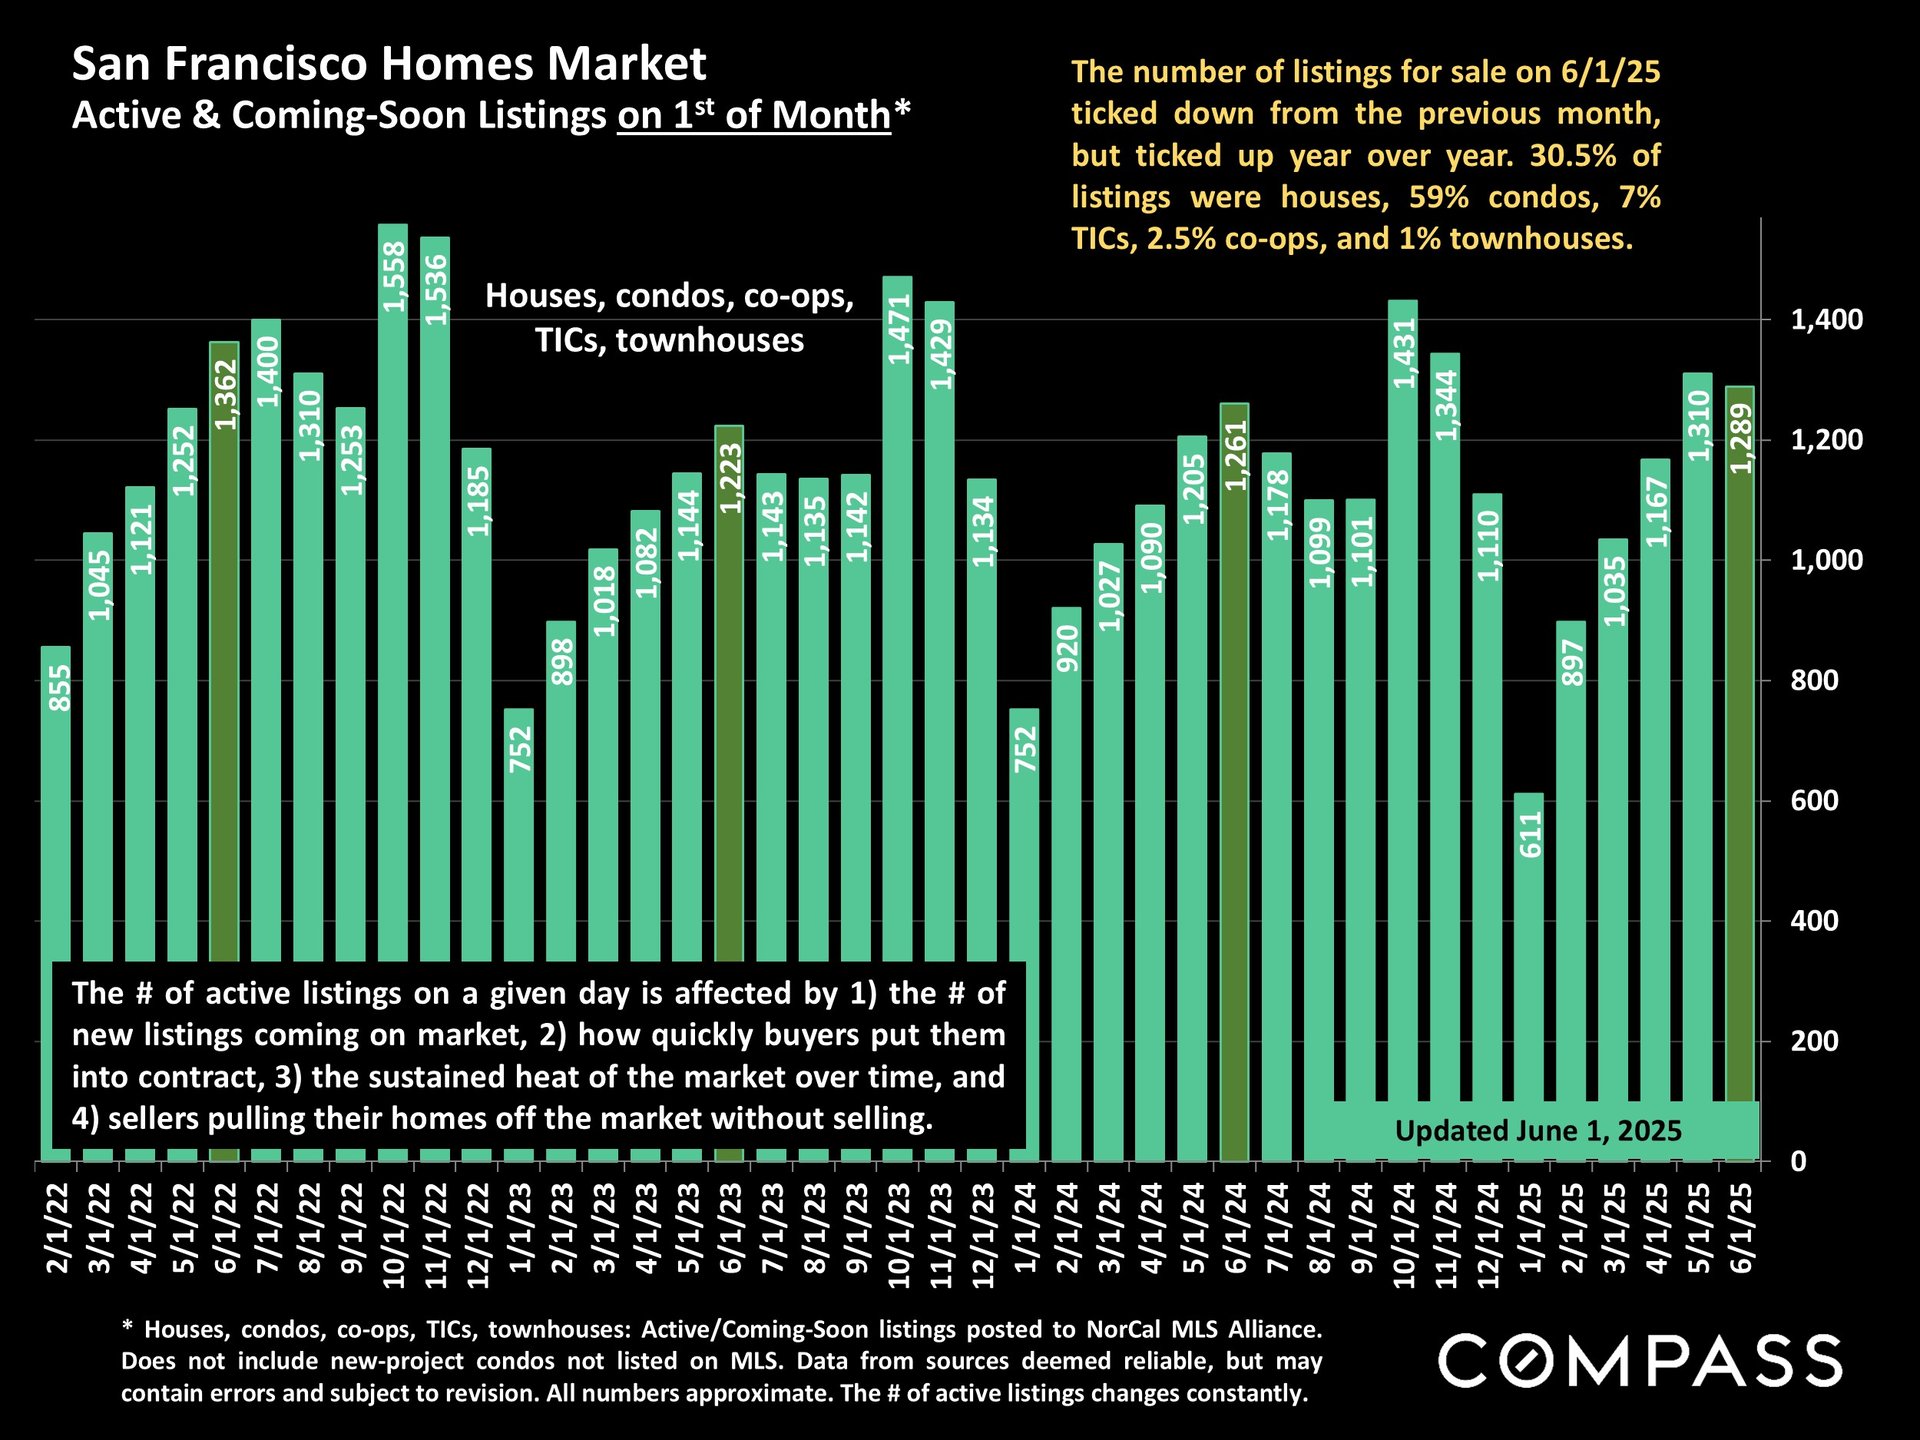
Bar chart of San Francisco active and coming-soon home listings by month, January 2022–June 2025; June 2025 shows 1,289.


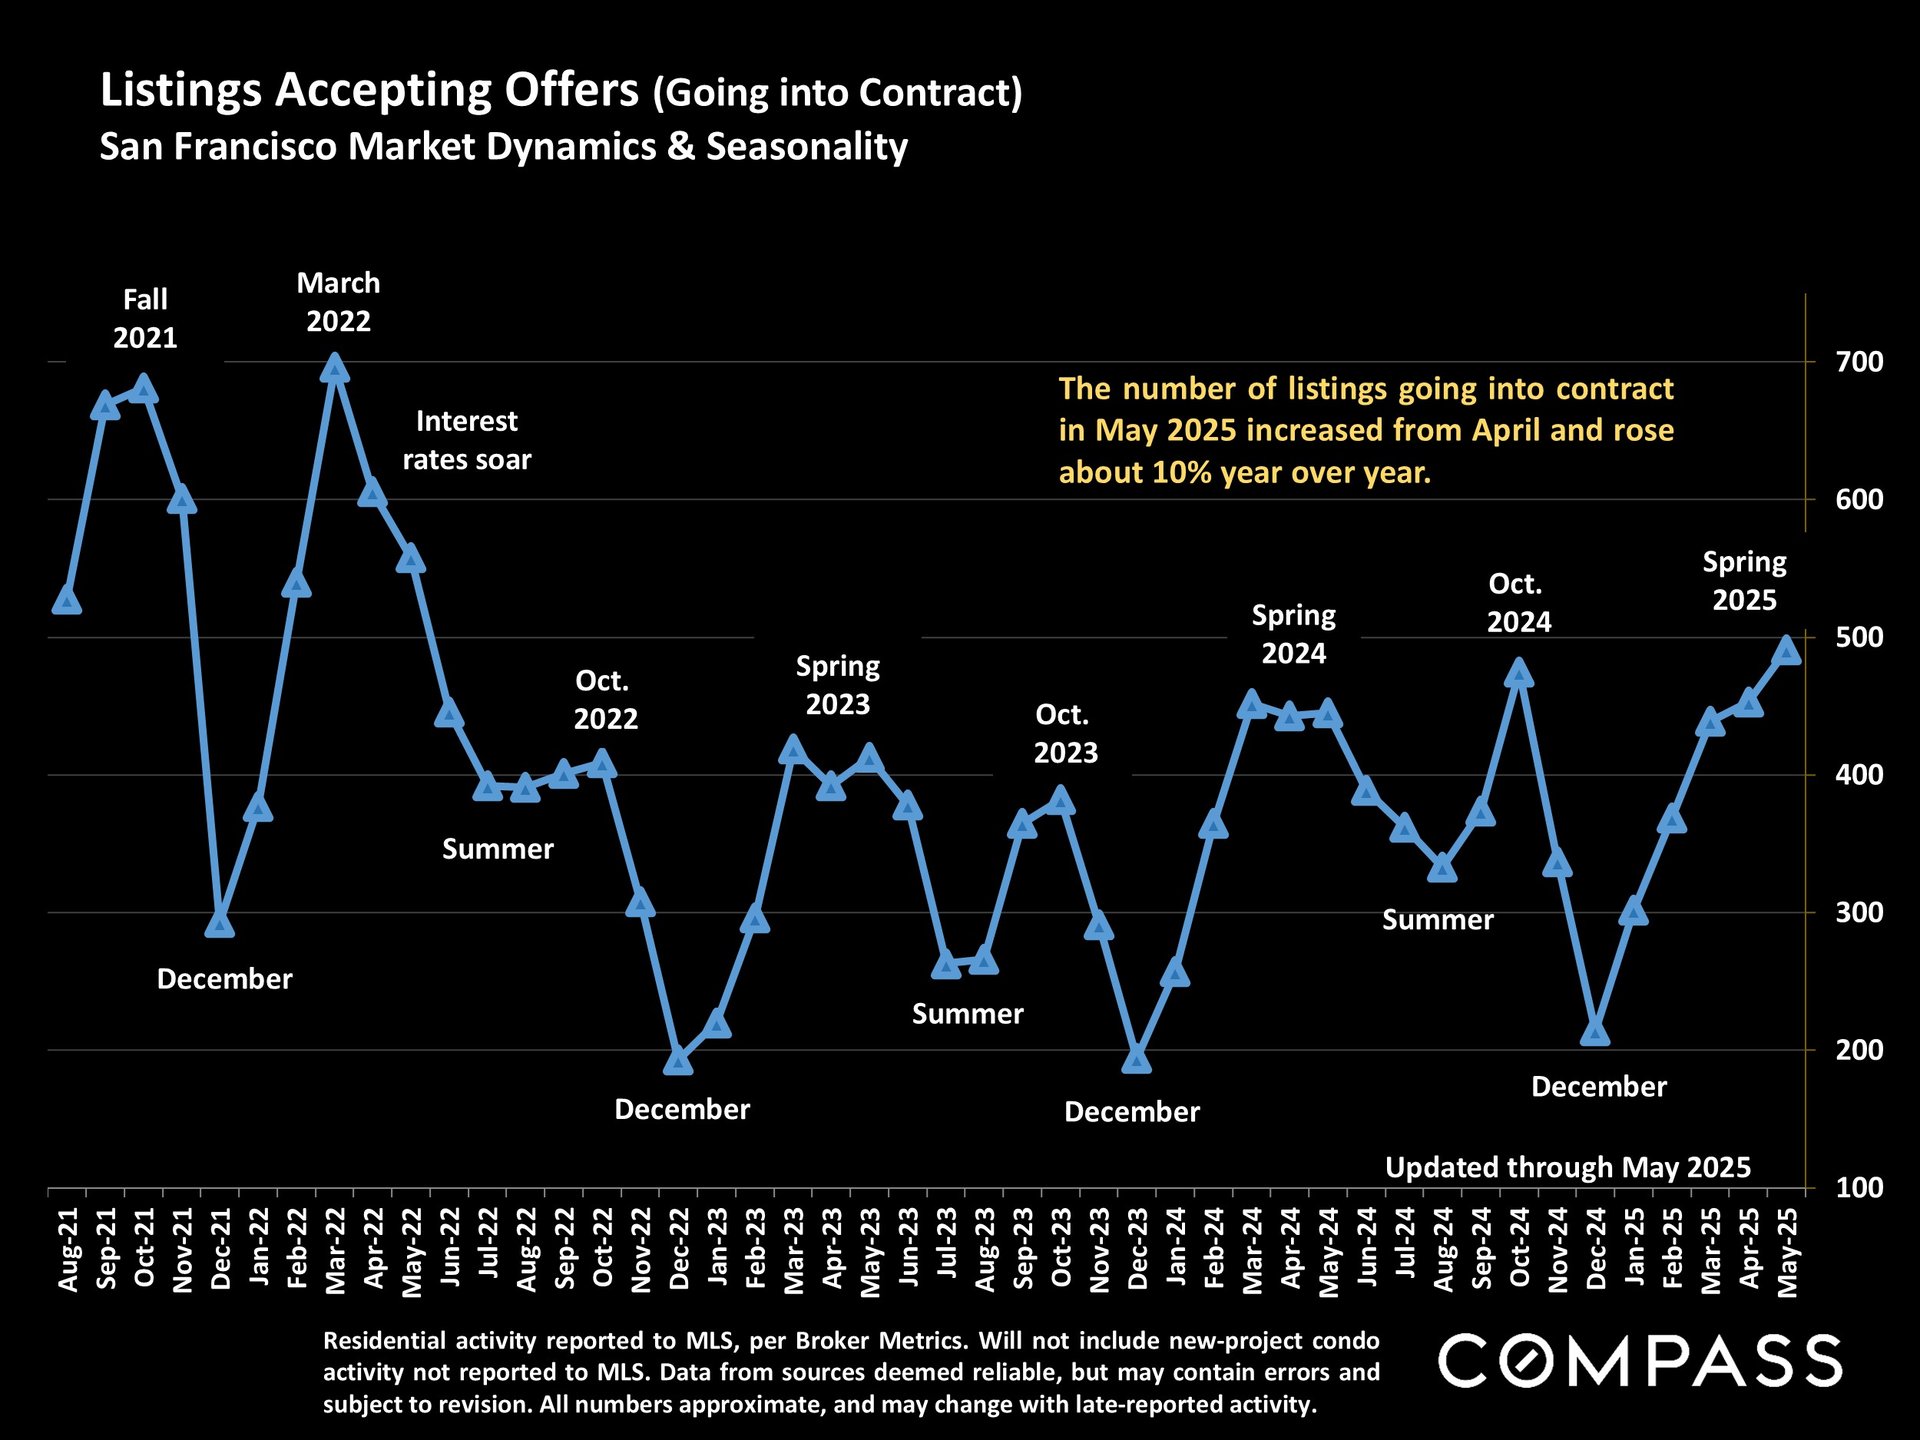
Chart of San Francisco listings accepting offers, August 2021–May 2025, with seasonal trends and monthly counts.


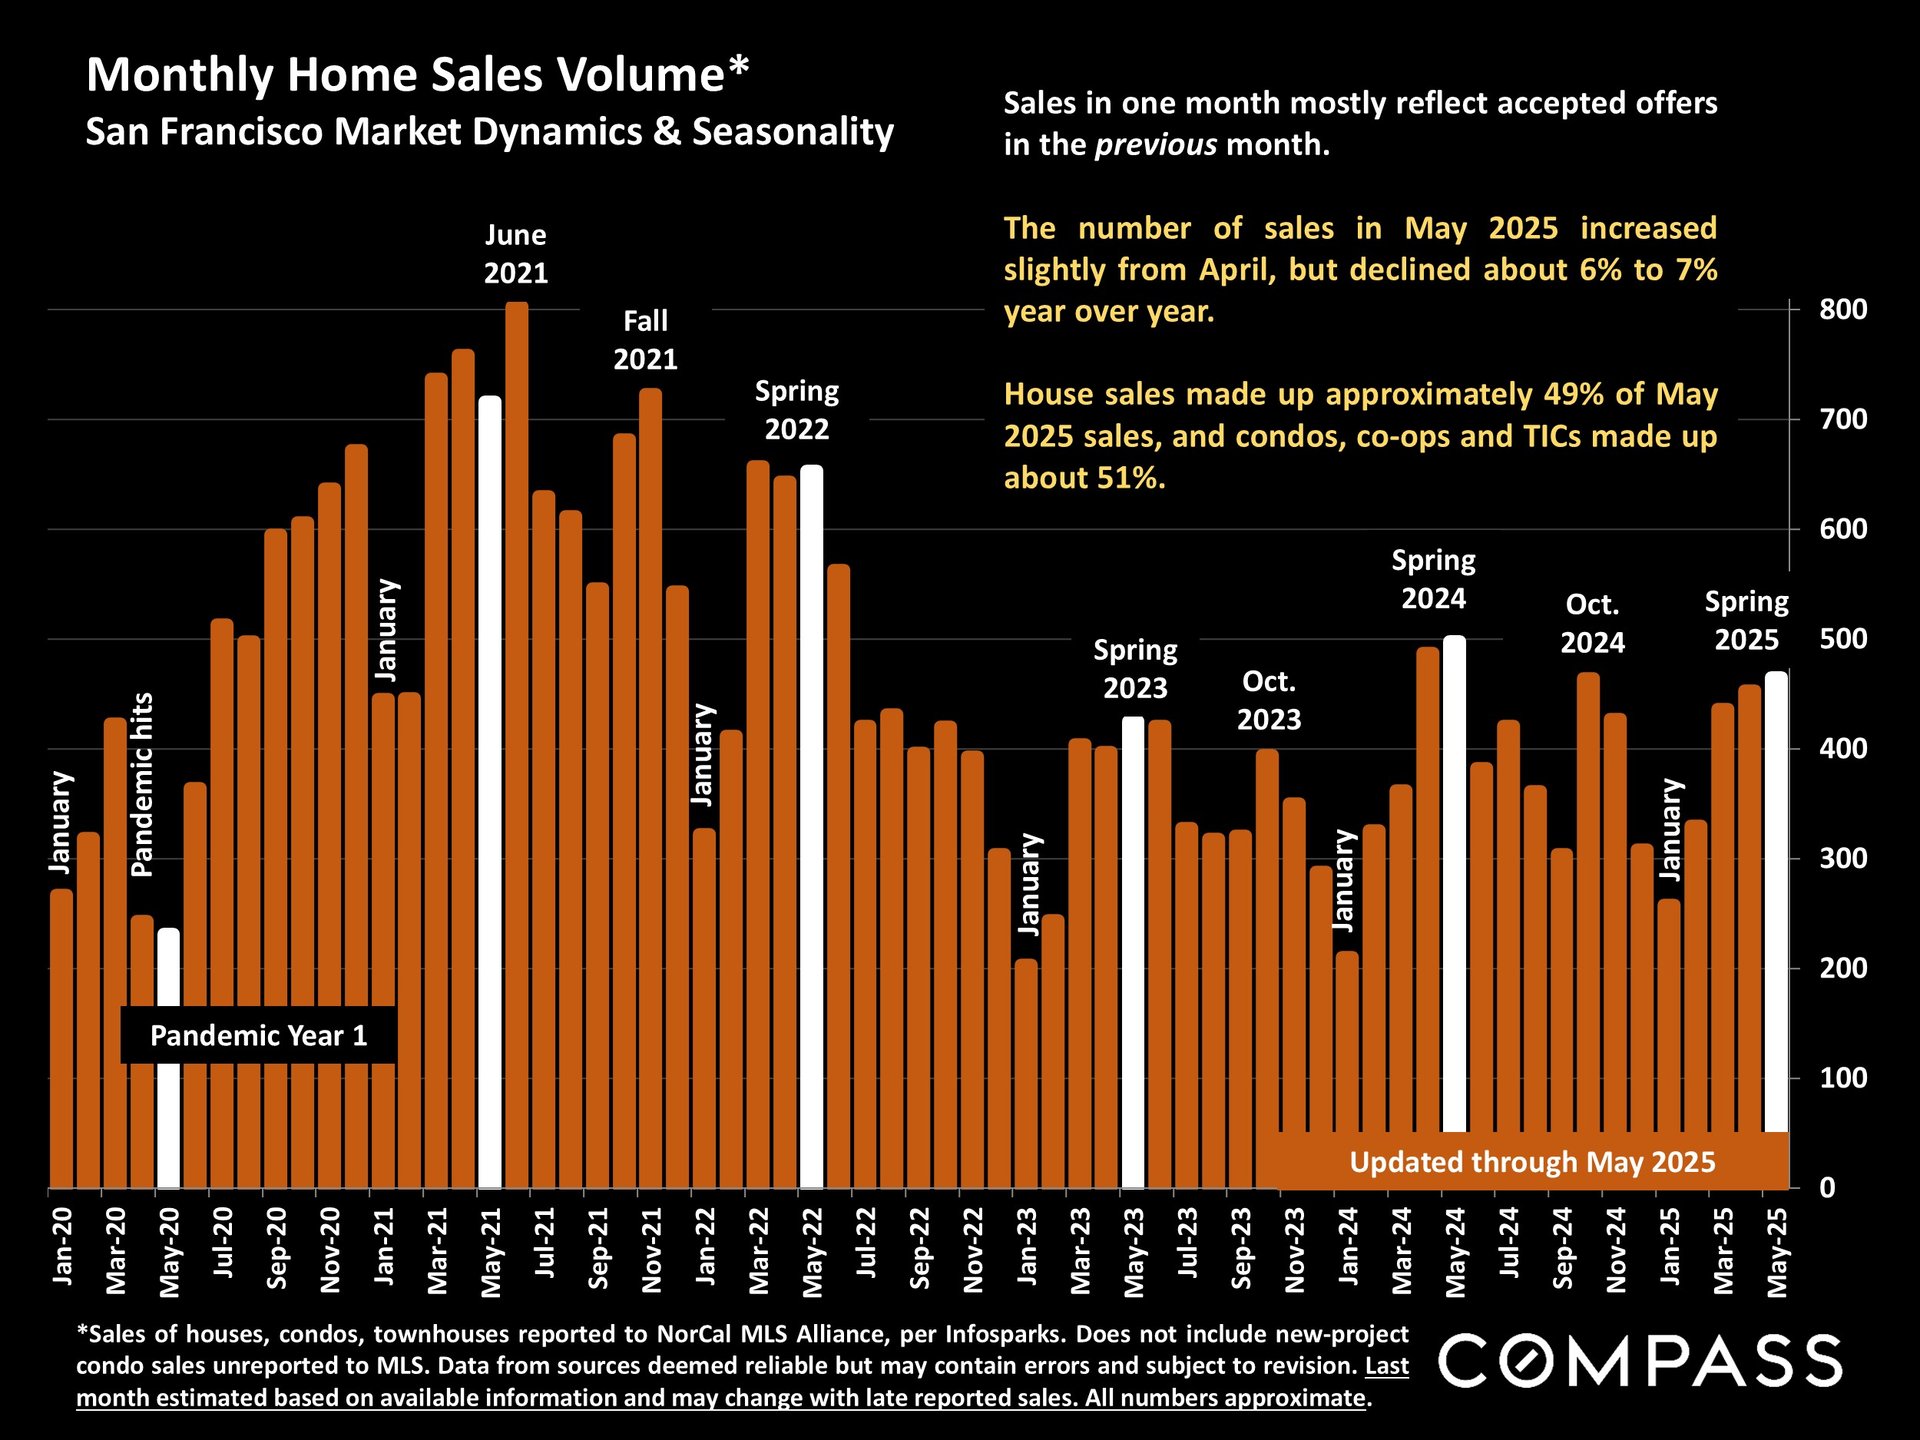
Chart of San Francisco monthly home sales from 2020 to May 2025, with May 2025 market notes.


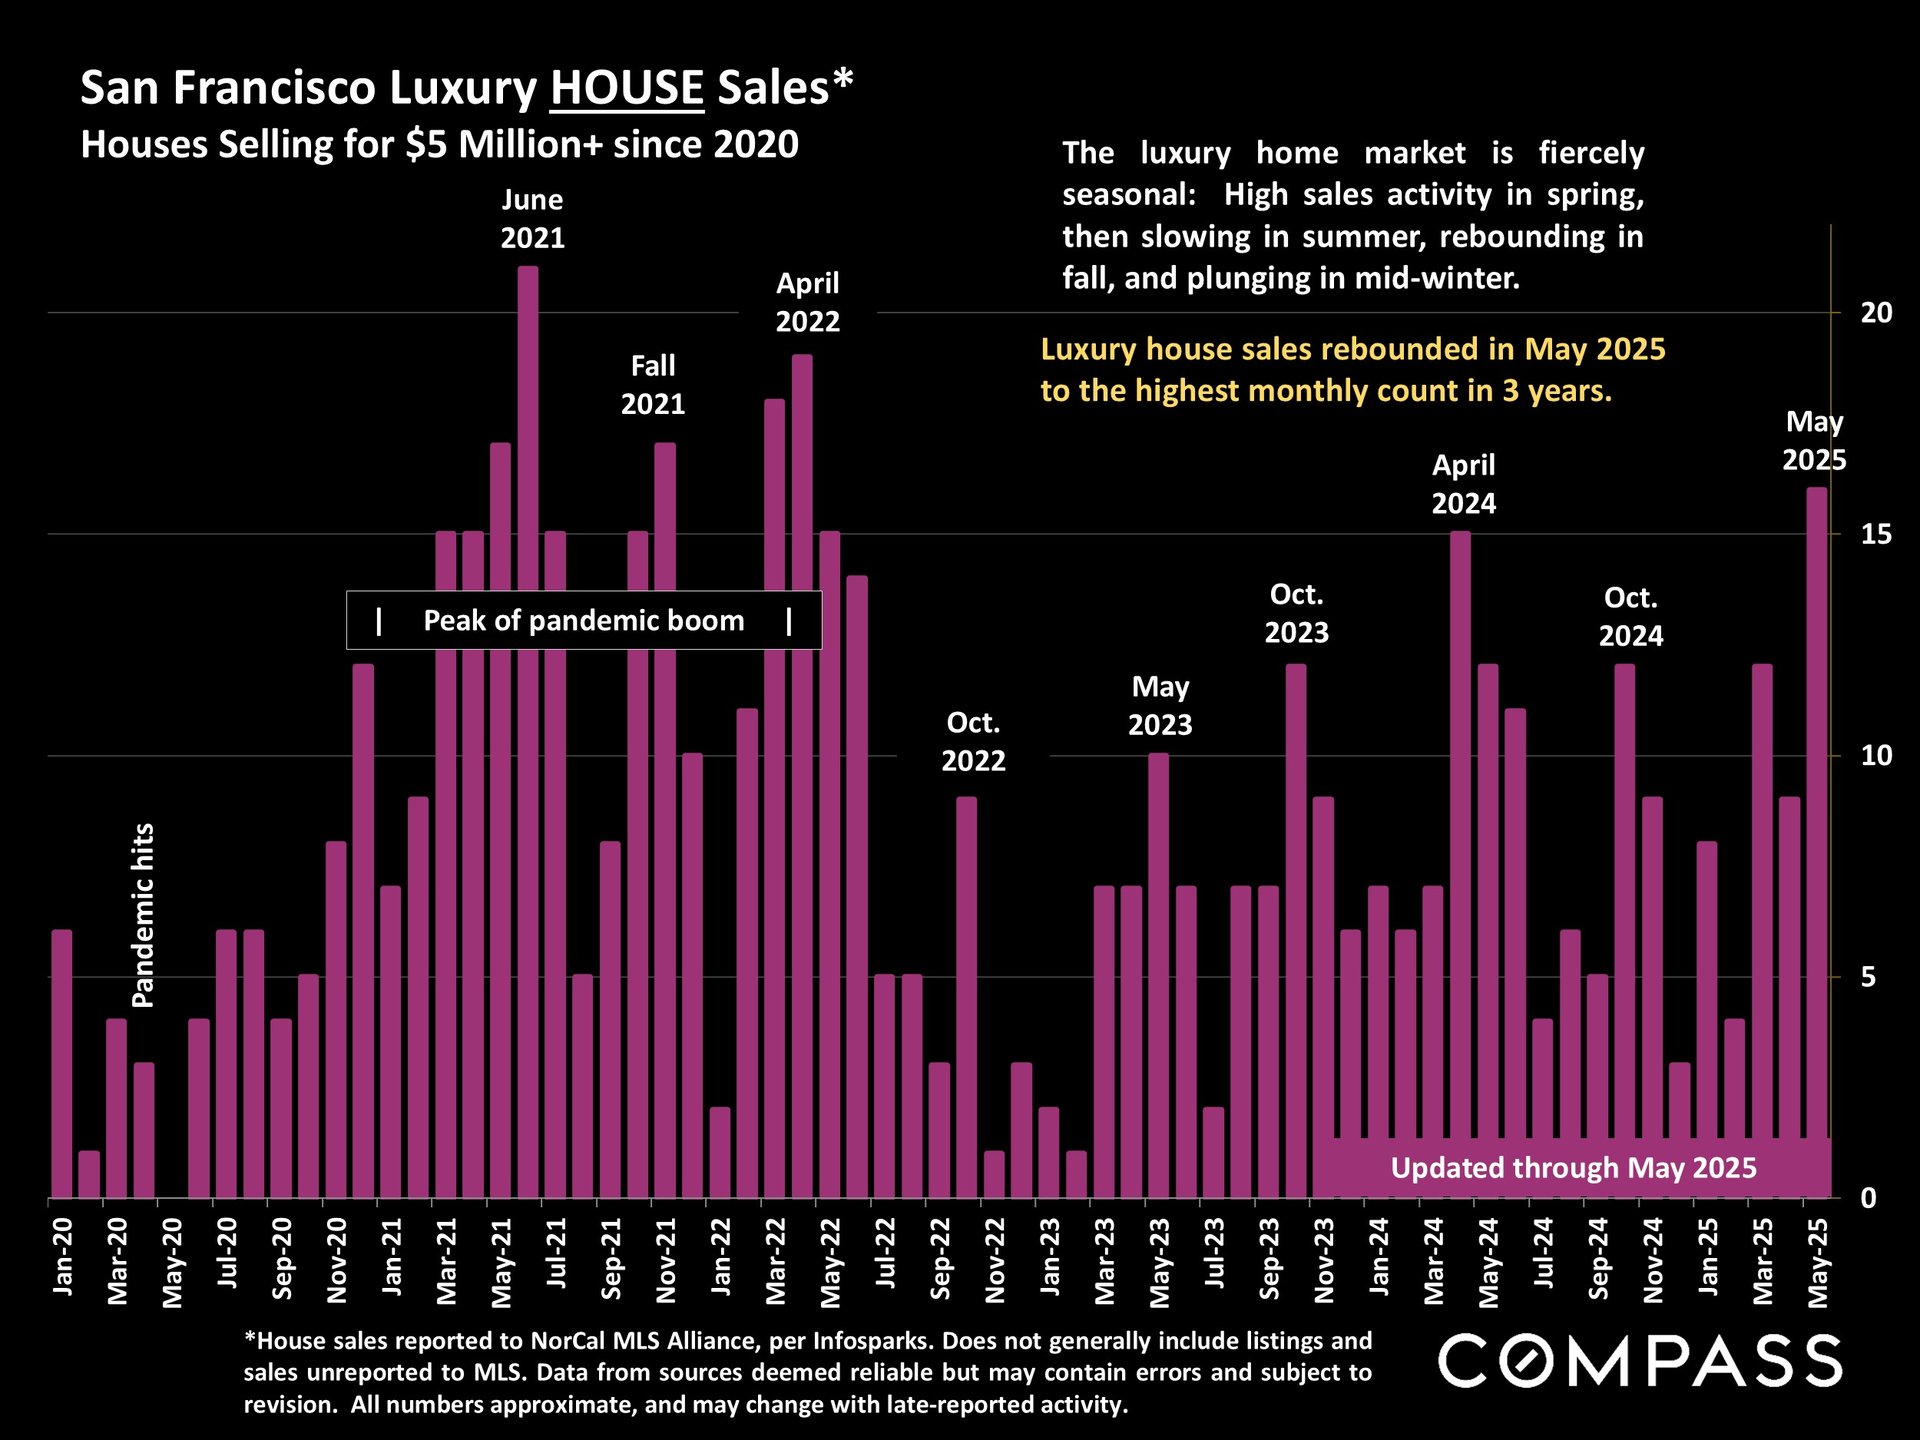
San Francisco luxury home sales chart, with monthly bars from 2020 to May 2025 and seasonal market notes.


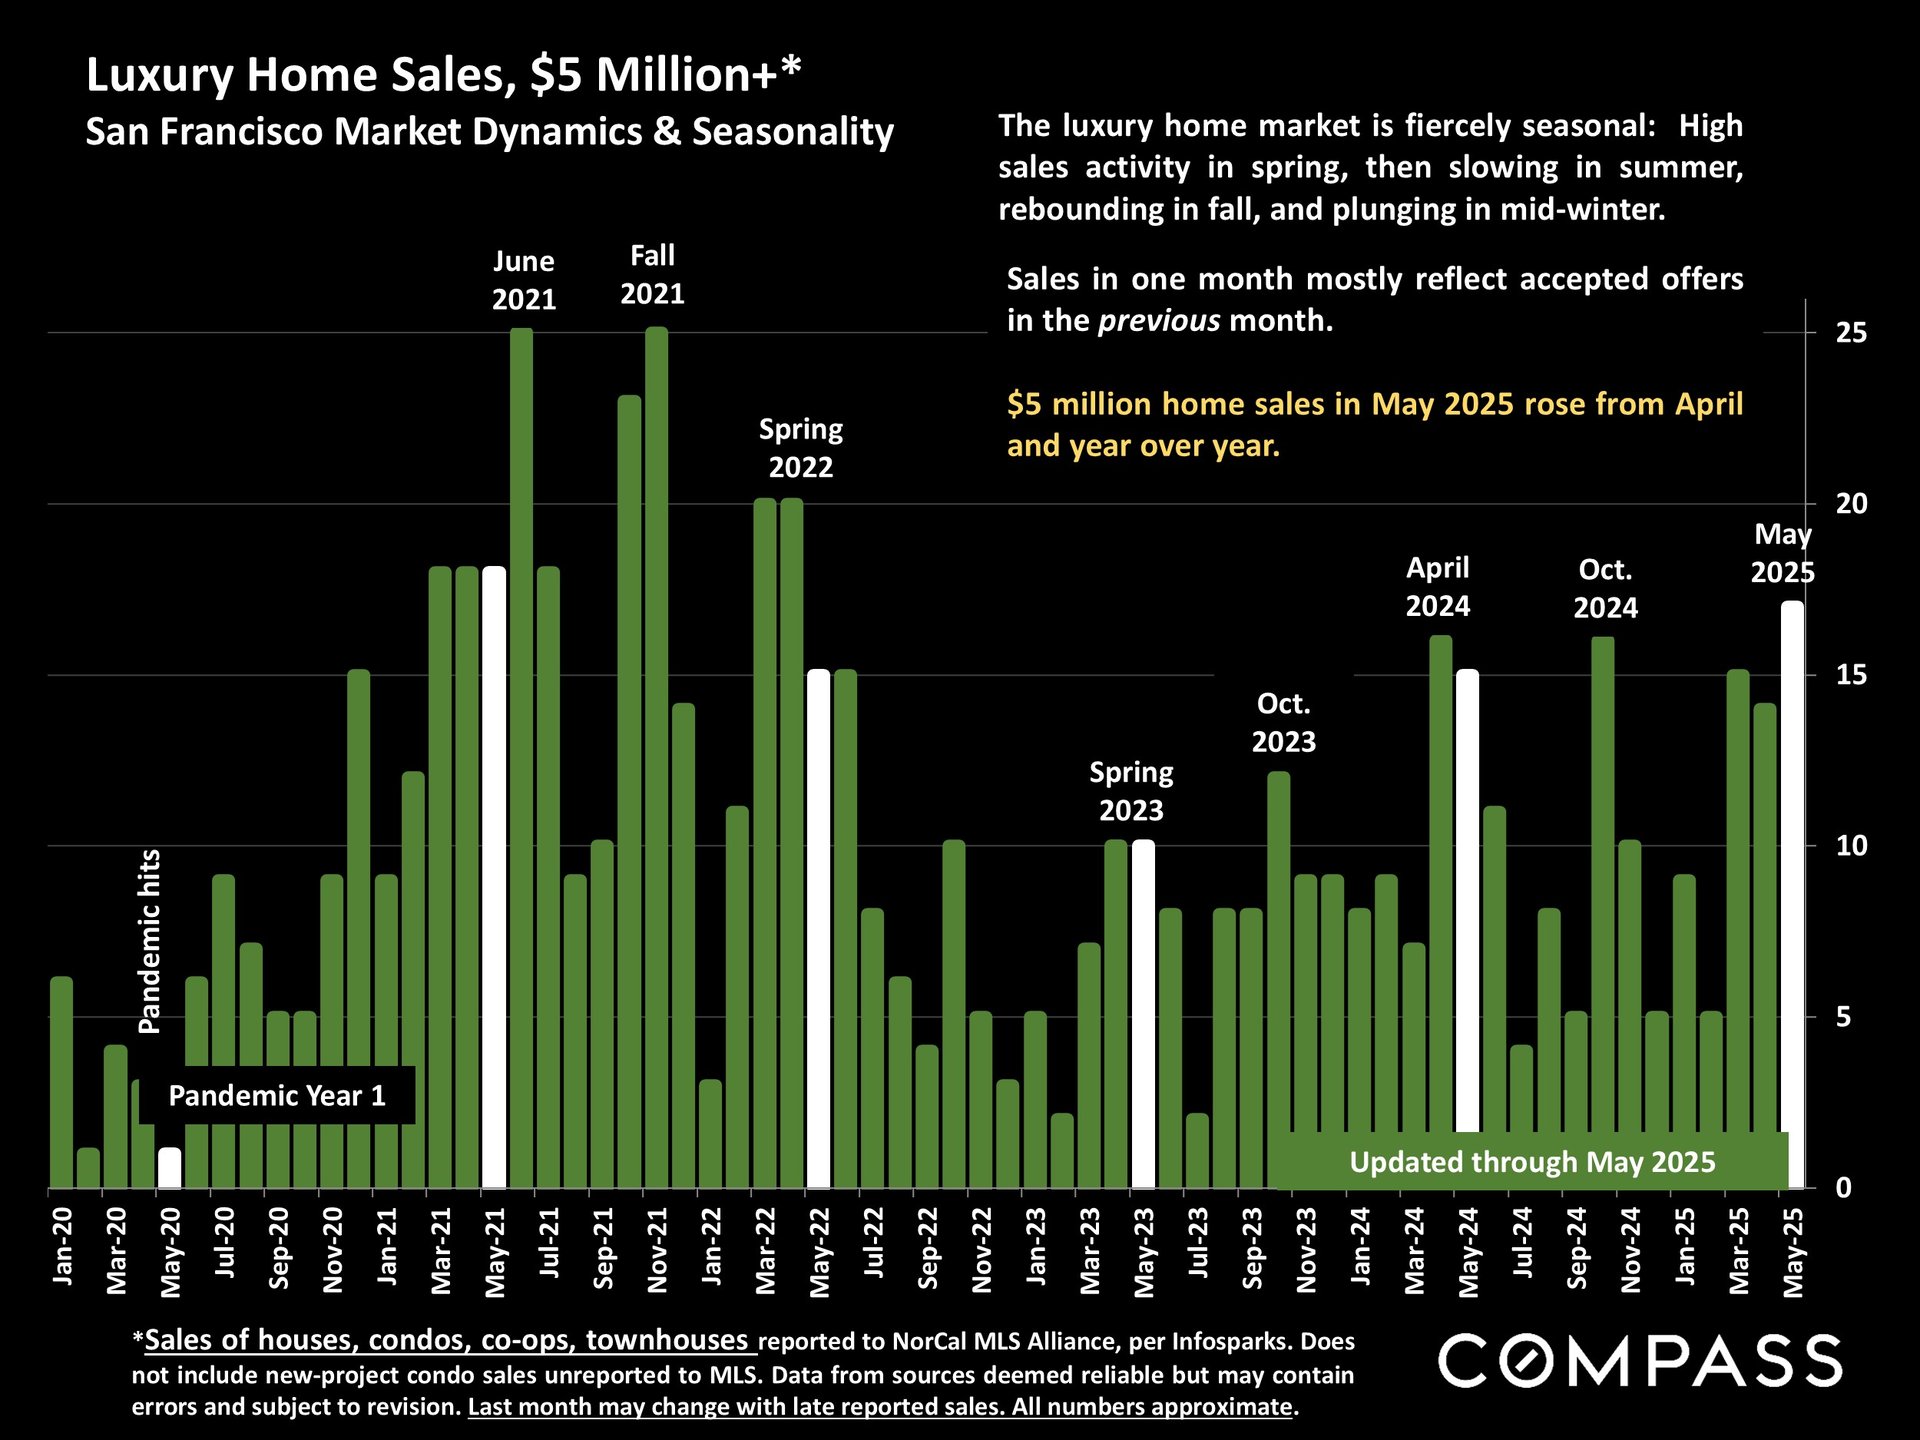
Chart of San Francisco luxury home sales above $5 million, showing monthly counts from 2020 to May 2025.


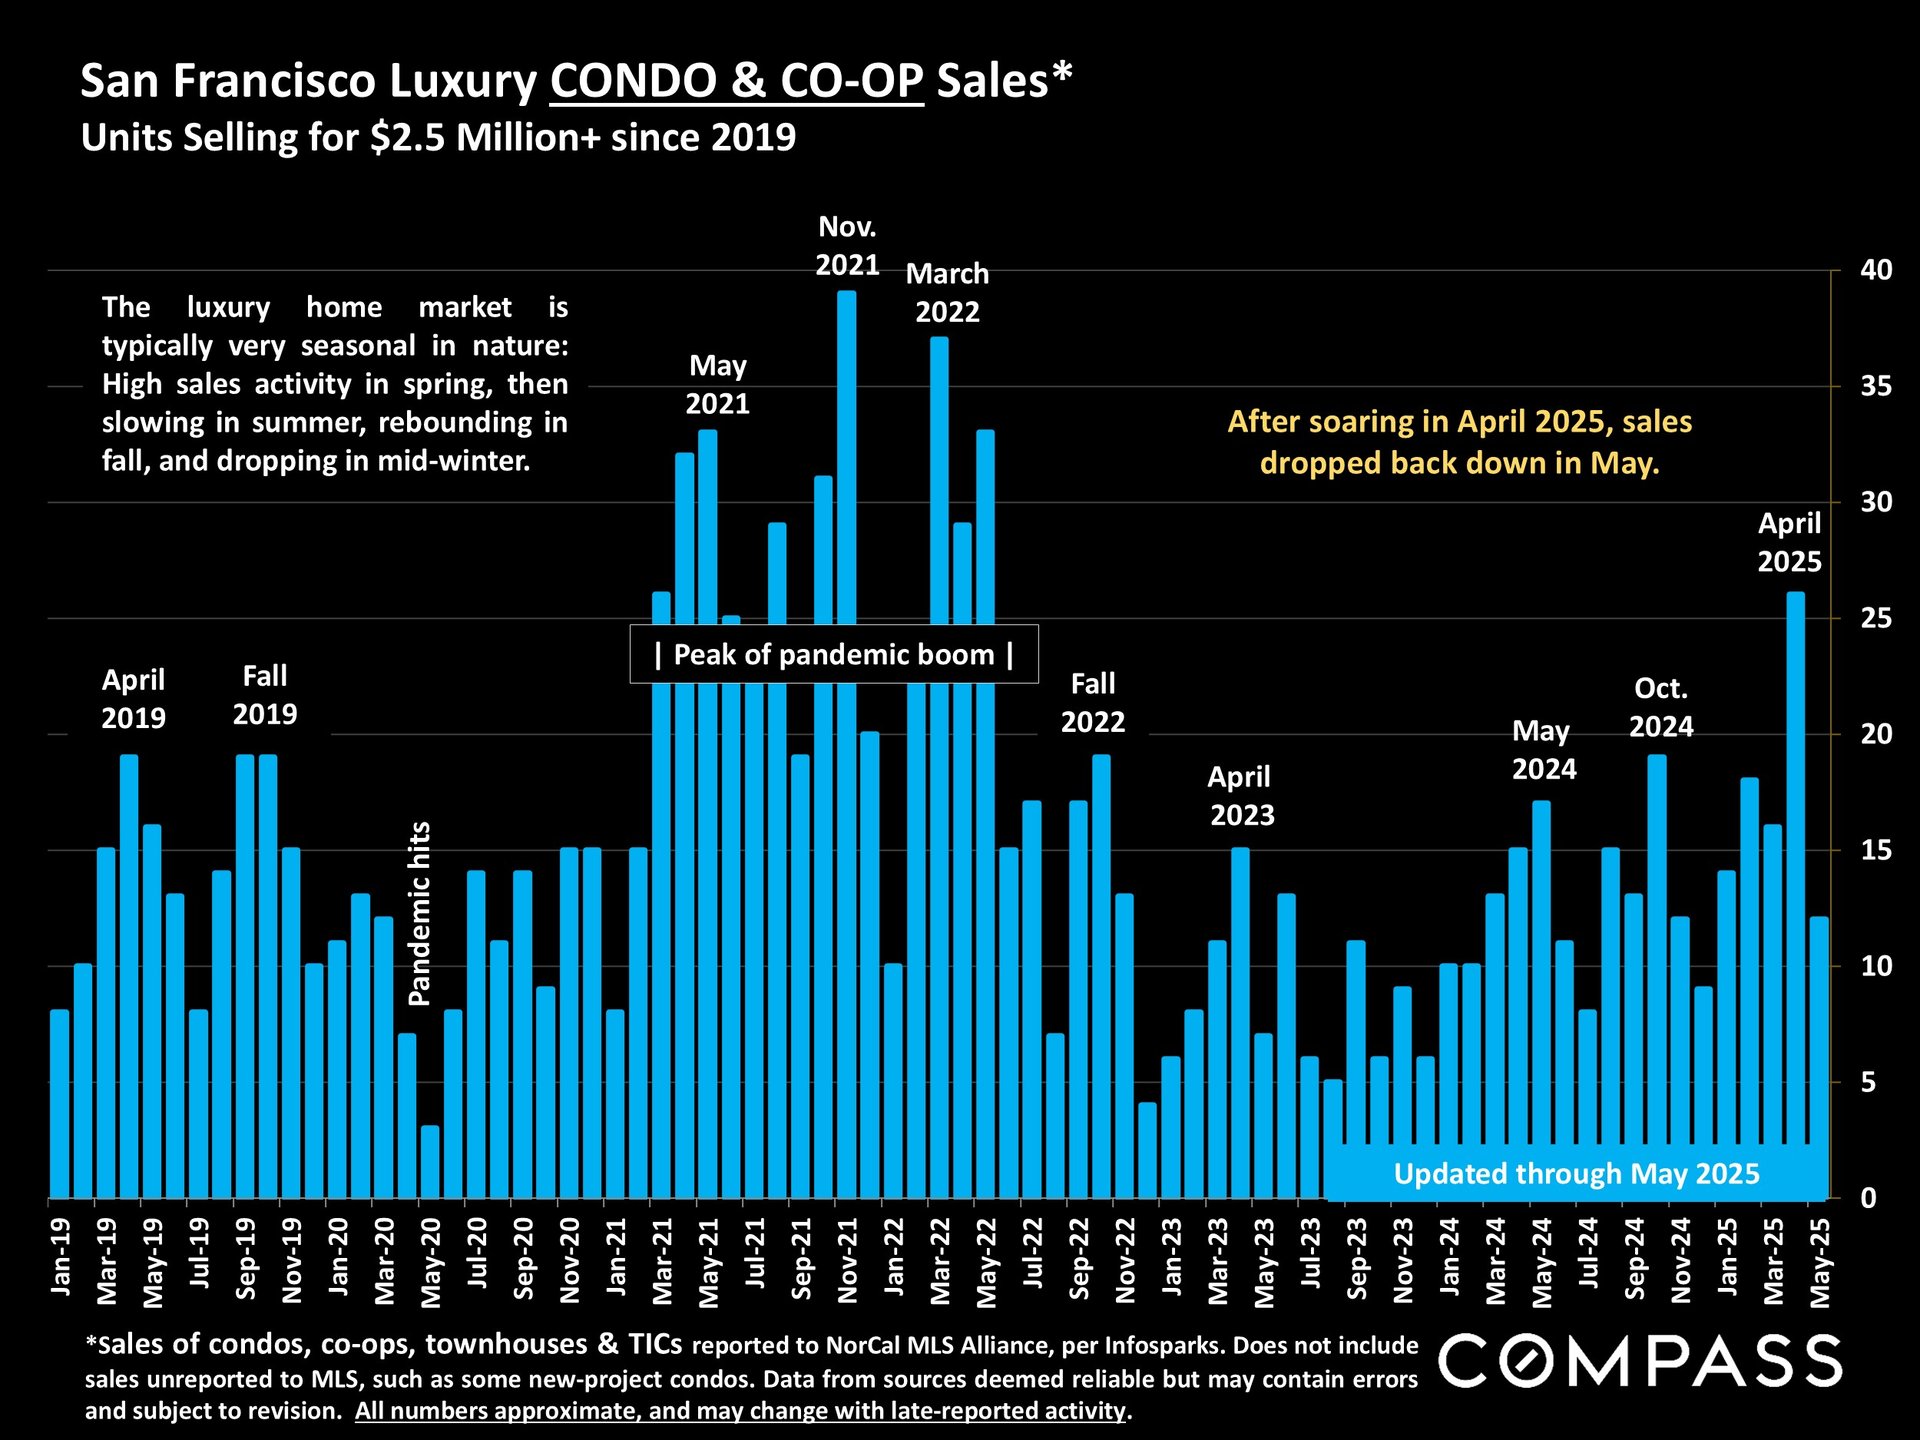
Bar chart of San Francisco luxury condo and co-op sales, with pandemic-era peaks and a drop from April to May 2025.


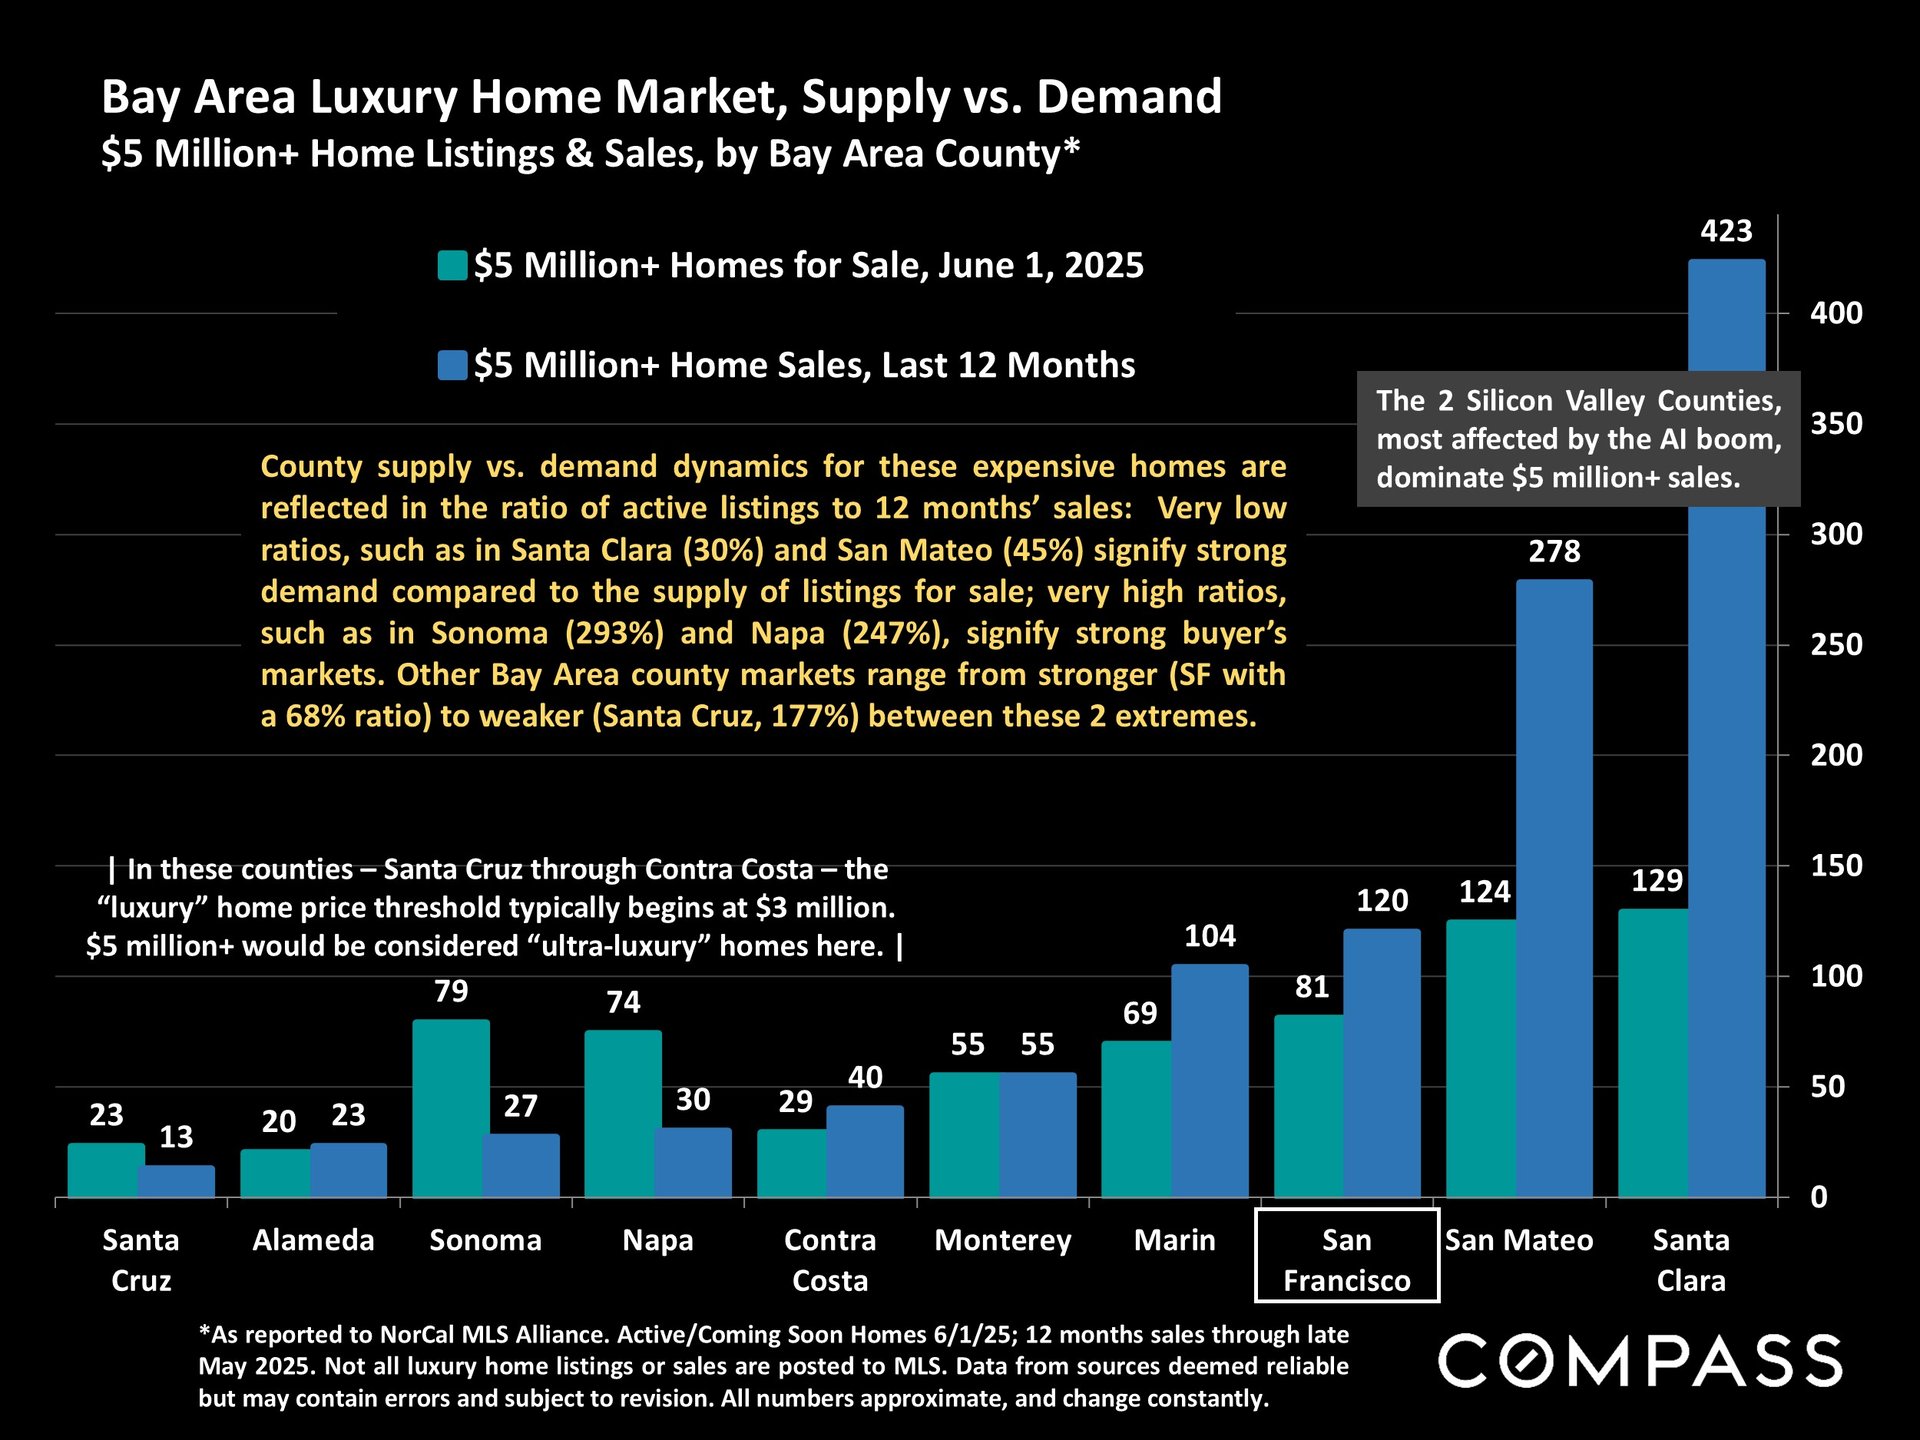
Bar chart comparing $5 million-plus home listings and sales across Bay Area counties, with Santa Clara leading sales.


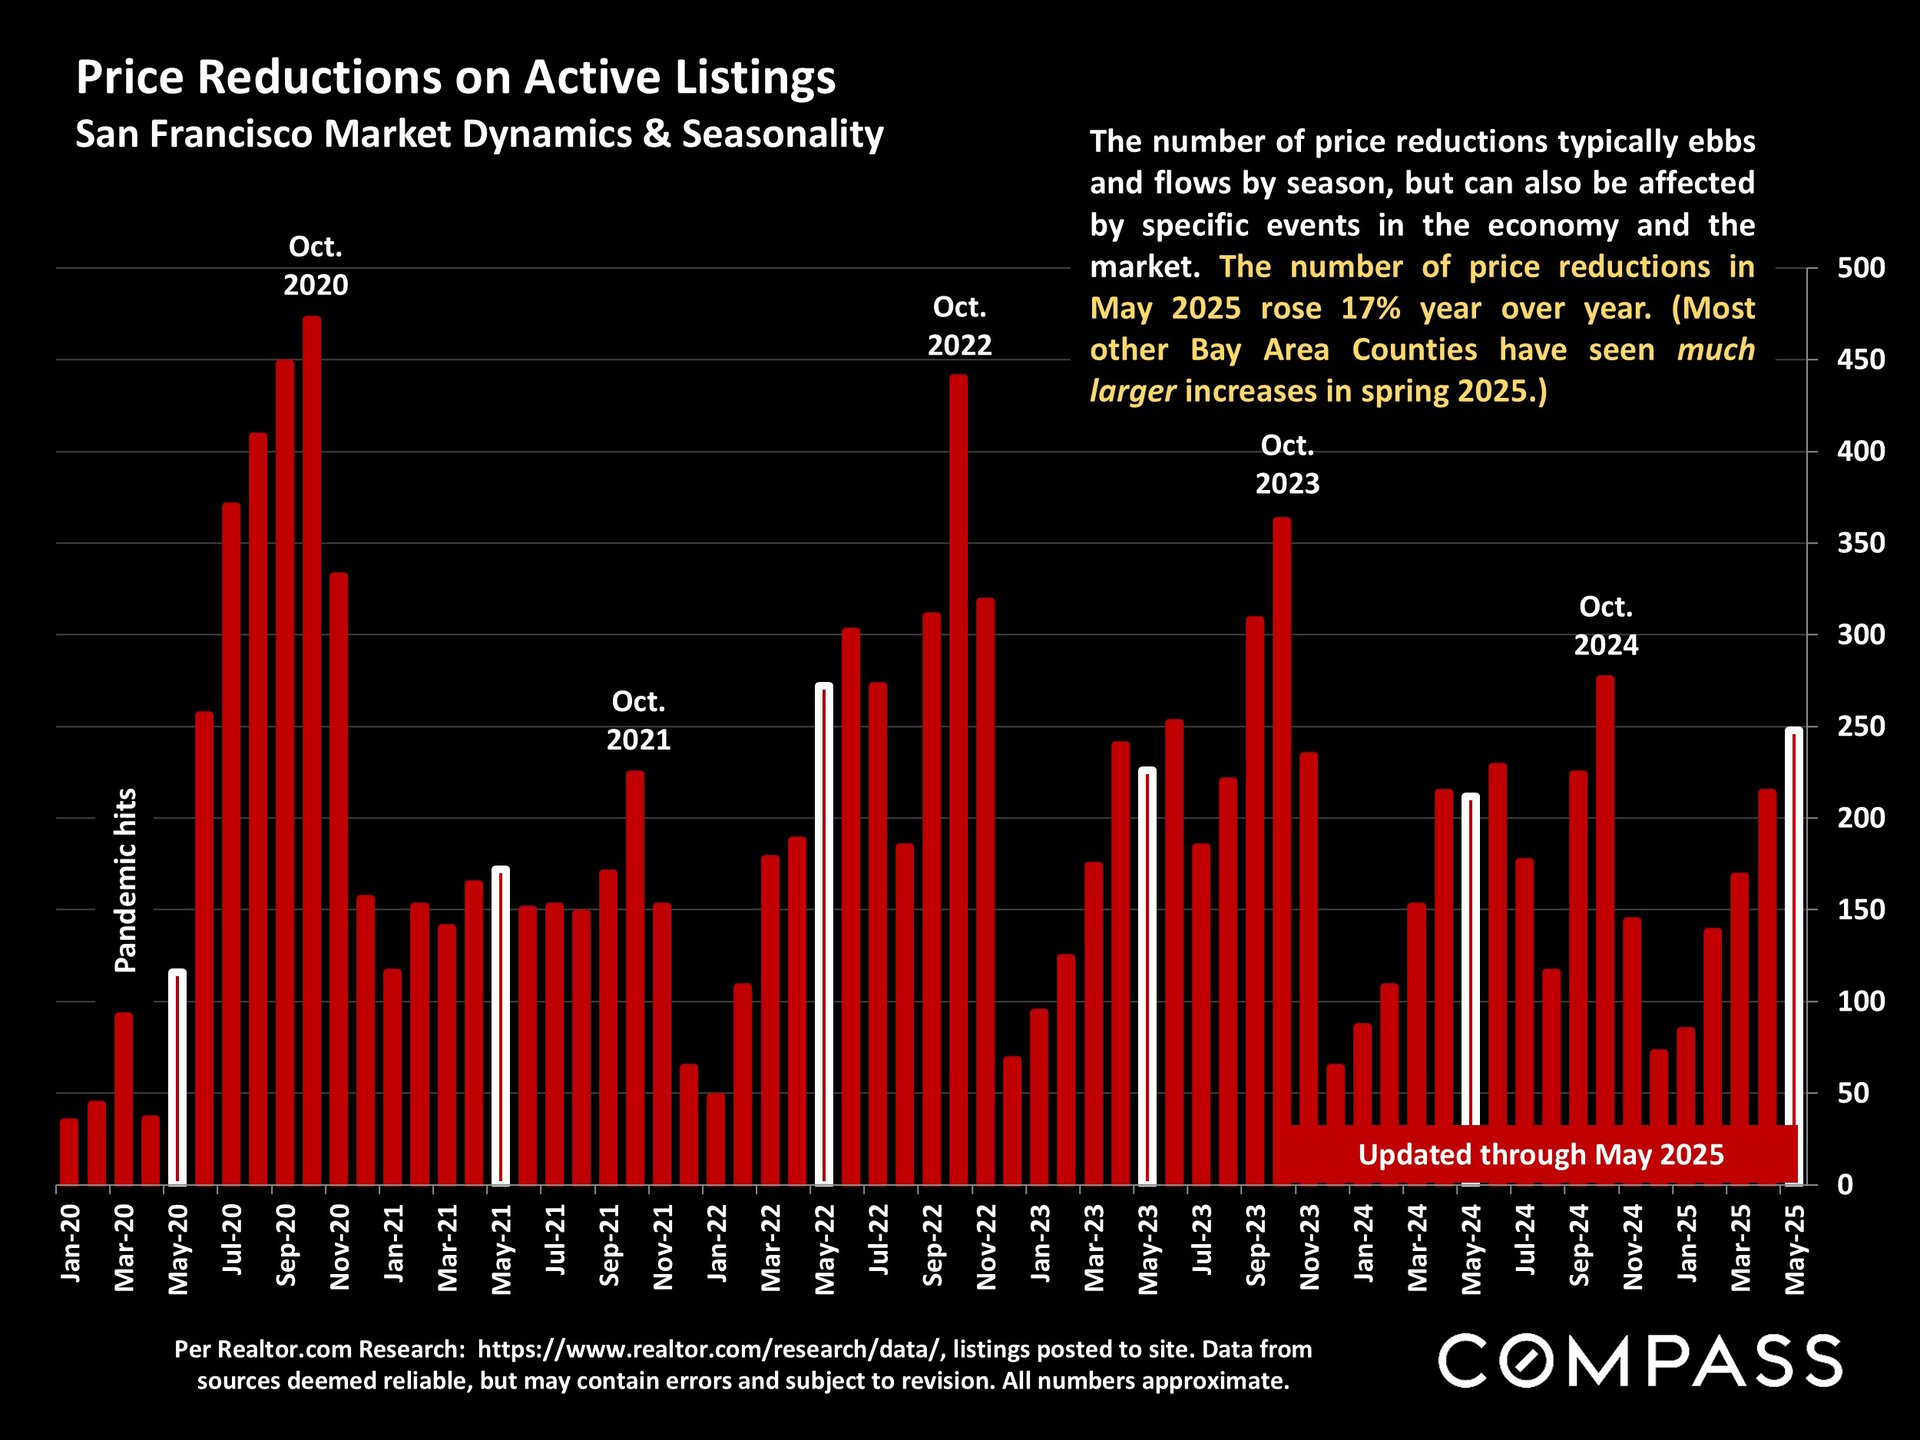
Bar chart of San Francisco active-listing price reductions from January 2020 through May 2025.


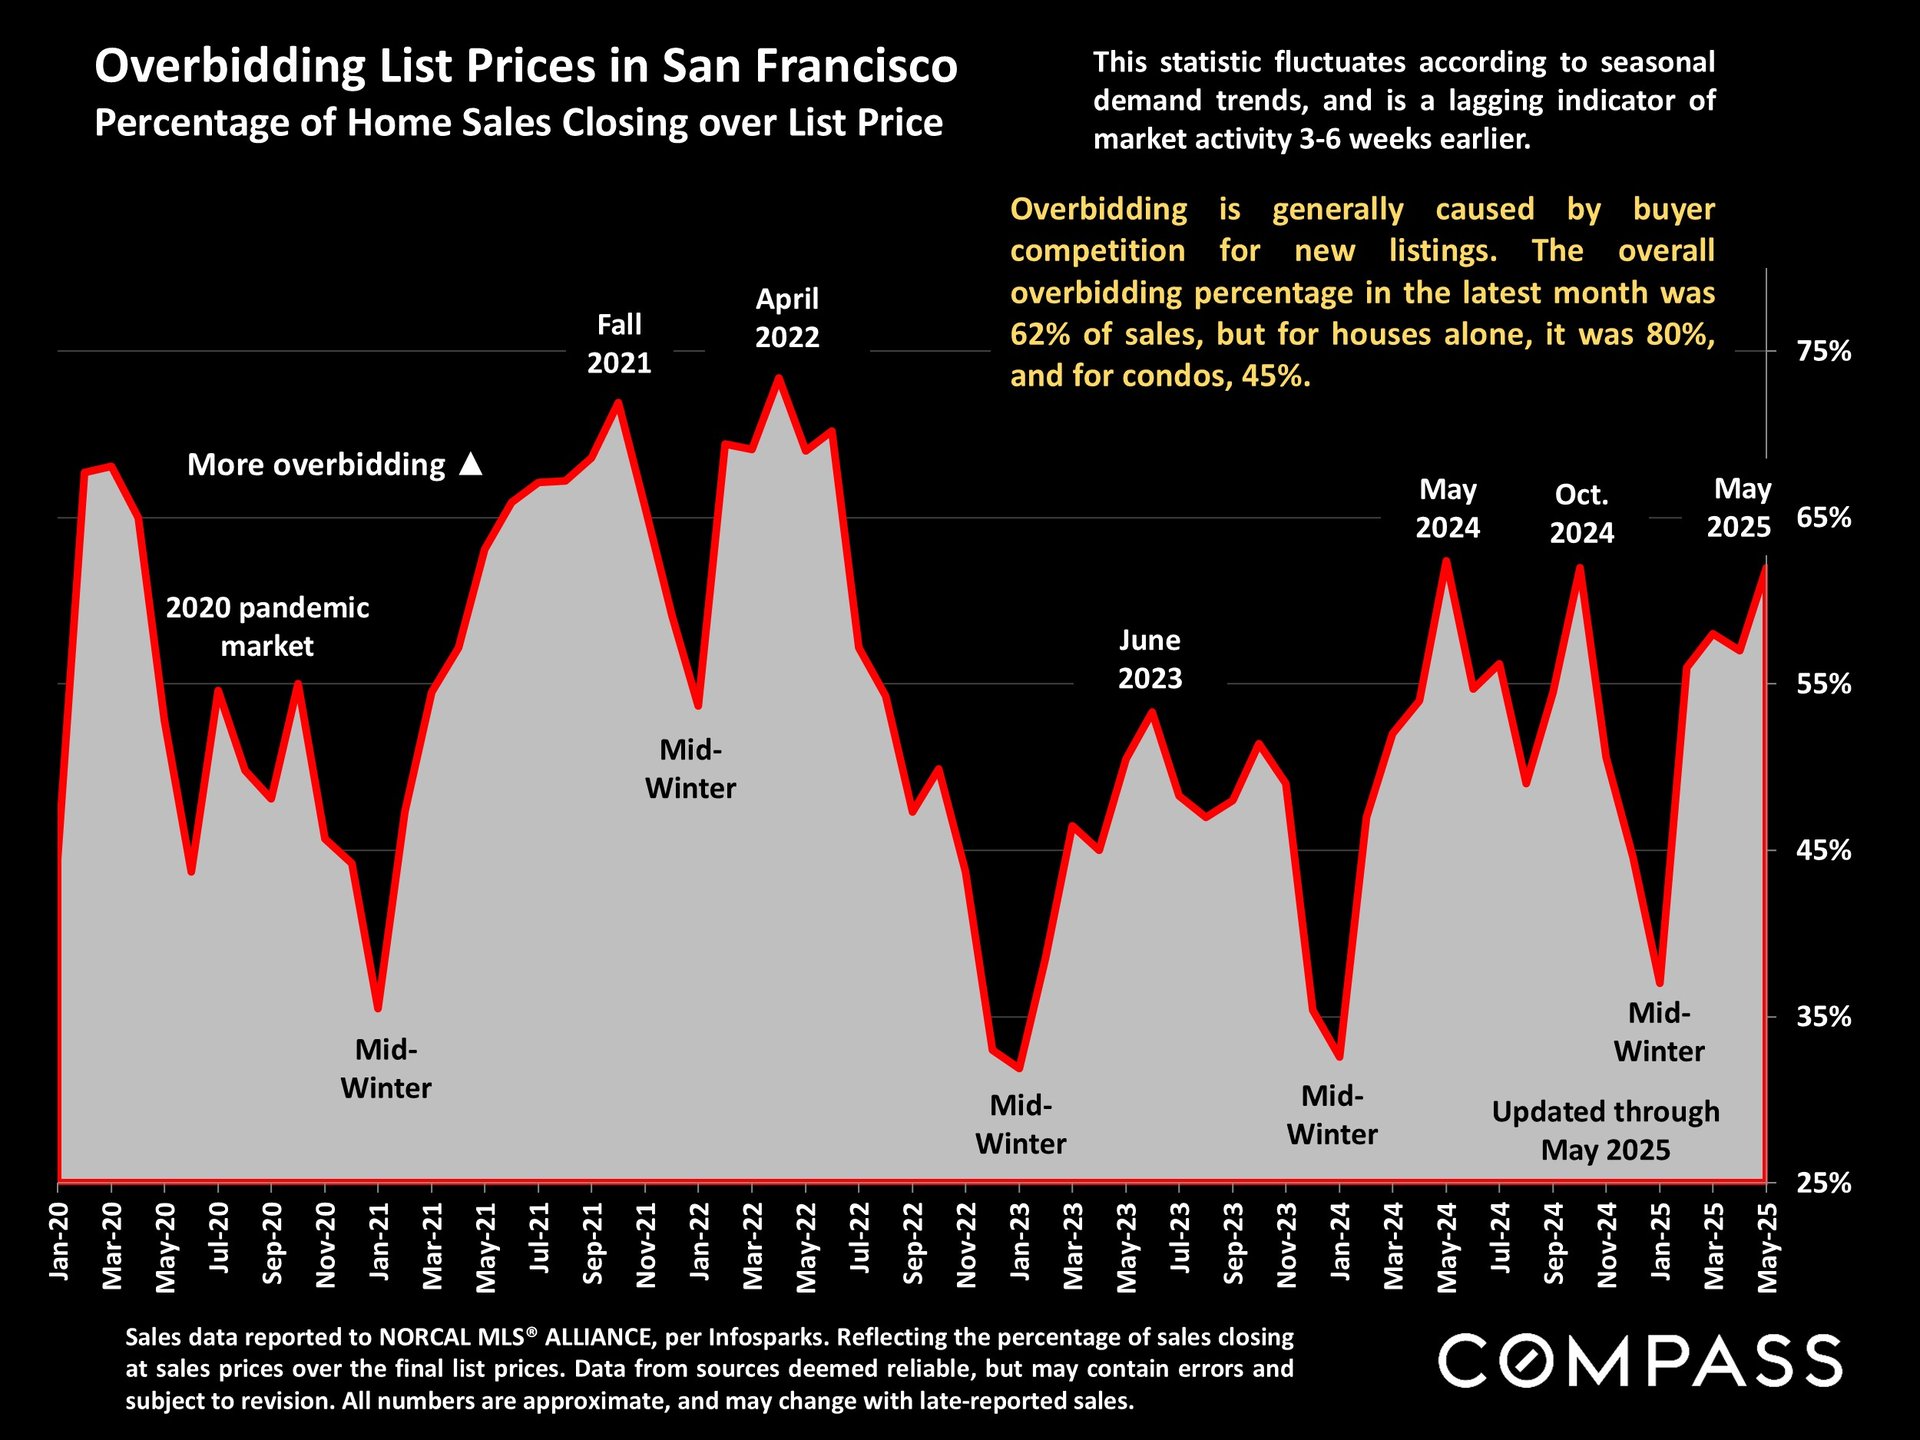
Chart tracking San Francisco home sales closing over list price from January 2020 through May 2025.


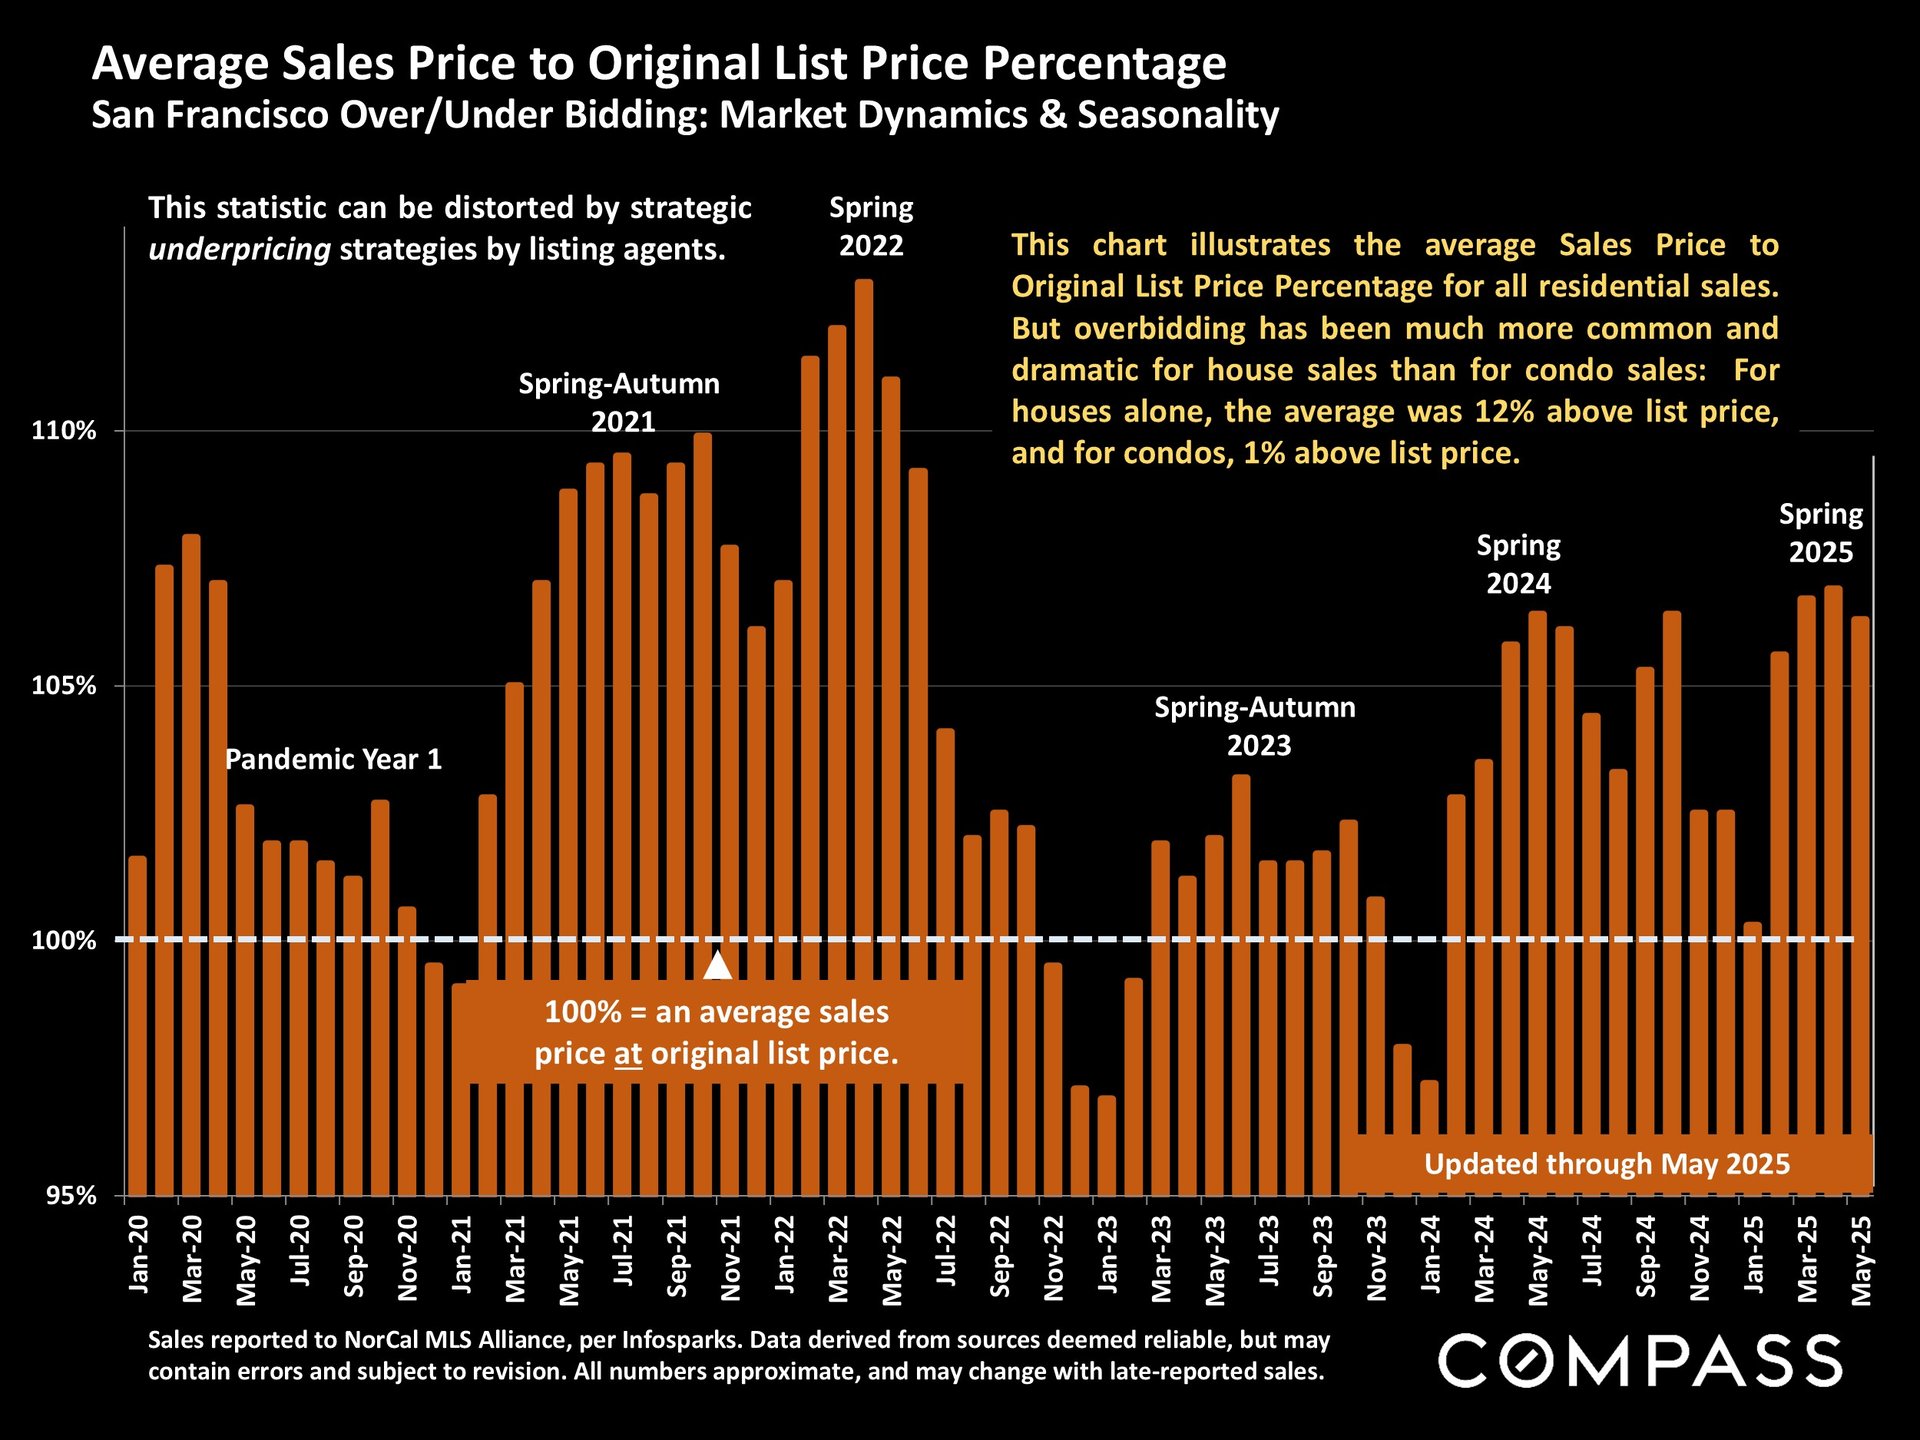
San Francisco home sale price chart, showing monthly averages relative to original list price from 2020 through May 2025.


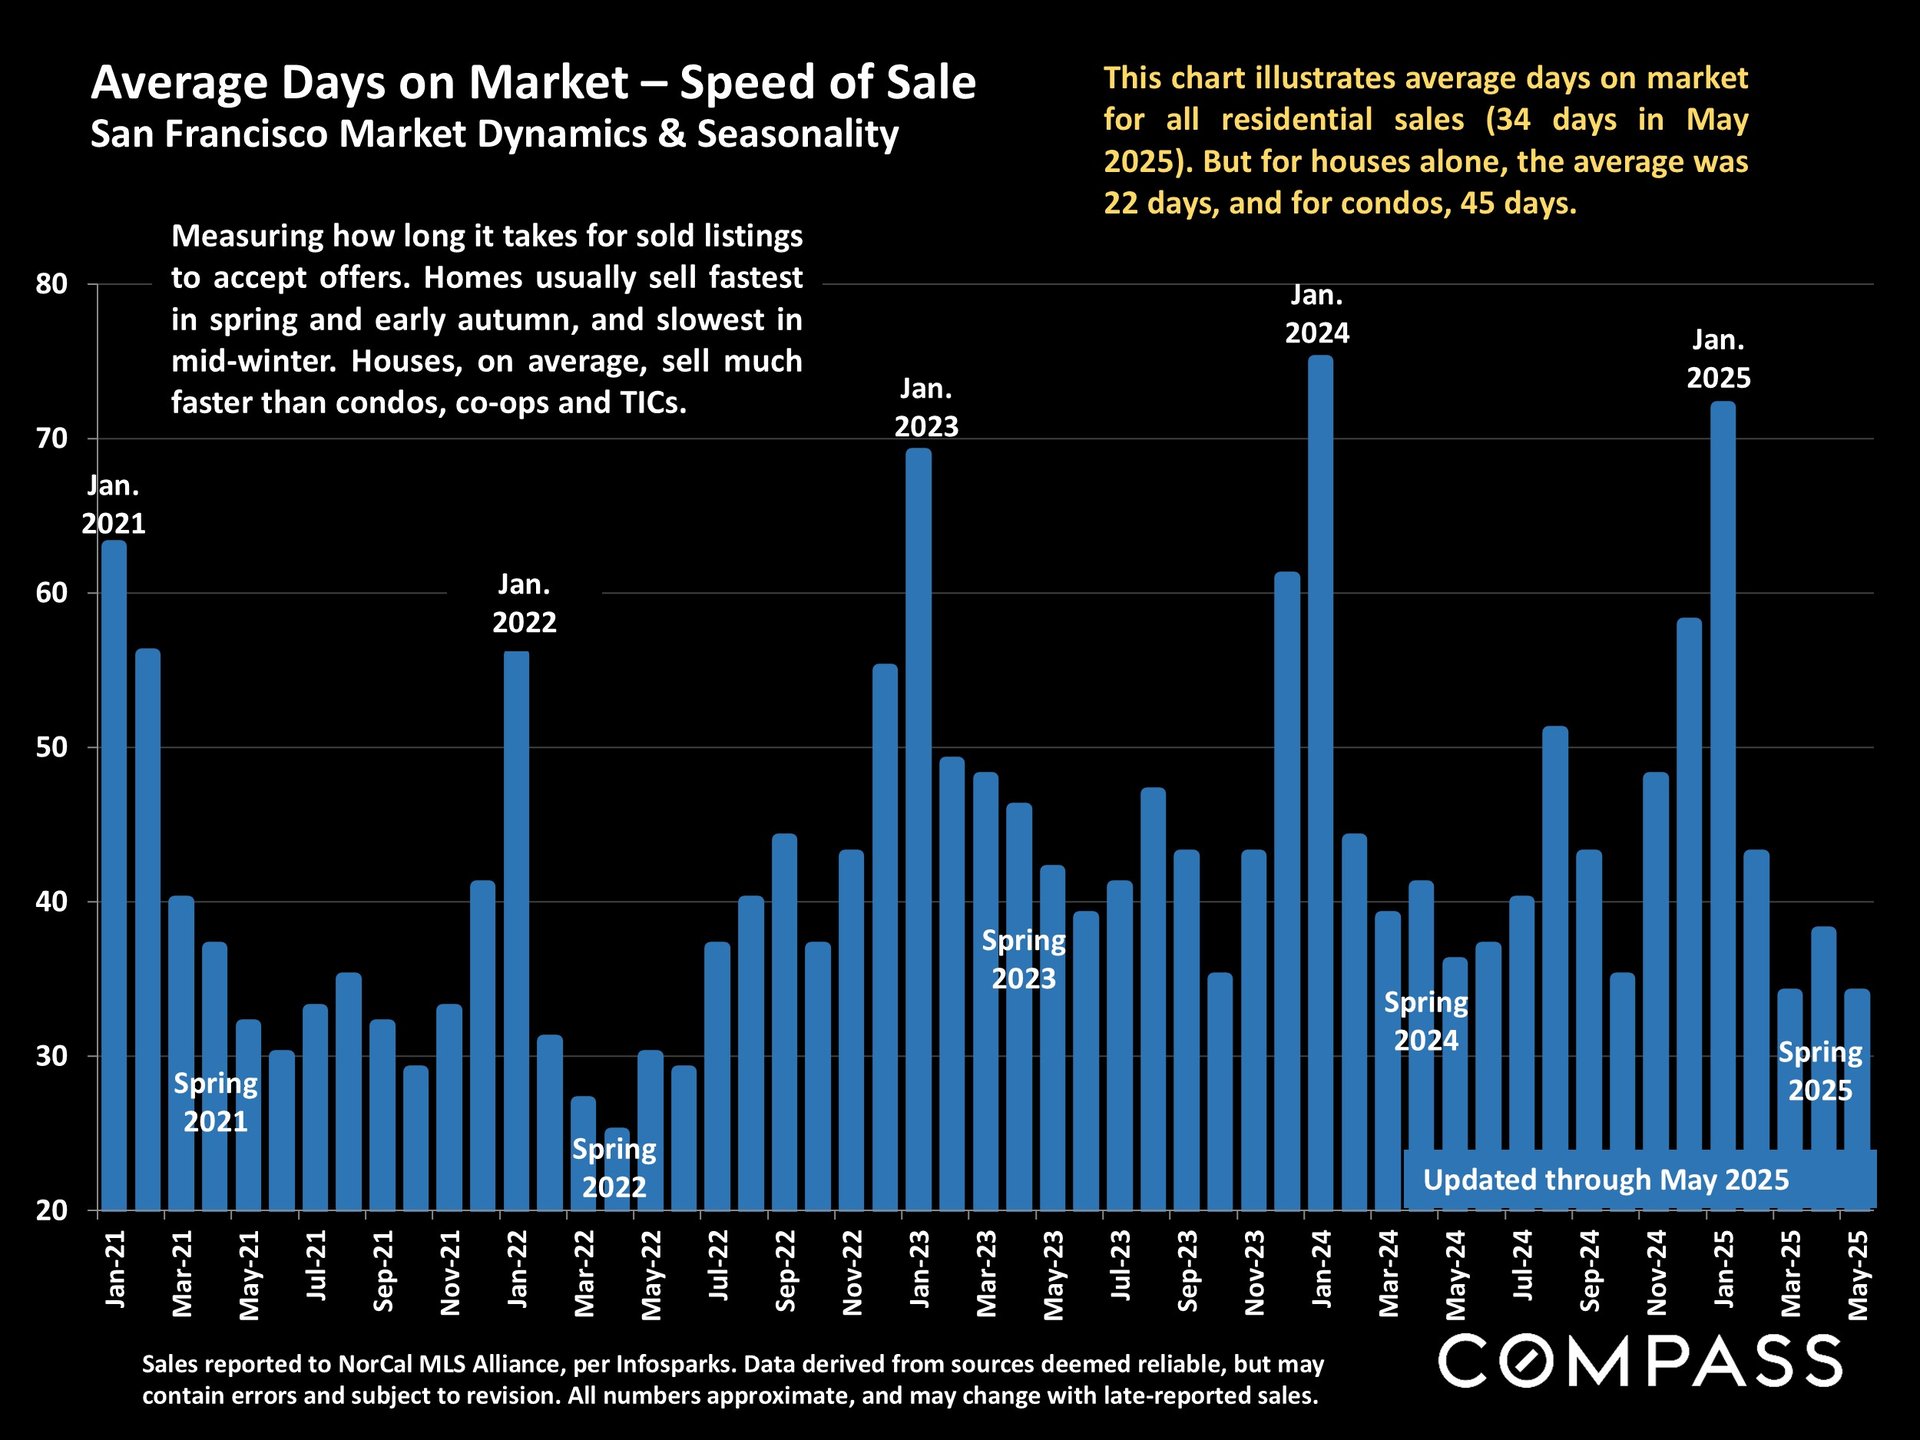
Bar chart of San Francisco average days on market, January 2021 to May 2025, highlighting seasonal sales patterns.


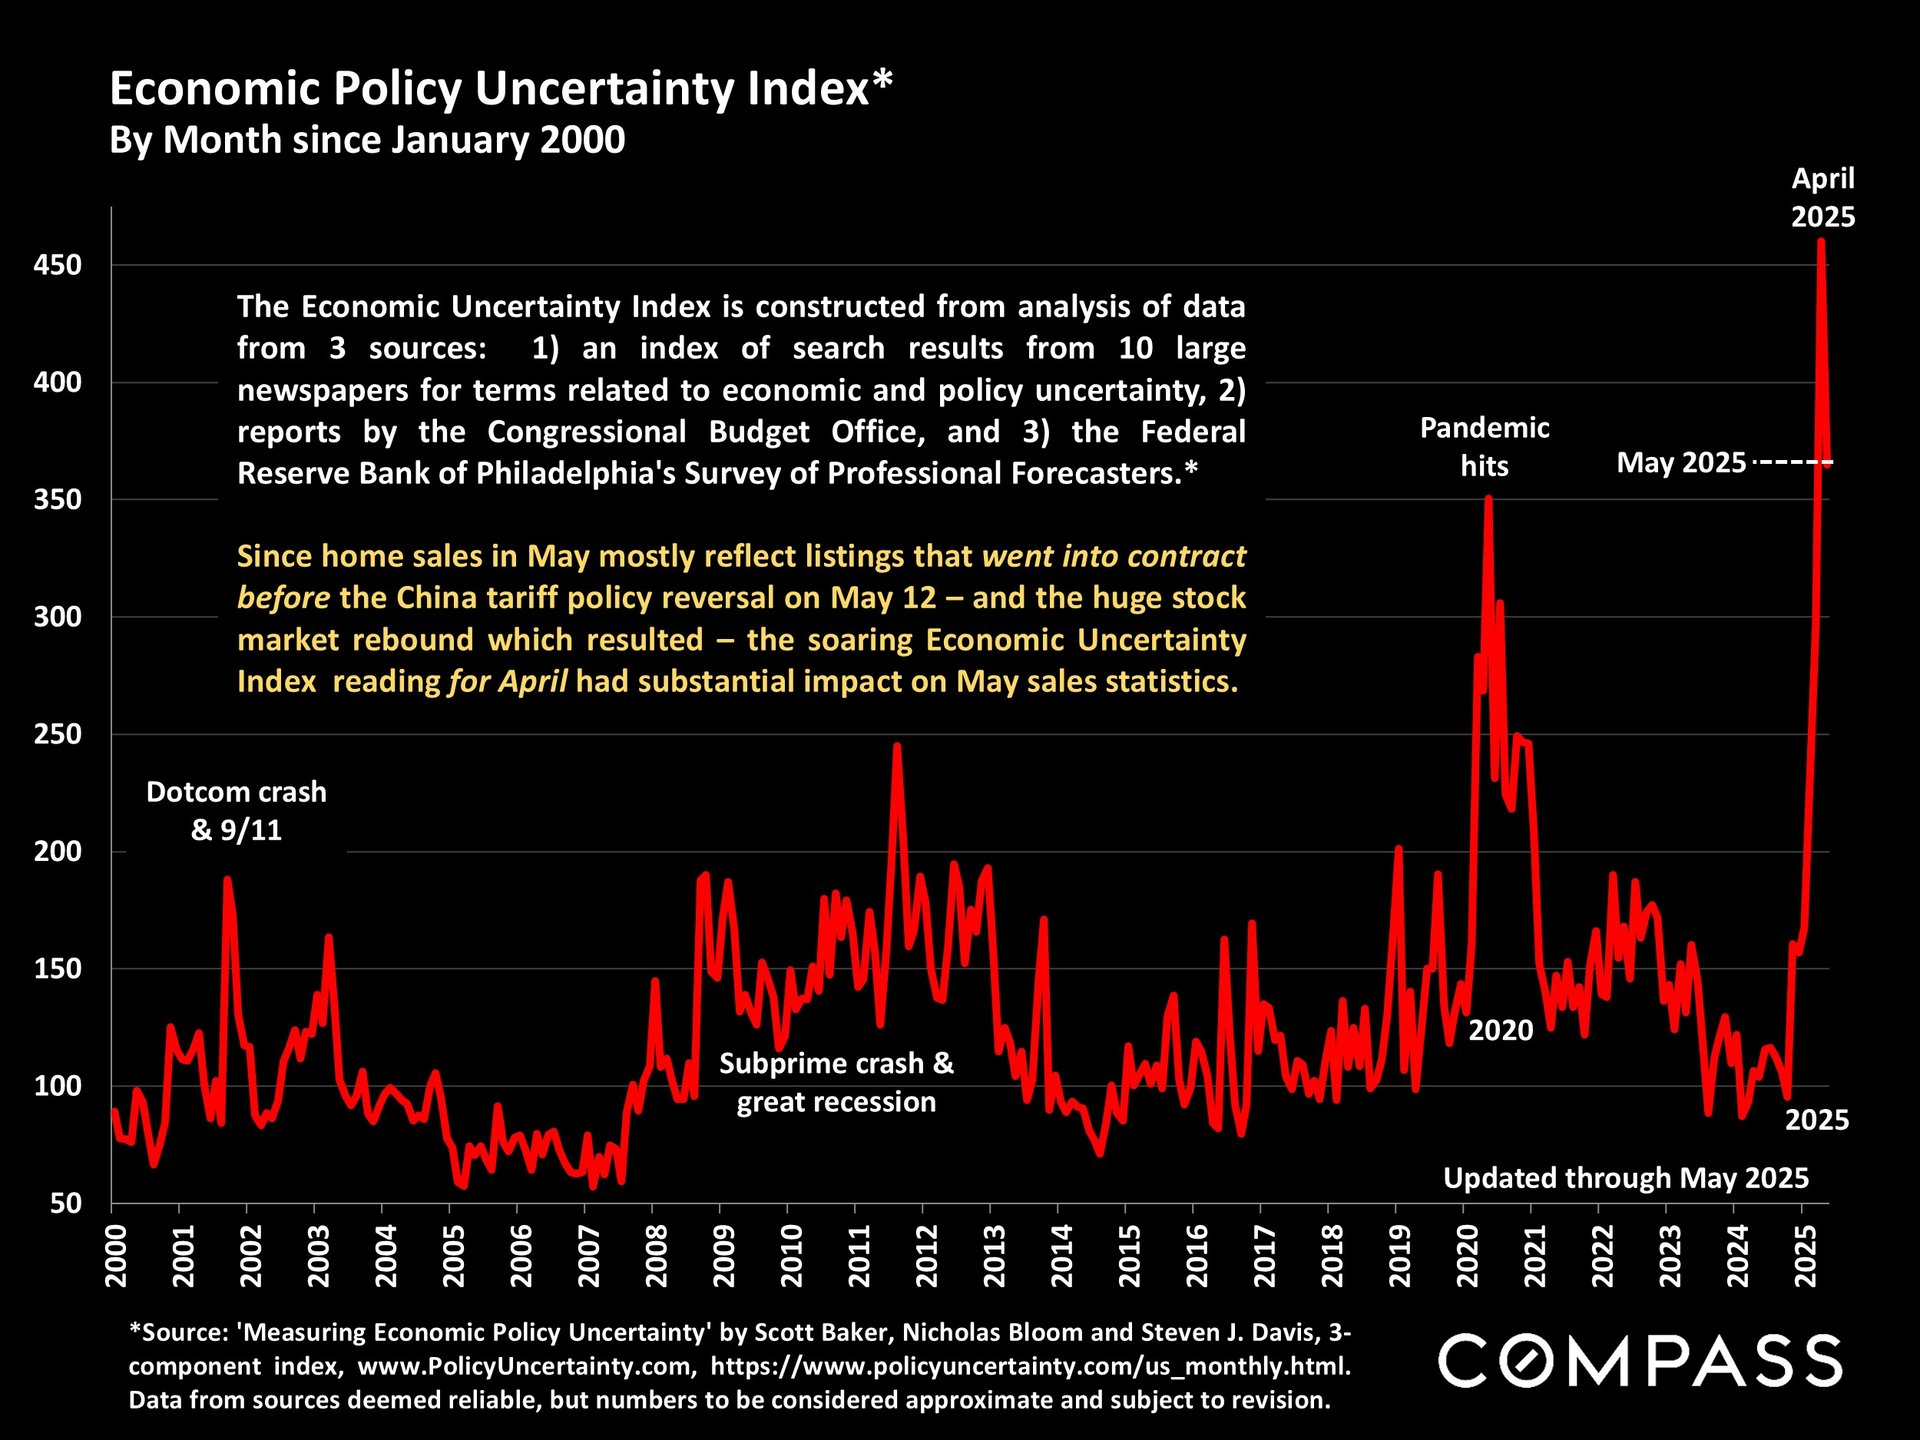
Economic Policy Uncertainty Index chart from 2000 to May 2025, with a sharp April 2025 spike.


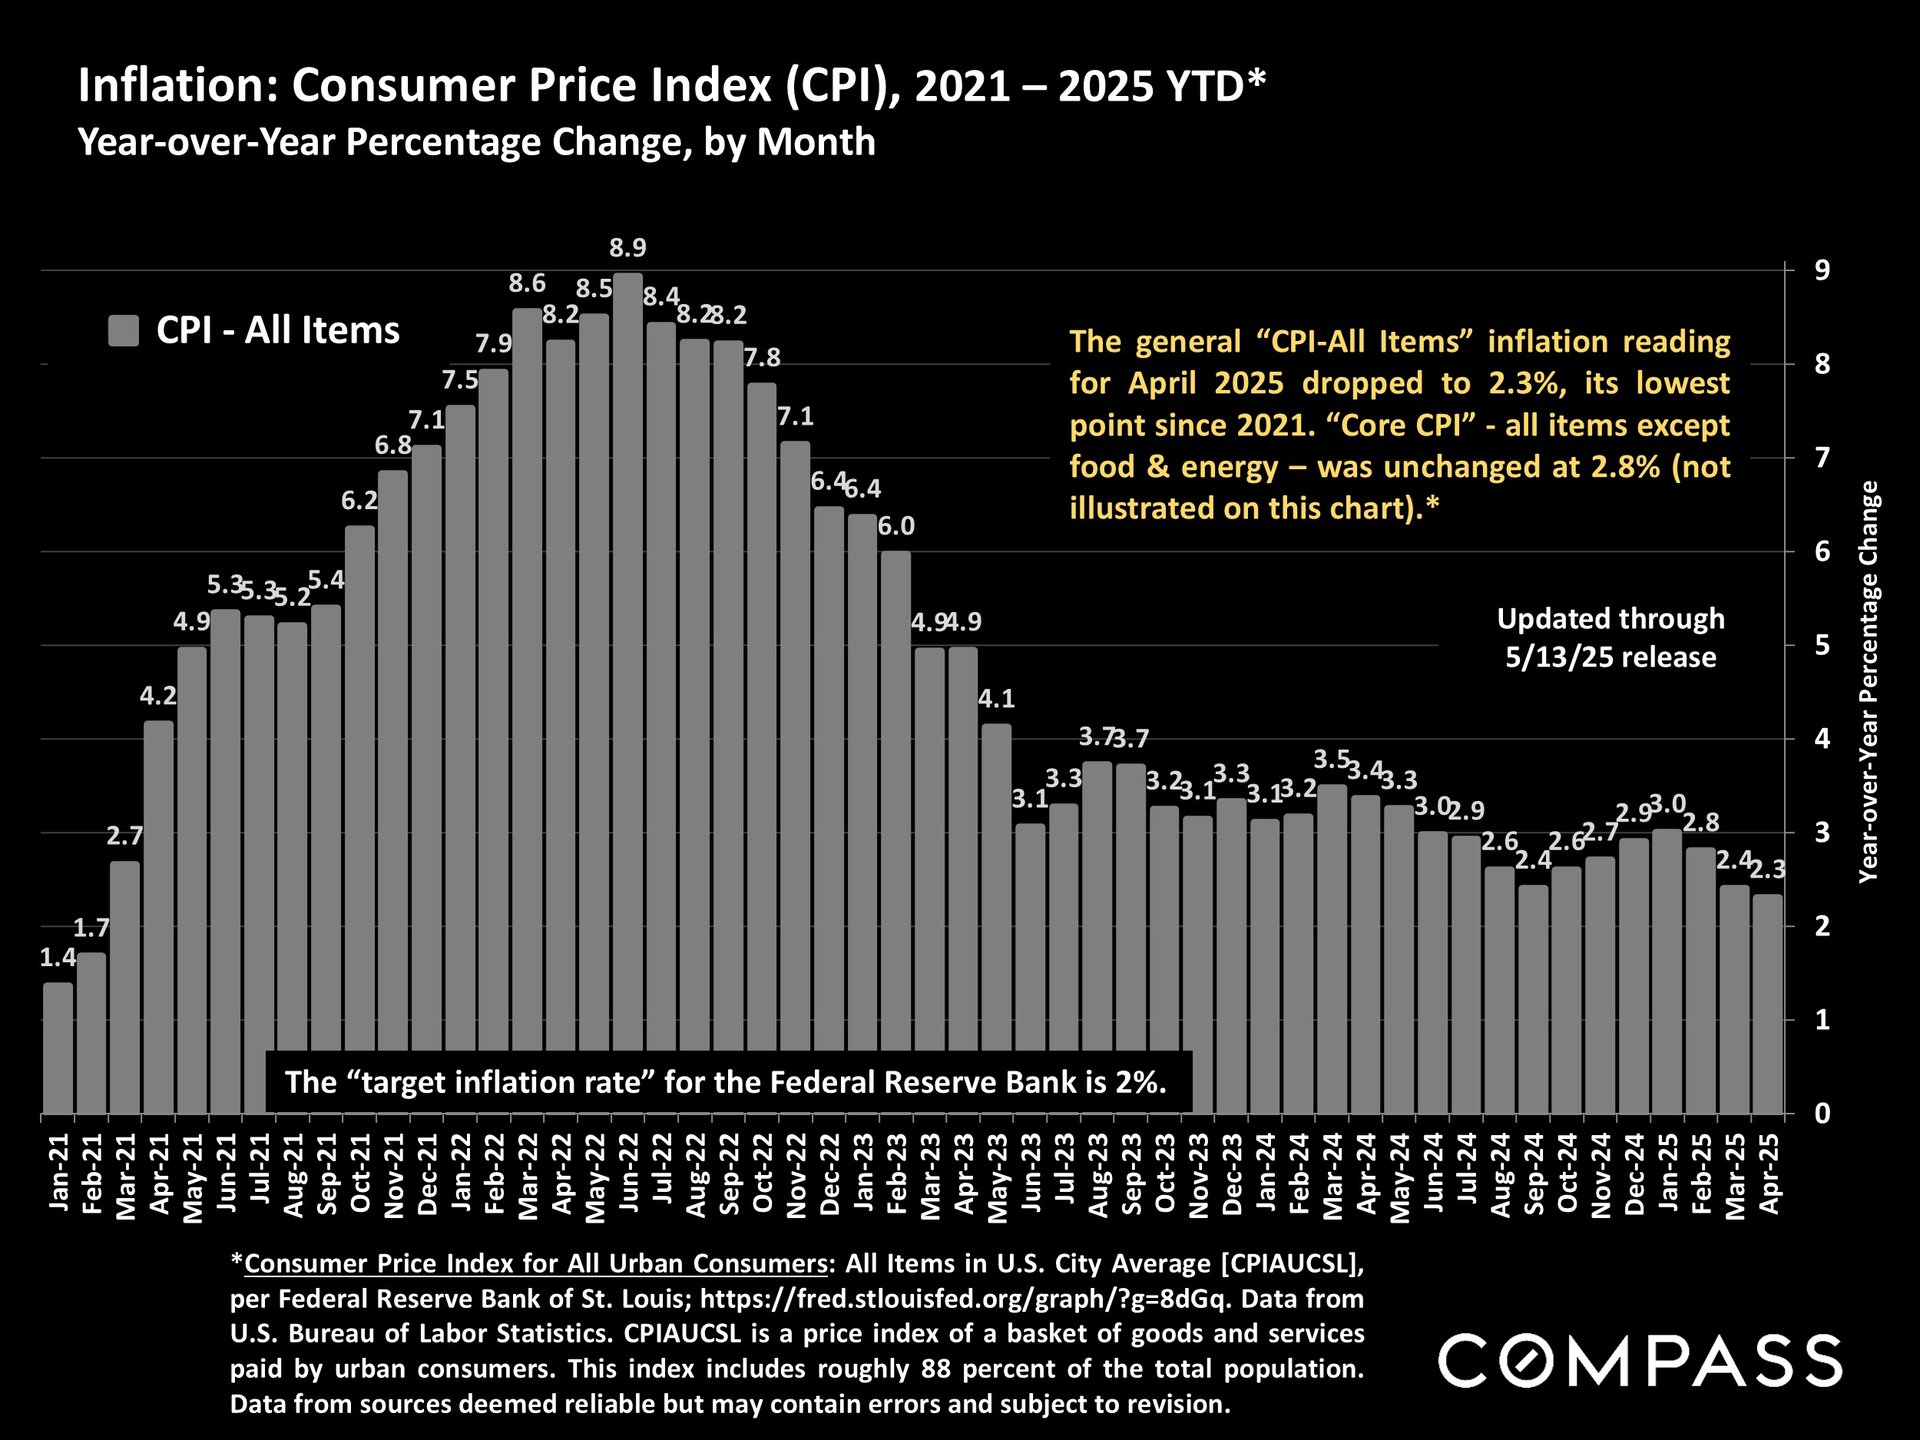
CPI inflation bar chart, January 2021–April 2025, peaking at 8.9% and ending at 2.3%.


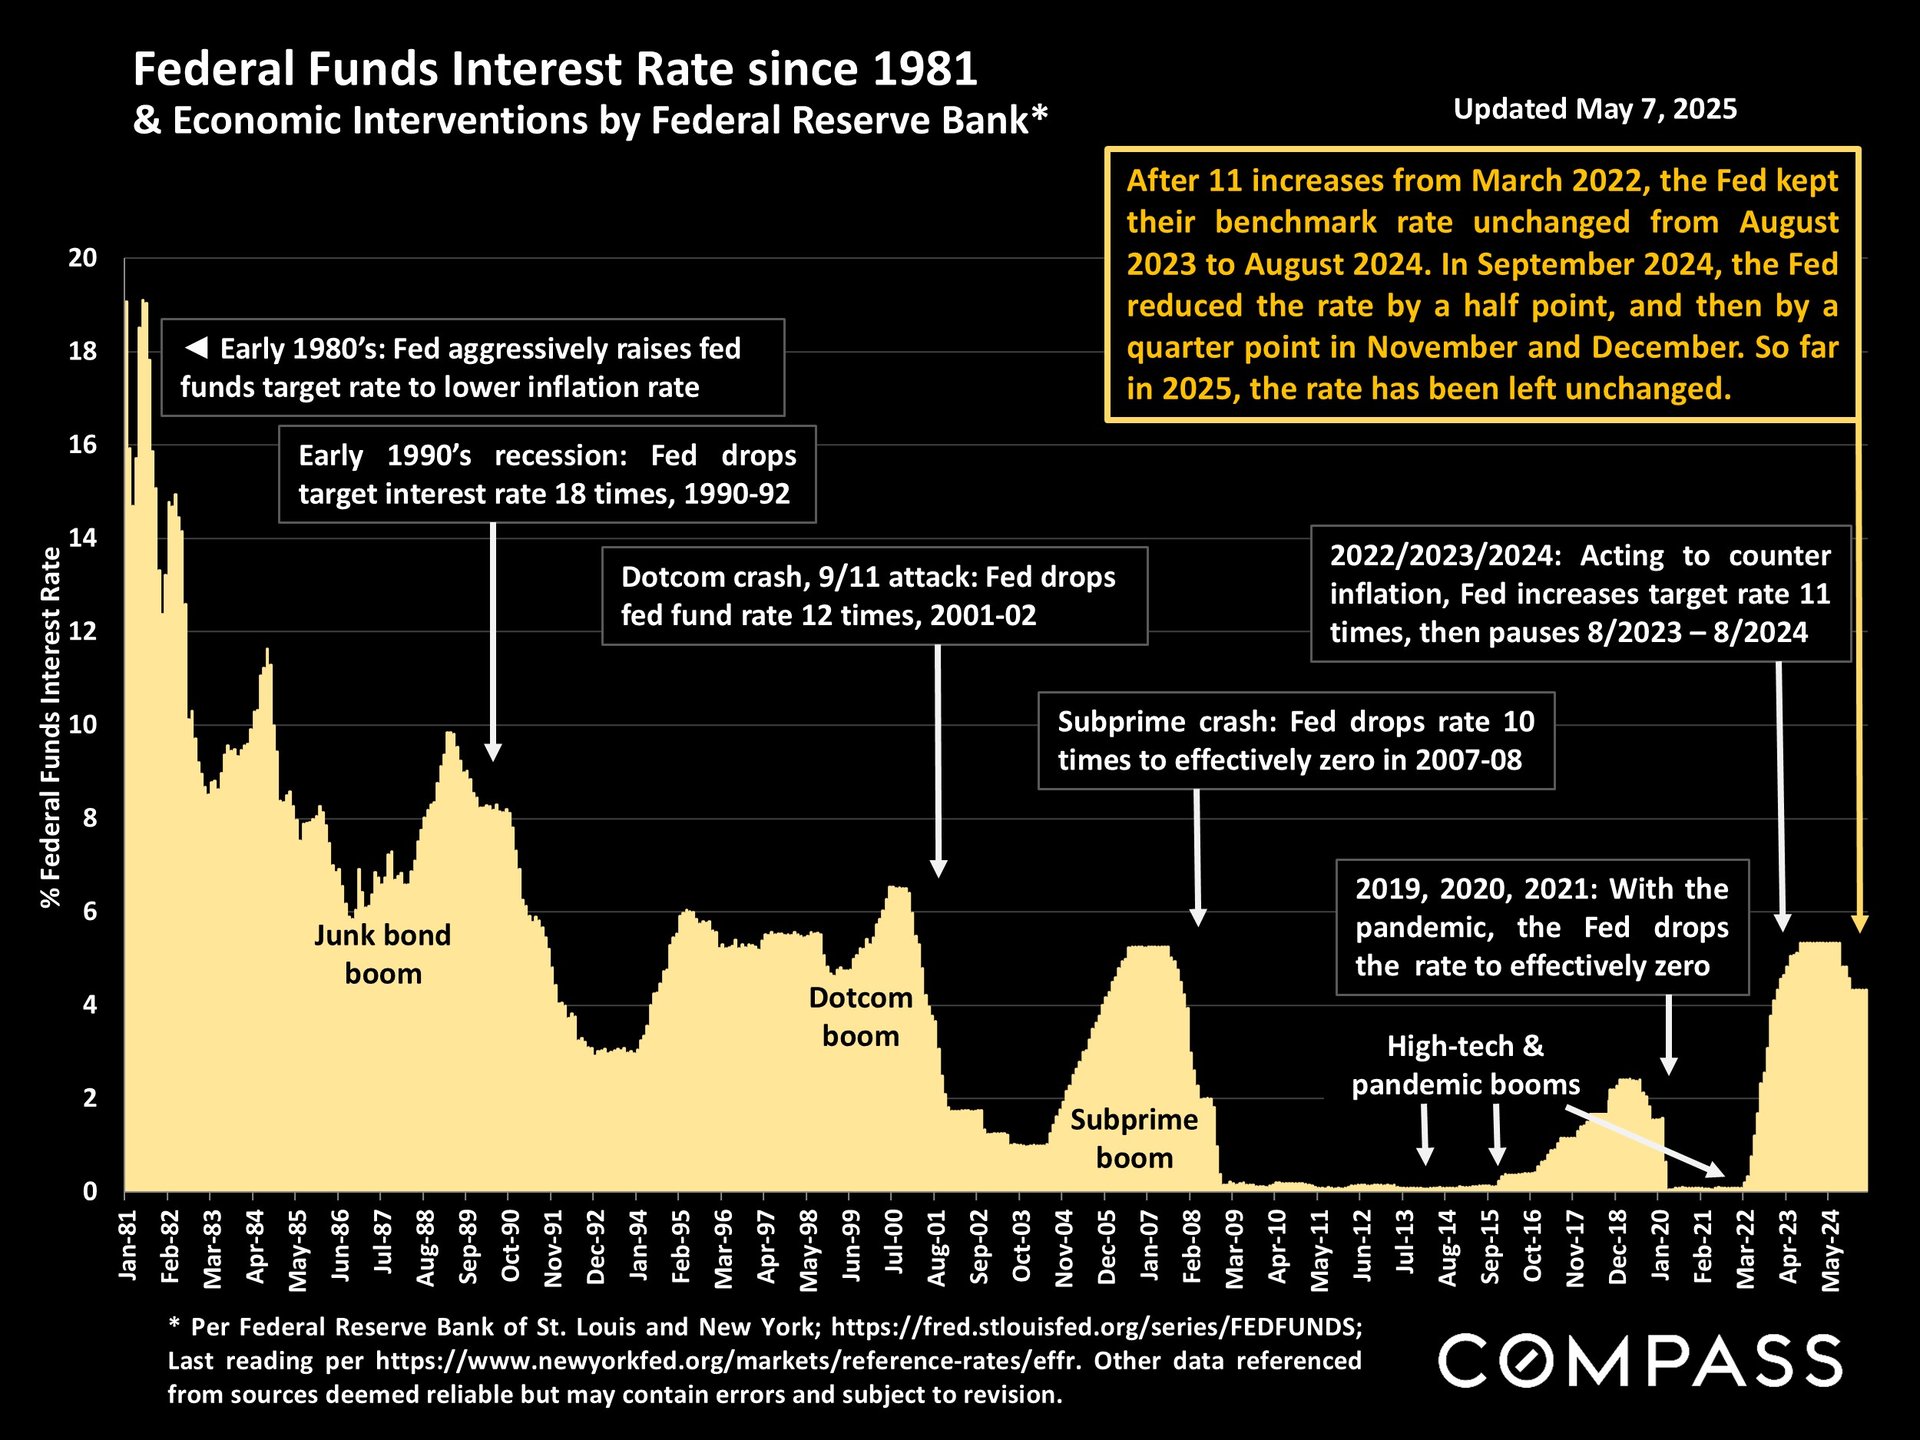
Chart of federal funds interest rates from 1981 to 2024, with annotations on Fed actions and economic events.


Market report disclosure explaining statistics, valuation measures, photo licensing, and Compass disclaimers.

Work With Us

We pride ourselves in providing personalized solutions that bring our clients closer to their dream properties and enhance their long-term wealth.
Contact Us

Follow Us On Instagram