Blog

San Mateo 2025 May Market Update

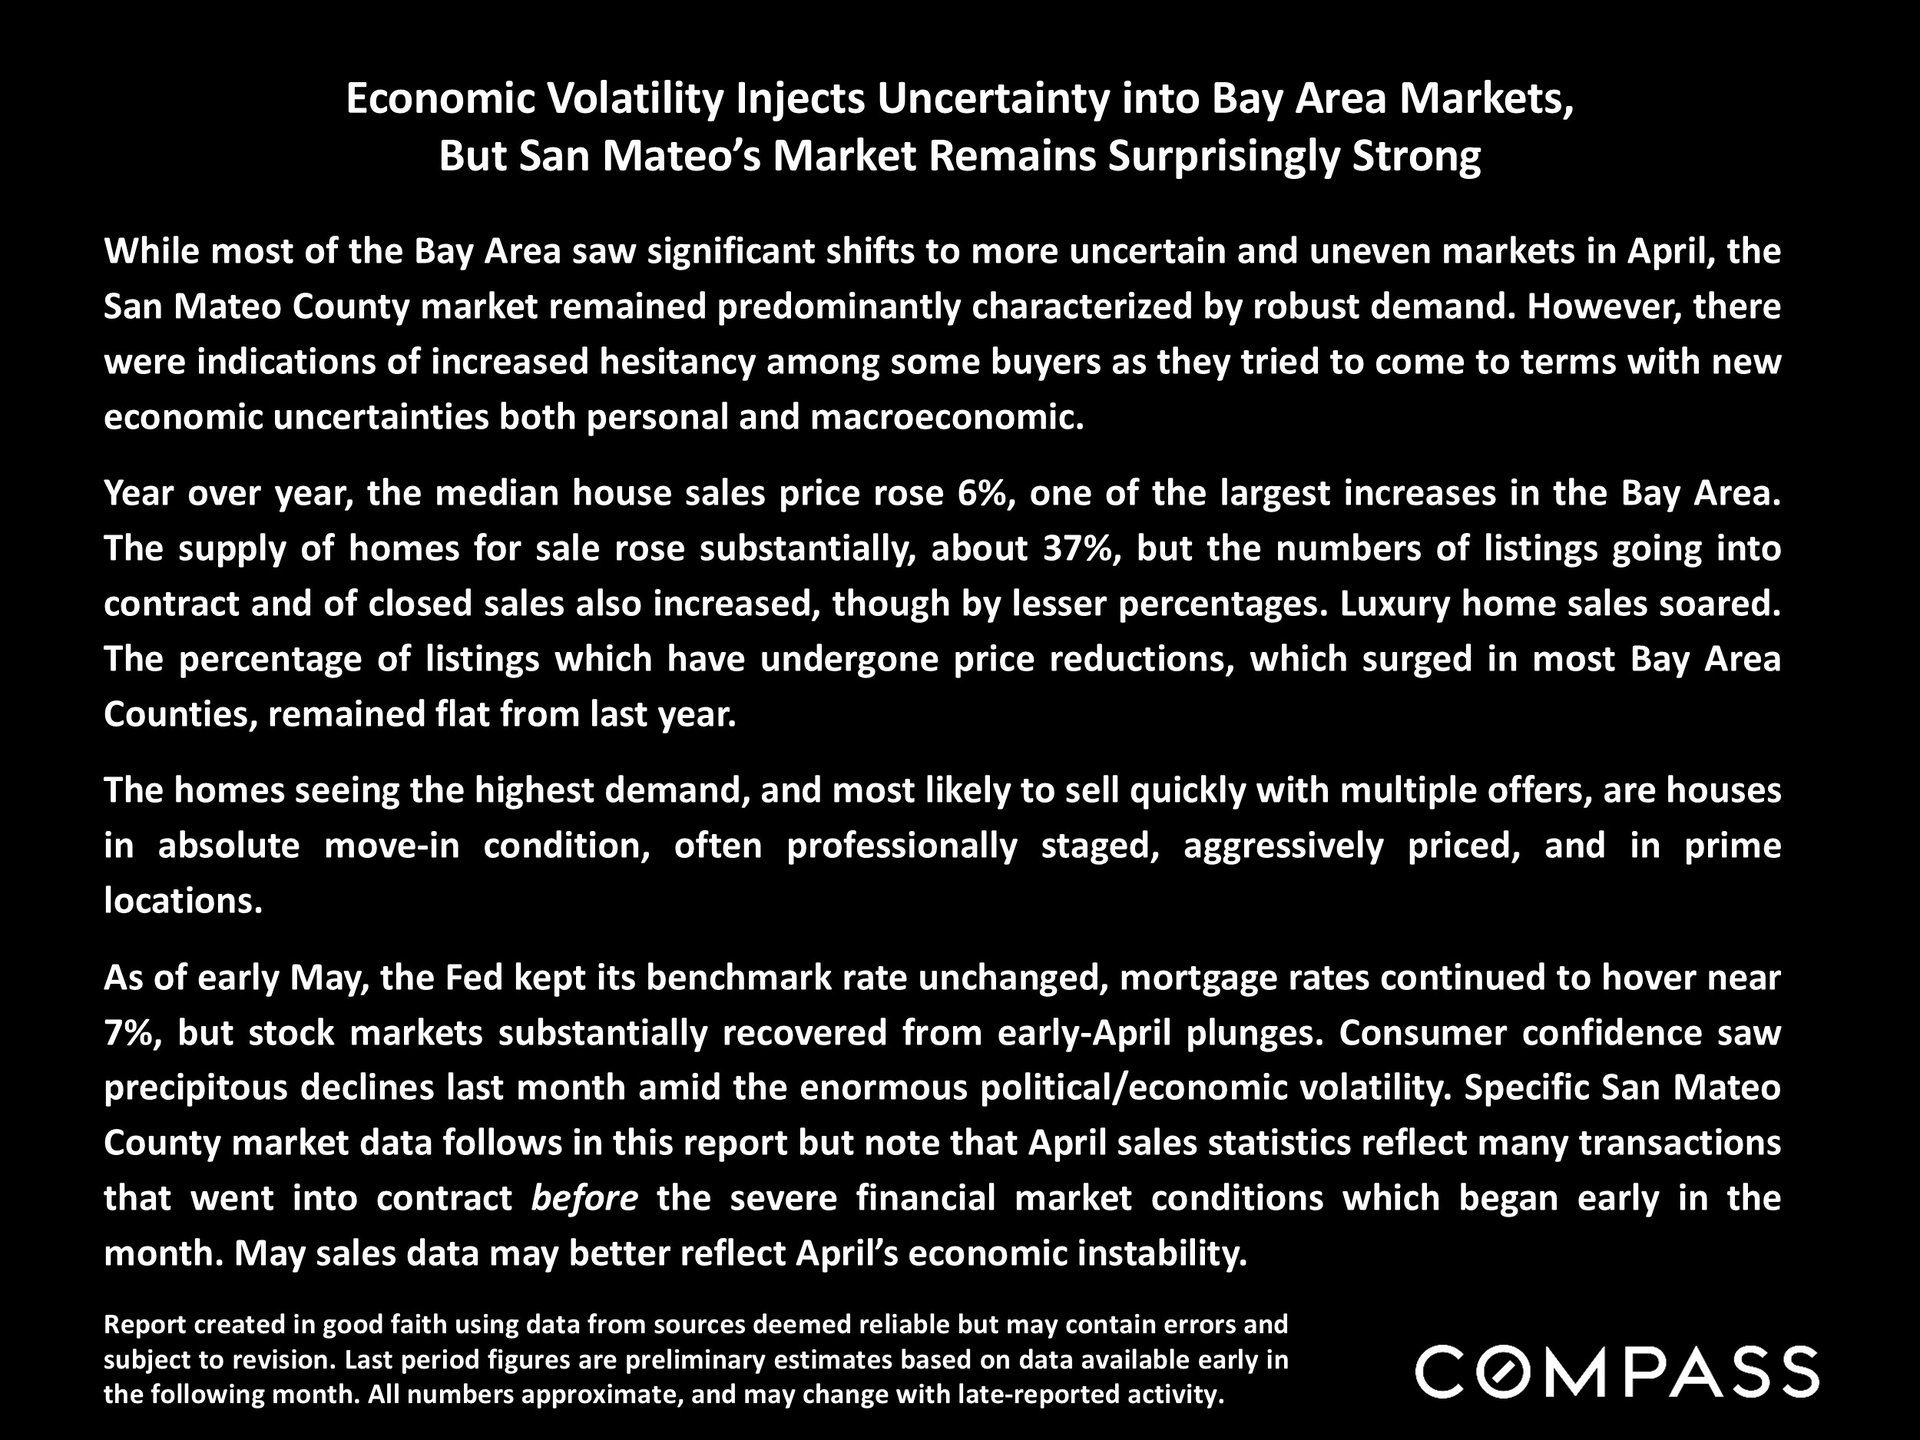
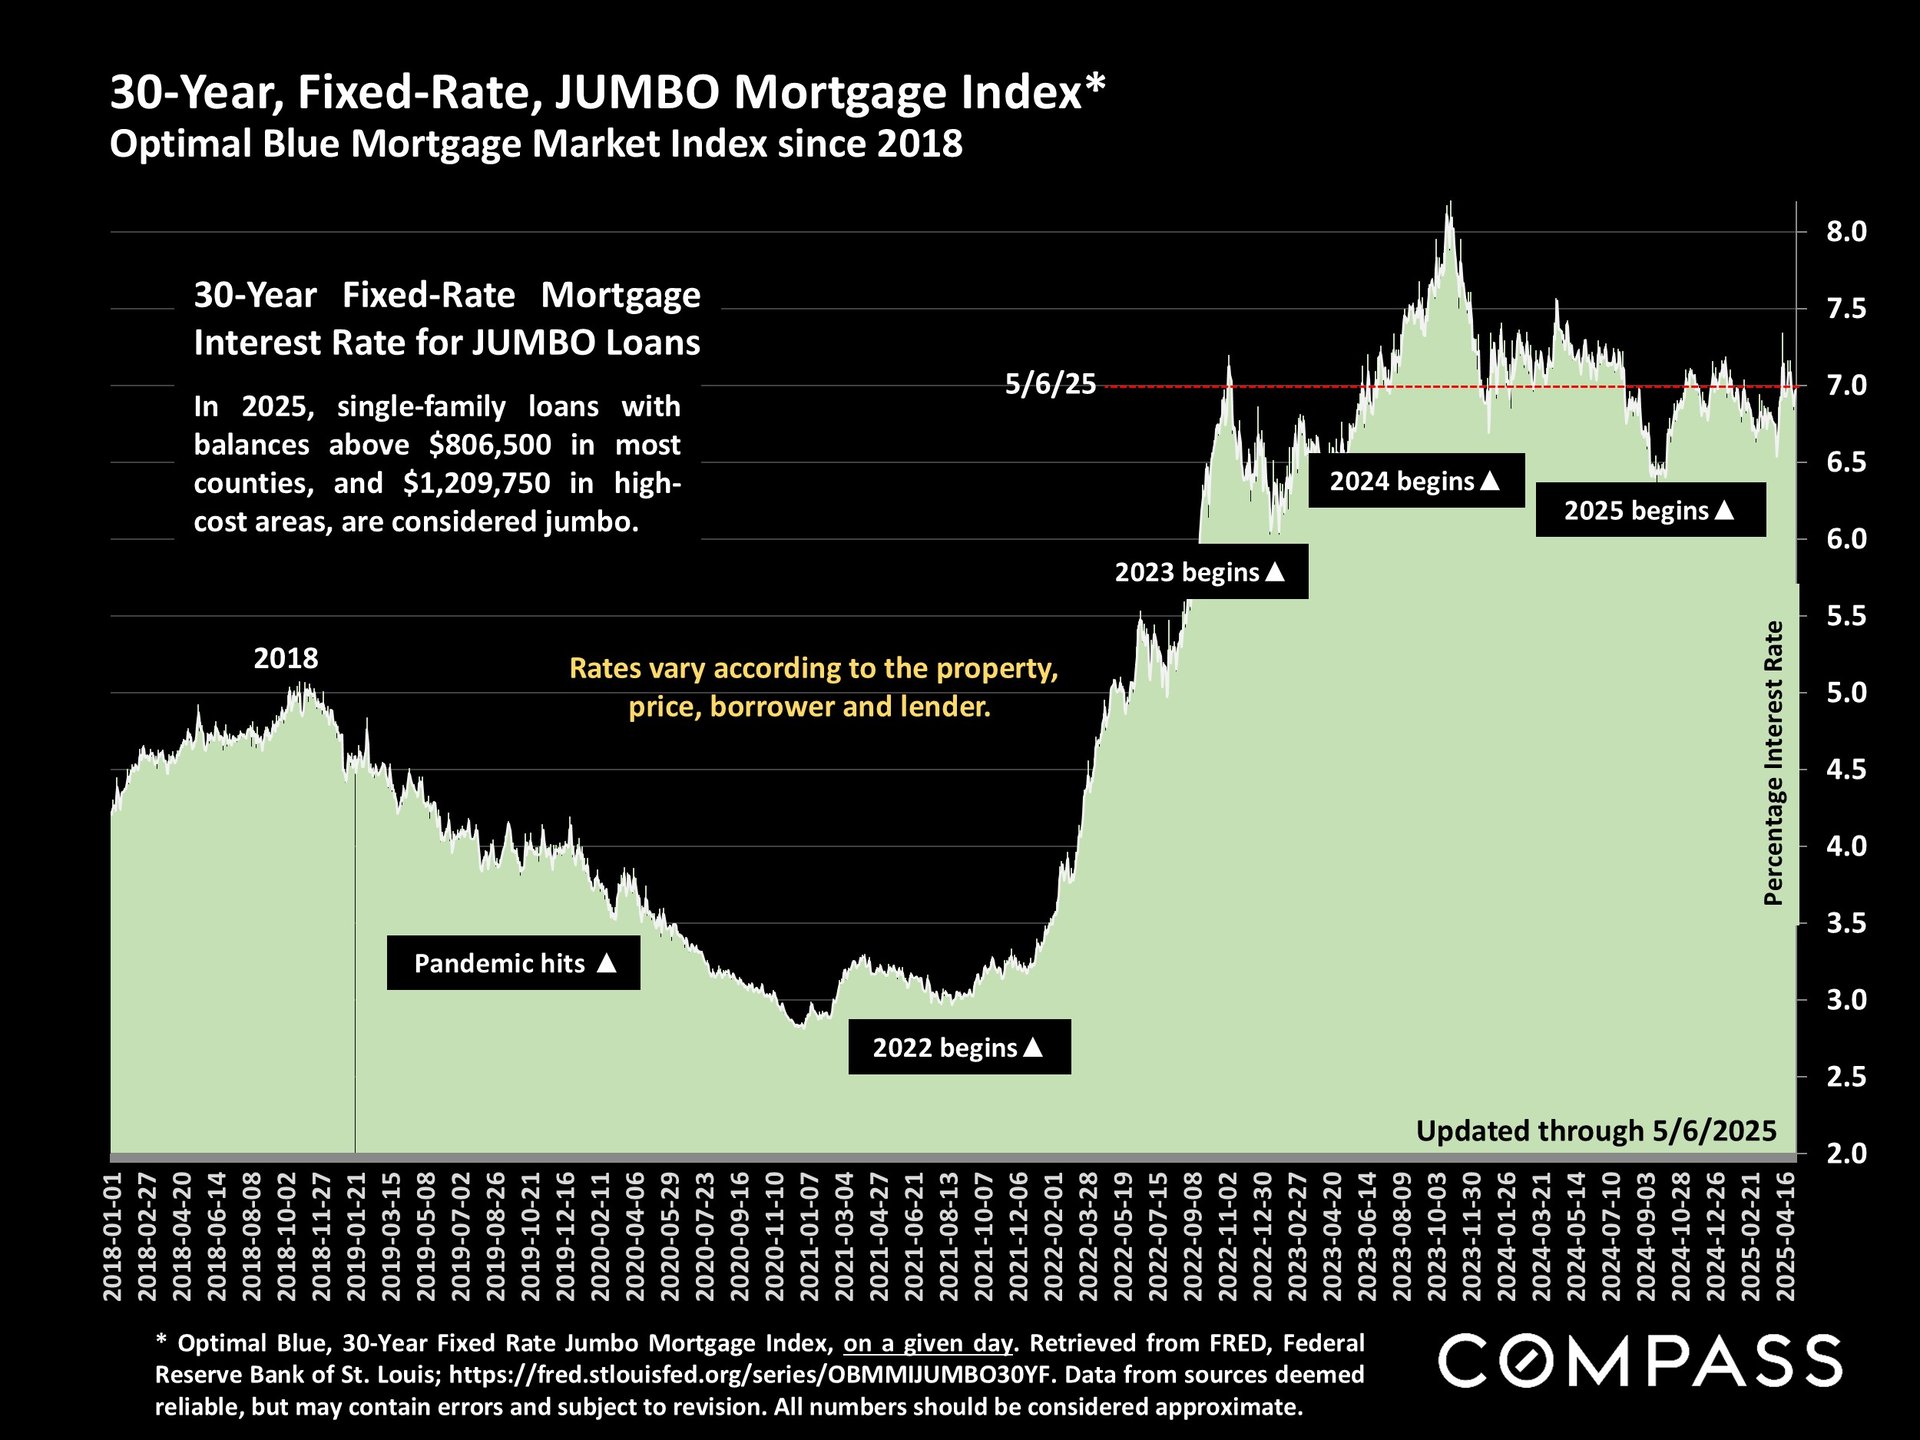
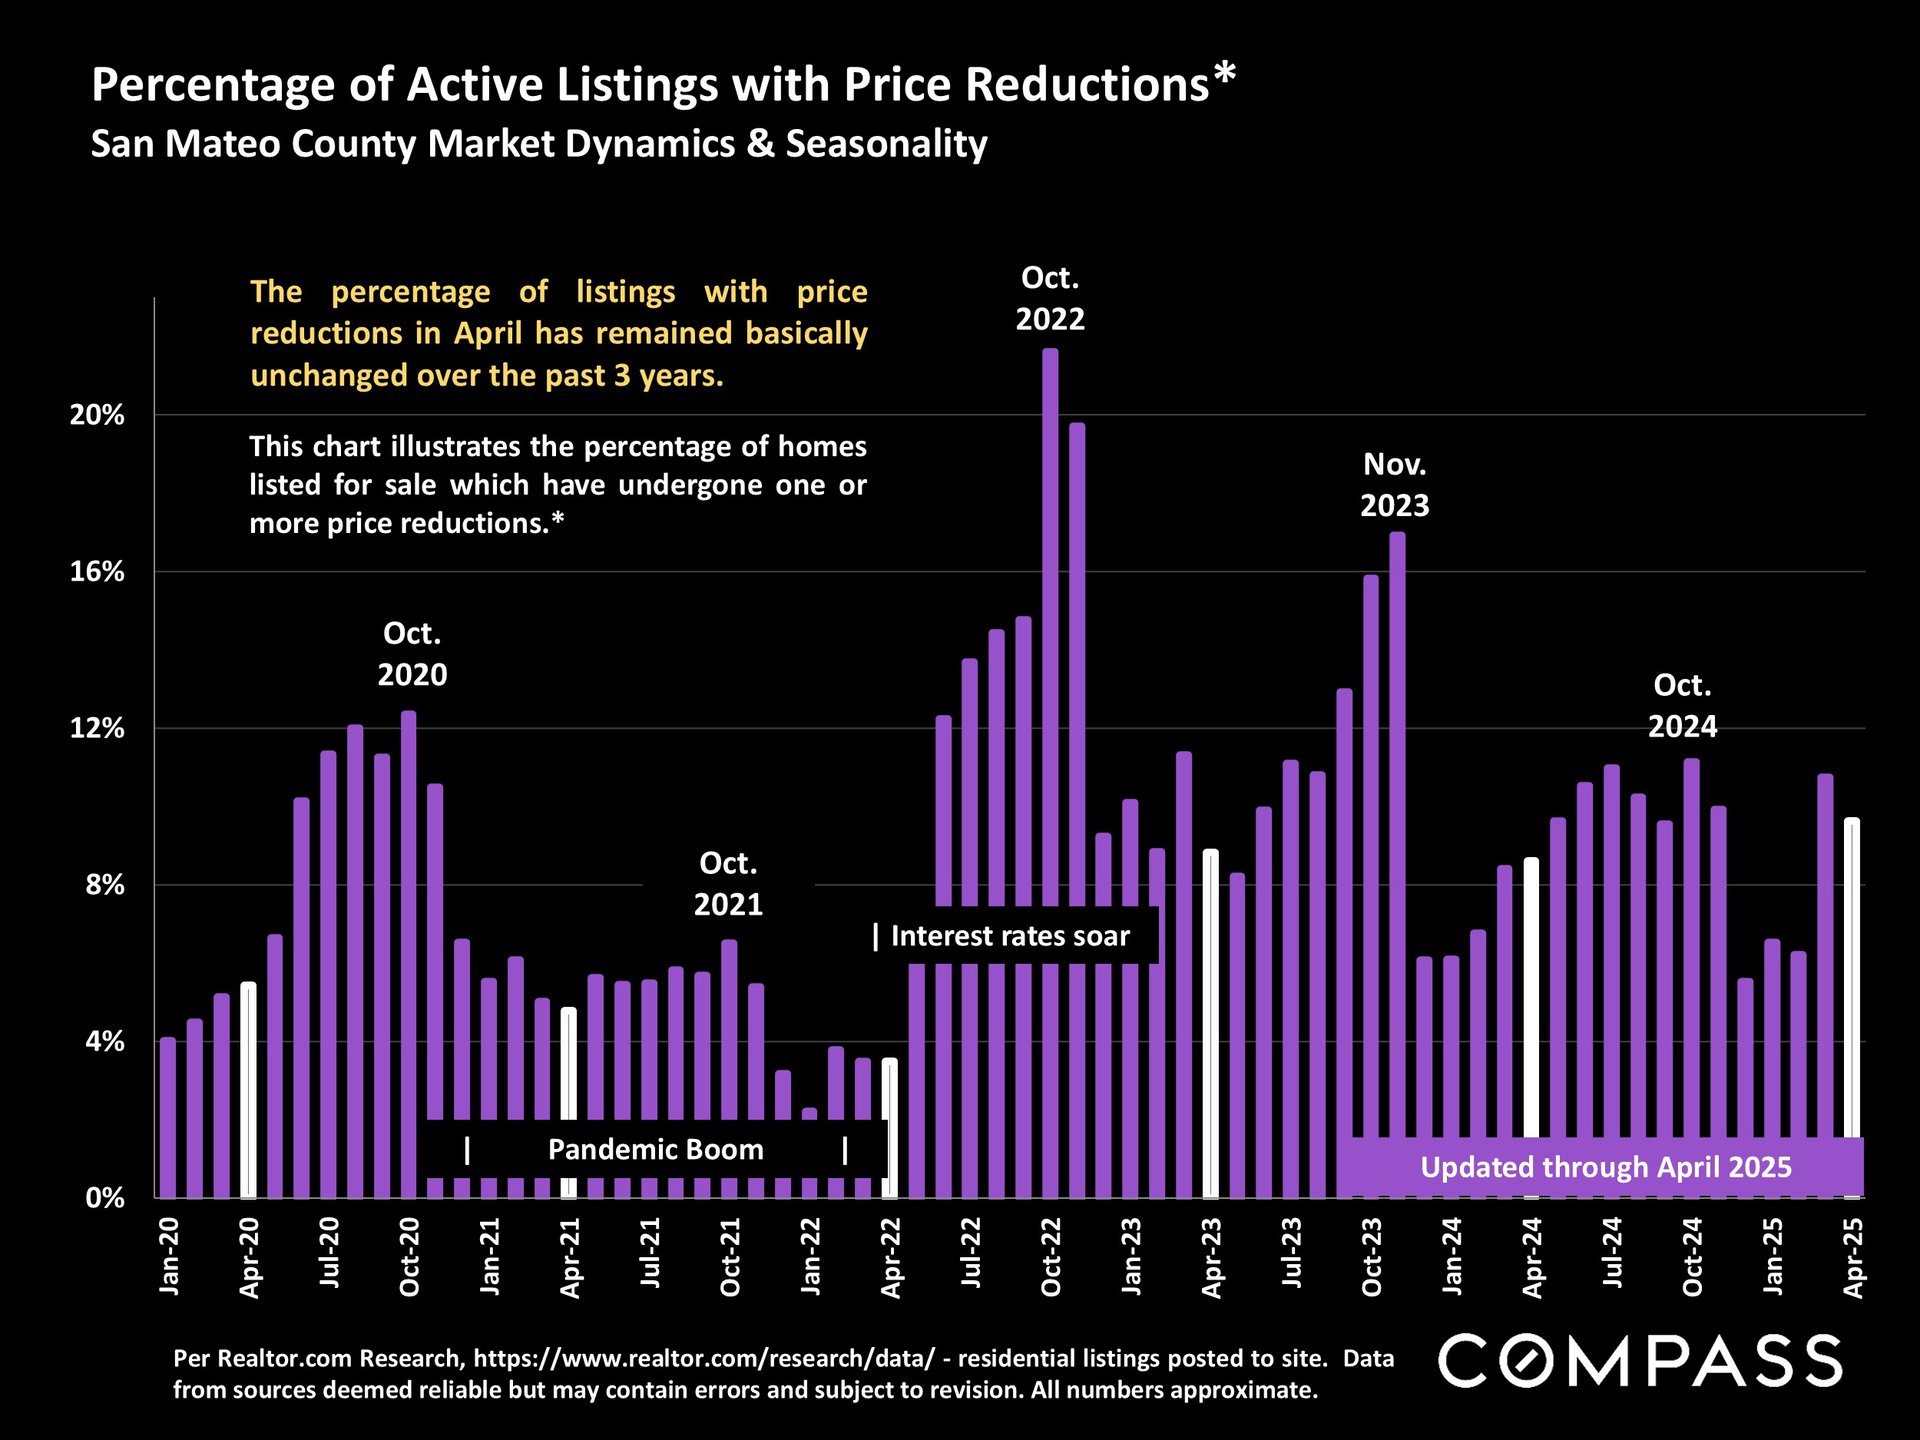
While most of the Bay Area saw significant shifts to more uncertain and uneven markets in April, the San Mateo County market predominantly remained characterized by robust demand. However, there were indications of increased hesitancy among some buyers as they tried to come to terms with new economic uncertainties both personal and macroeconomic. Year over year, the median house sales price rose 6%, one of the largest increases in the Bay Area. The supply of homes for sale rose substantially, about 37%, but the numbers of listings going into contract and of closed sales also increased, though by lesser percentages. Luxury home sales soared. The percentage of listings which have undergone price reductions, which surged in most Bay Area Counties, remained flat from last year. The homes seeing the highest demand, and most likely to sell quickly with multiple offers, are houses in absolute move-in condition, often professionally staged, aggressively priced, and in prime locations. As of early May, the Fed kept its benchmark rate unchanged, mortgage rates continued to hover near 7%, but stock markets substantially recovered from early-April plunges. Consumer confidence saw precipitous declines last month amid the enormous political/economic volatility. Specific San Mateo County market data follows in this report but note that April sales statistics reflect many transactions that went into contract before the severe financial market conditions which began early in the month. May sales data may better reflect April’s economic instability.

San Mateo County real estate May 2025 report cover with an aerial view of a winding road through hills.


San Mateo market update reports rising prices and inventory amid economic uncertainty.


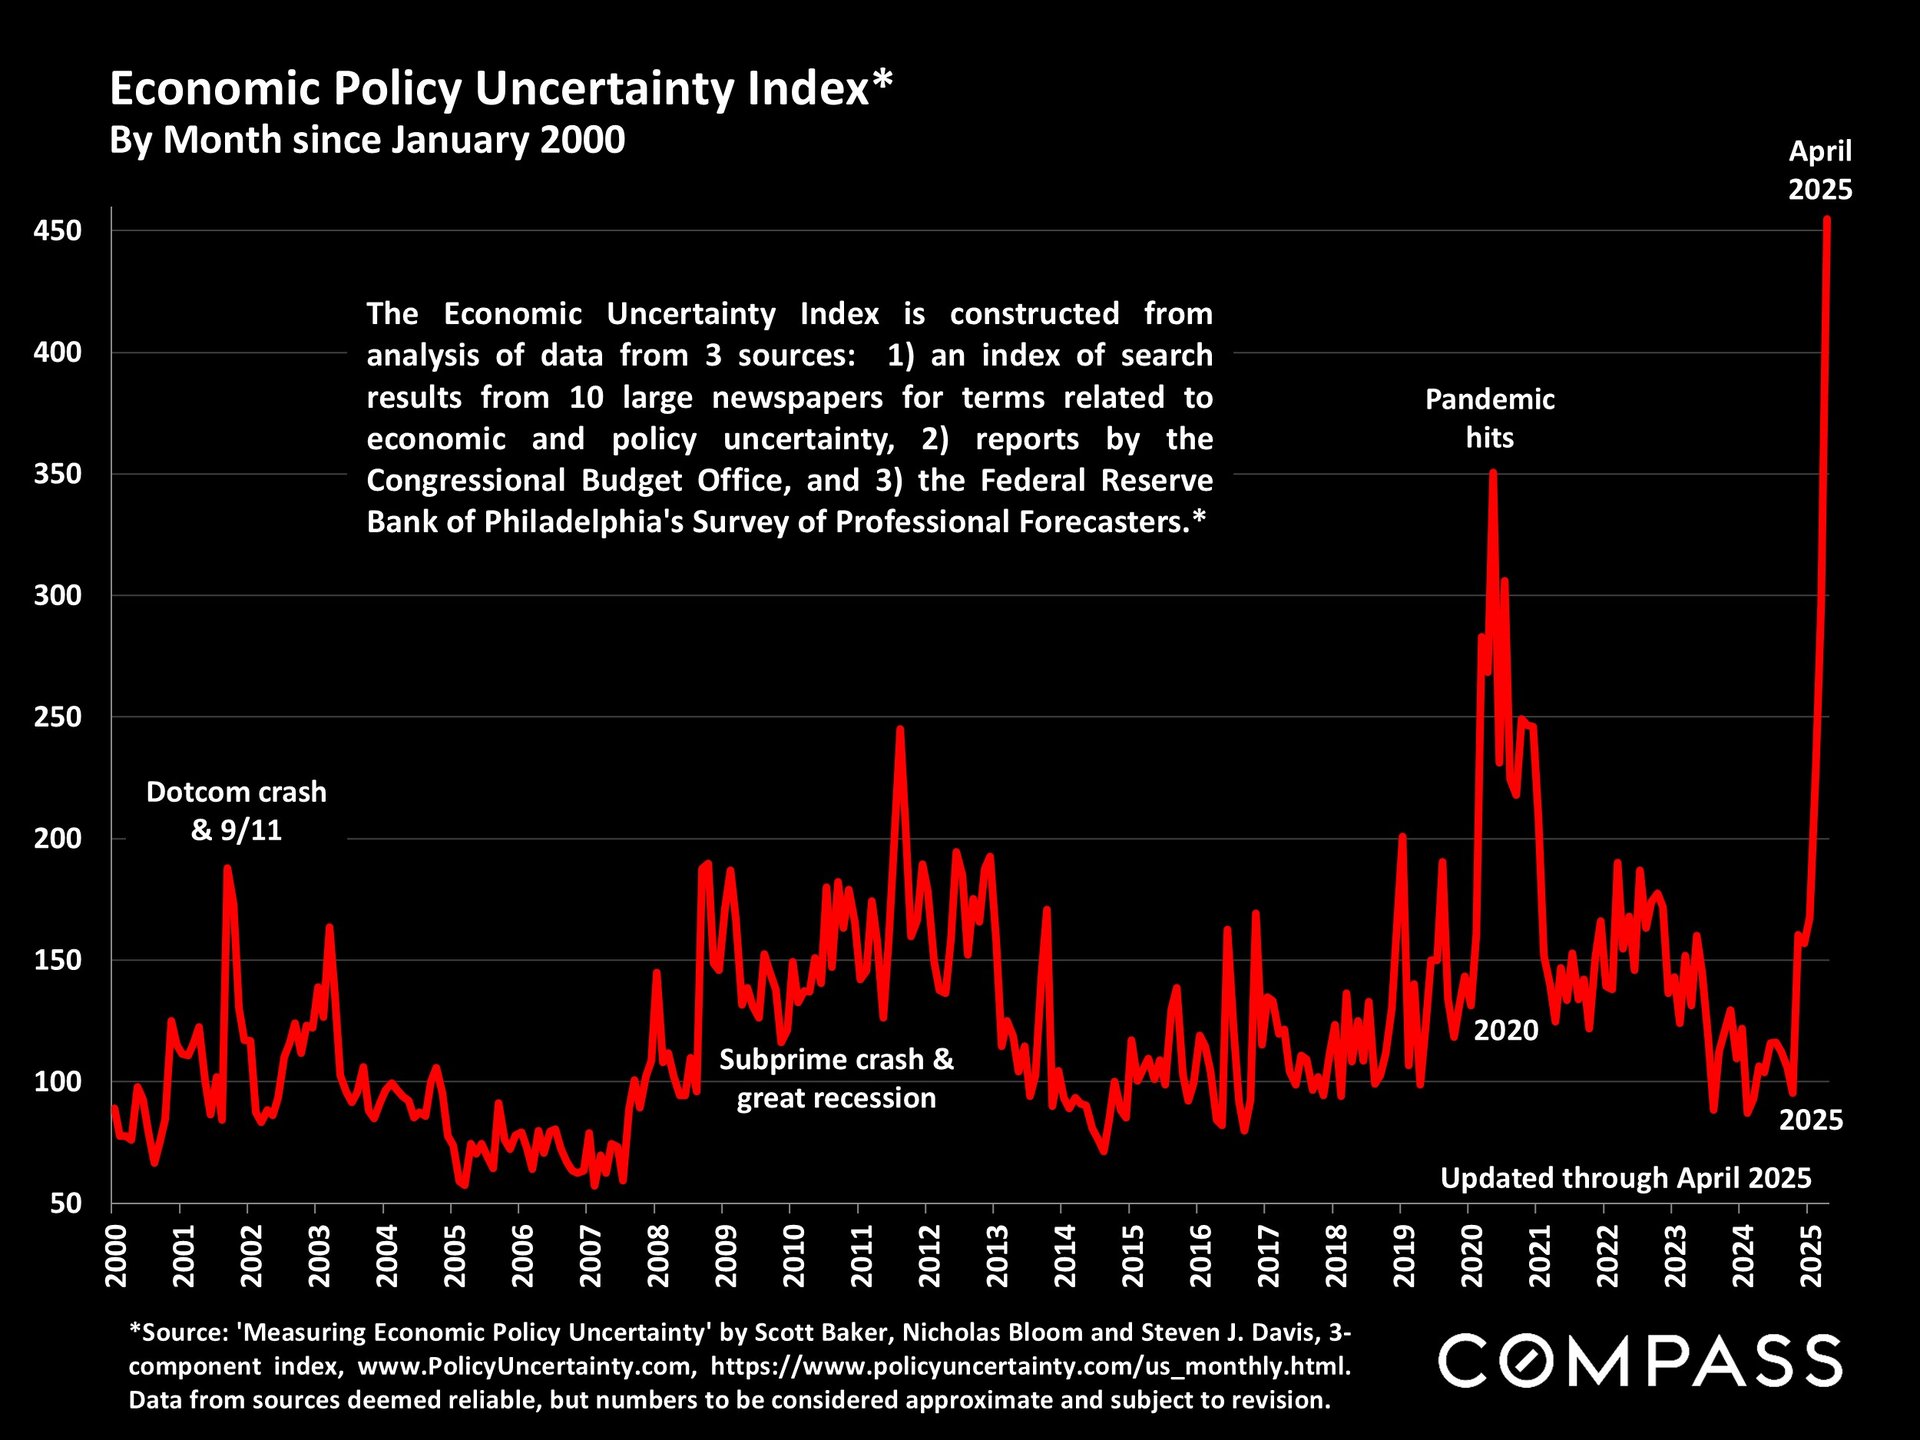
Economic Policy Uncertainty Index chart from 2000 to April 2025, with spikes during the pandemic and in April 2025.


Chart of jumbo mortgage interest rates from 2018 to May 2025, with rates near 7% at the latest update.


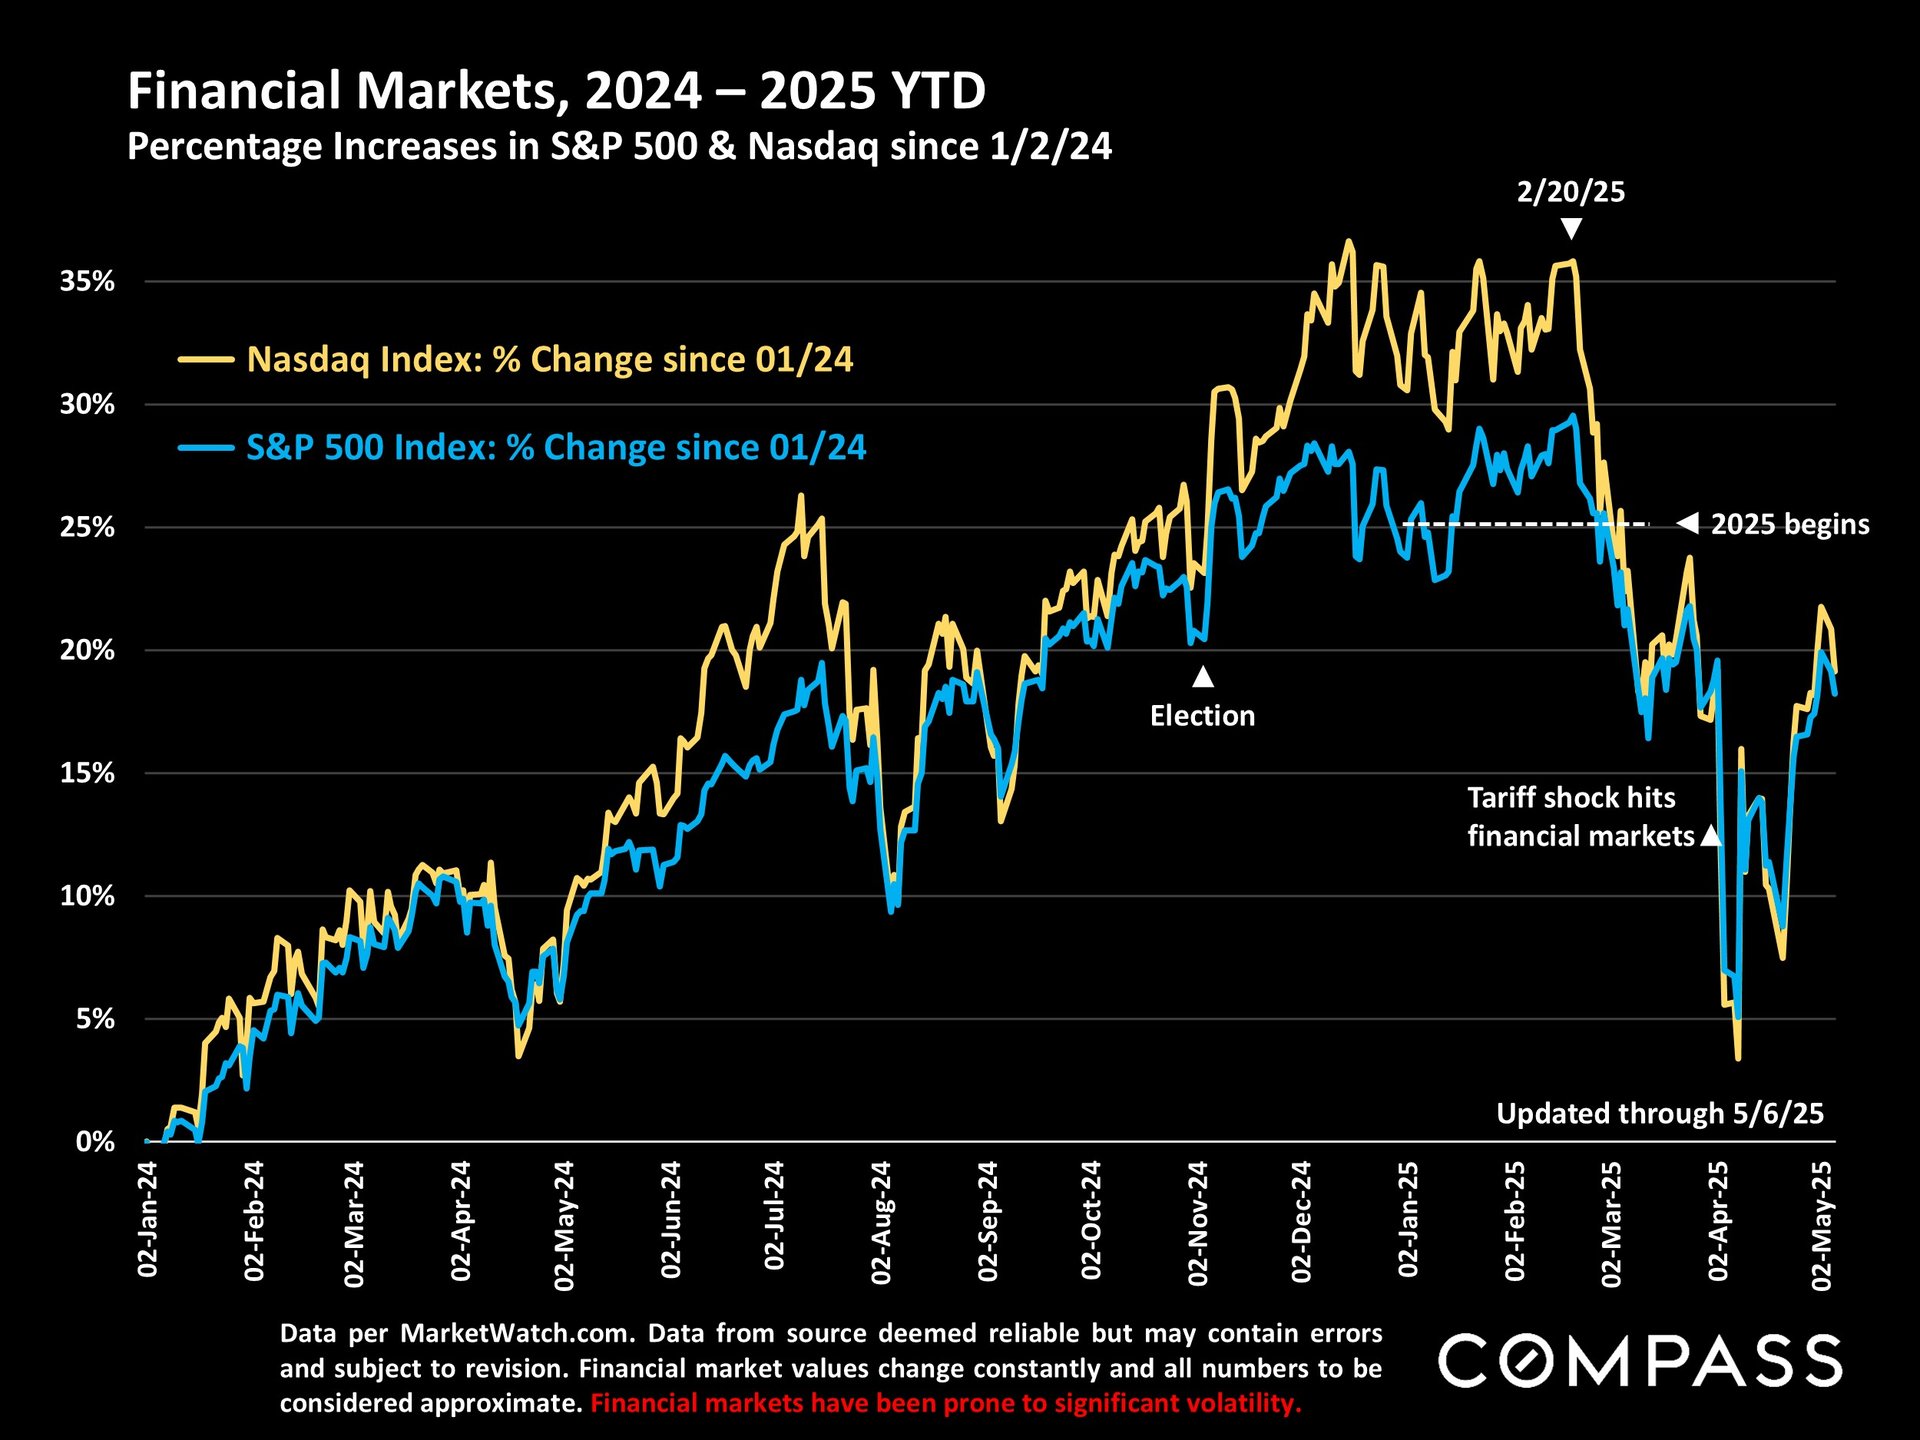
Chart comparing Nasdaq and S&P 500 percentage changes from January 2024 through May 2025, with election and tariff annotations.


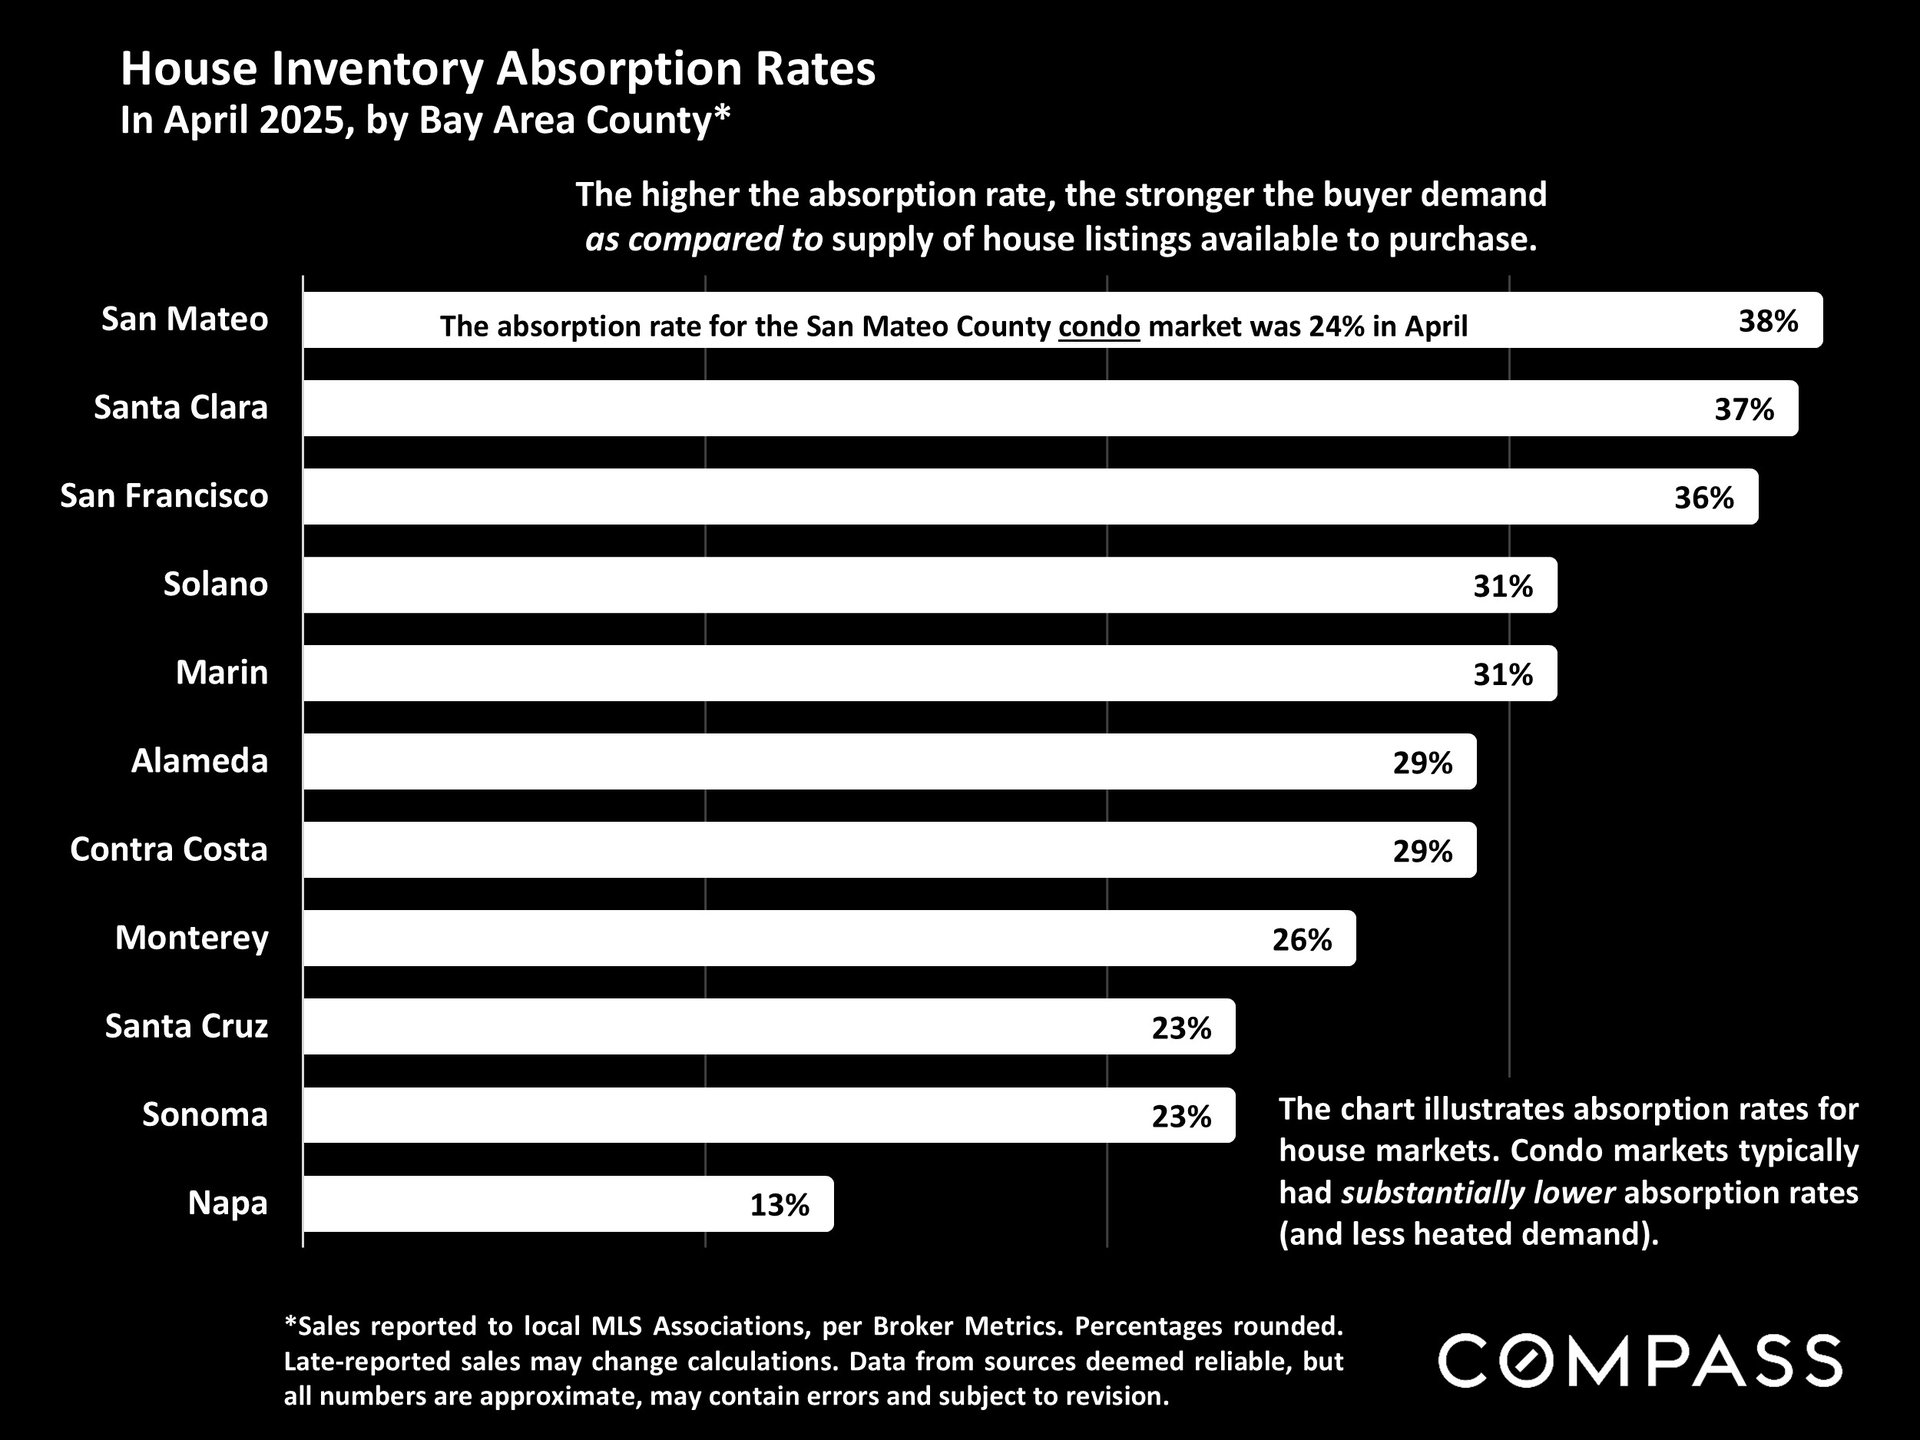
Bay Area county house inventory absorption rates for April 2025, led by San Mateo at 38%.


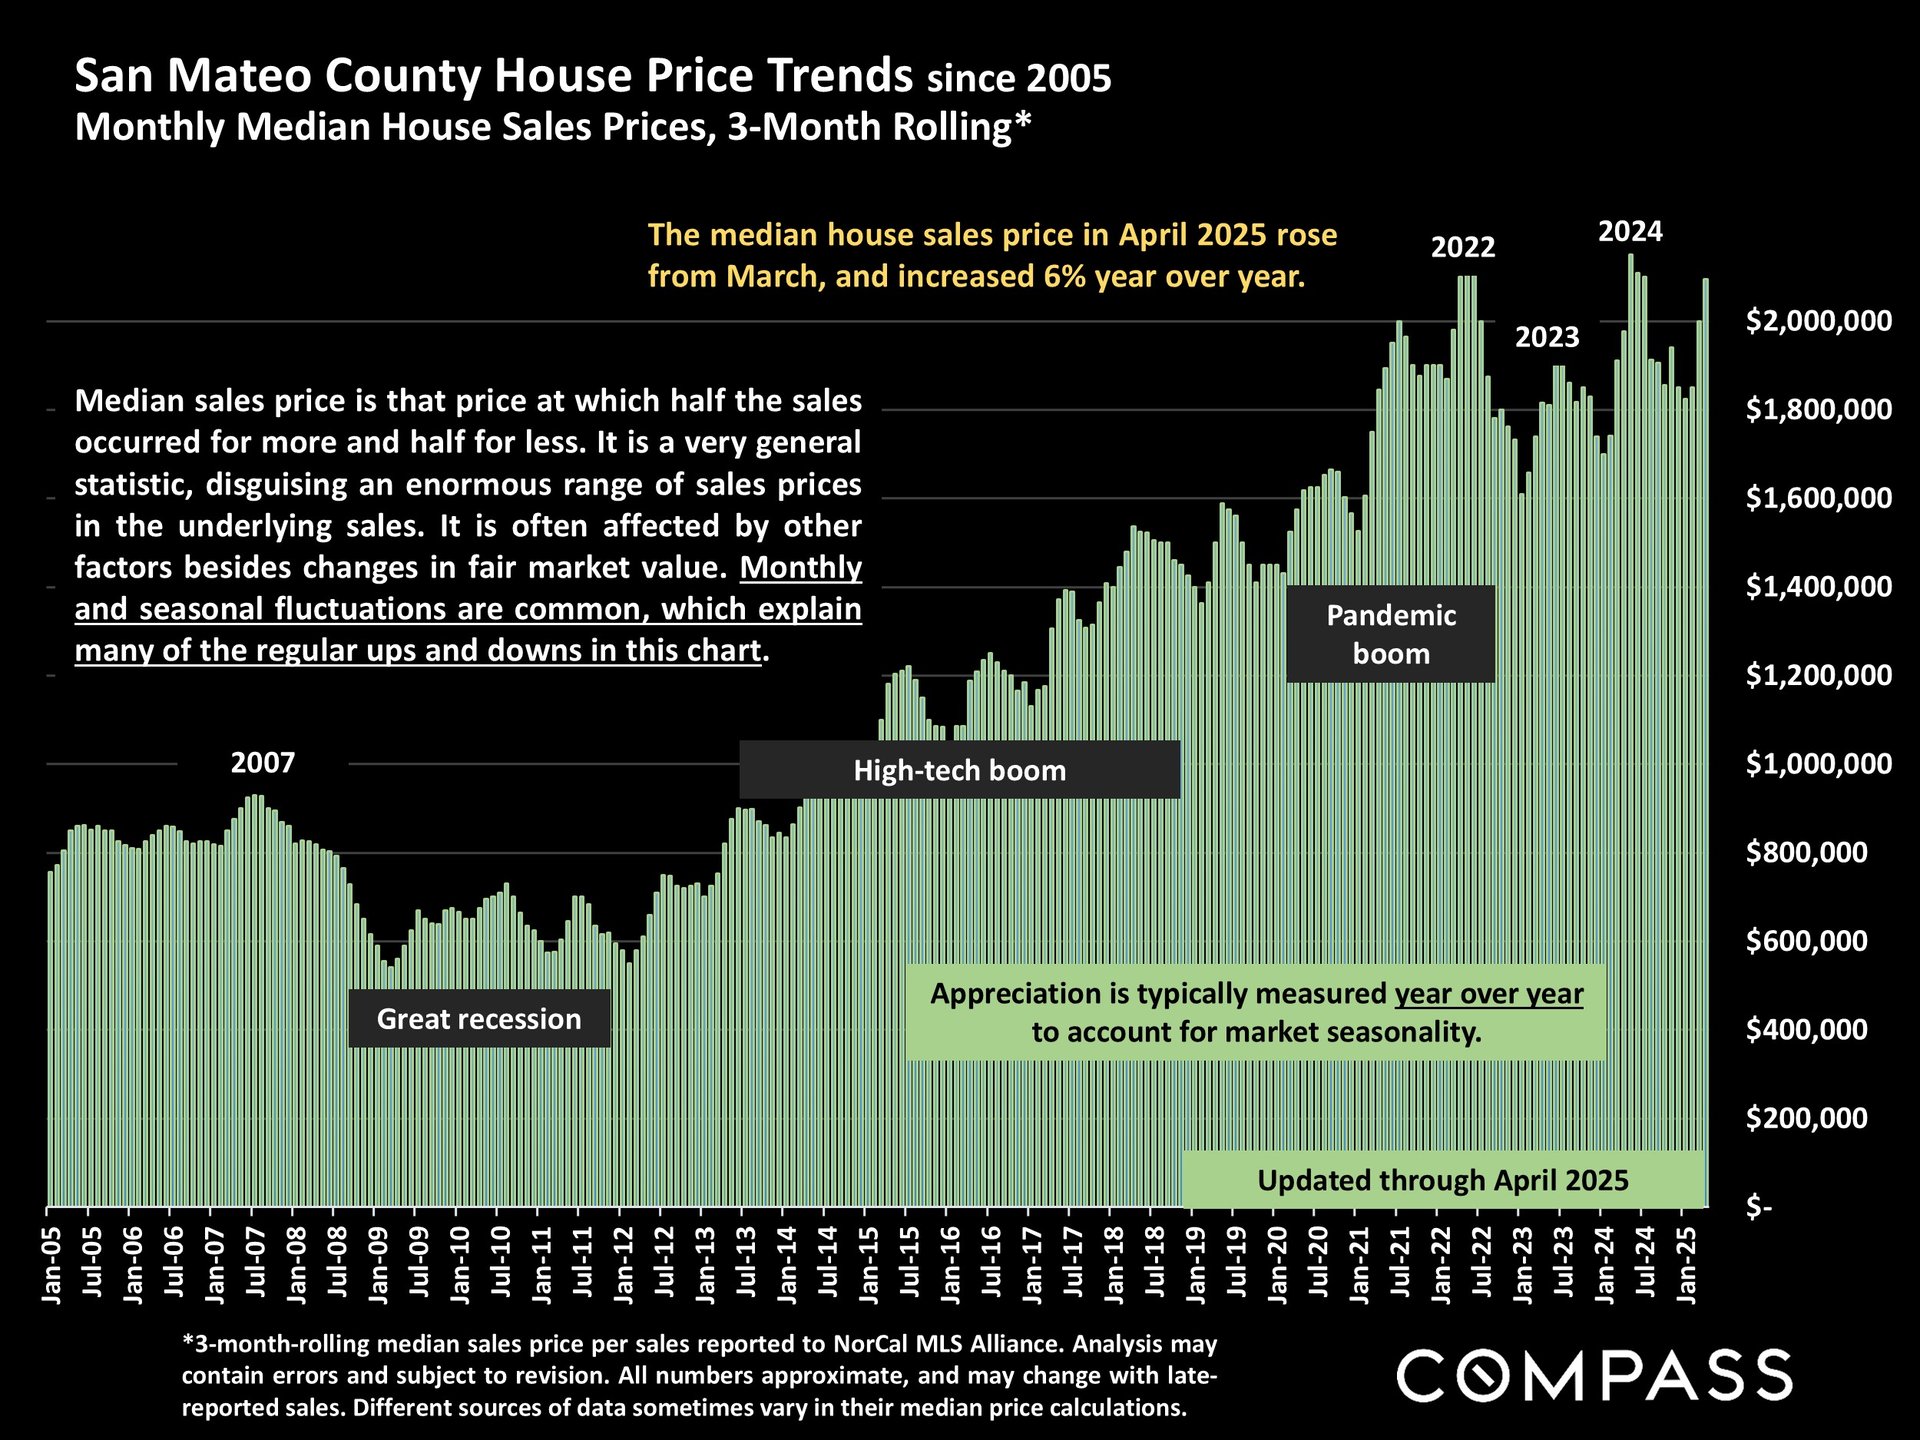
Bar chart of San Mateo County median house prices, 2005–2025, showing April 2025 prices up 6% year over year.


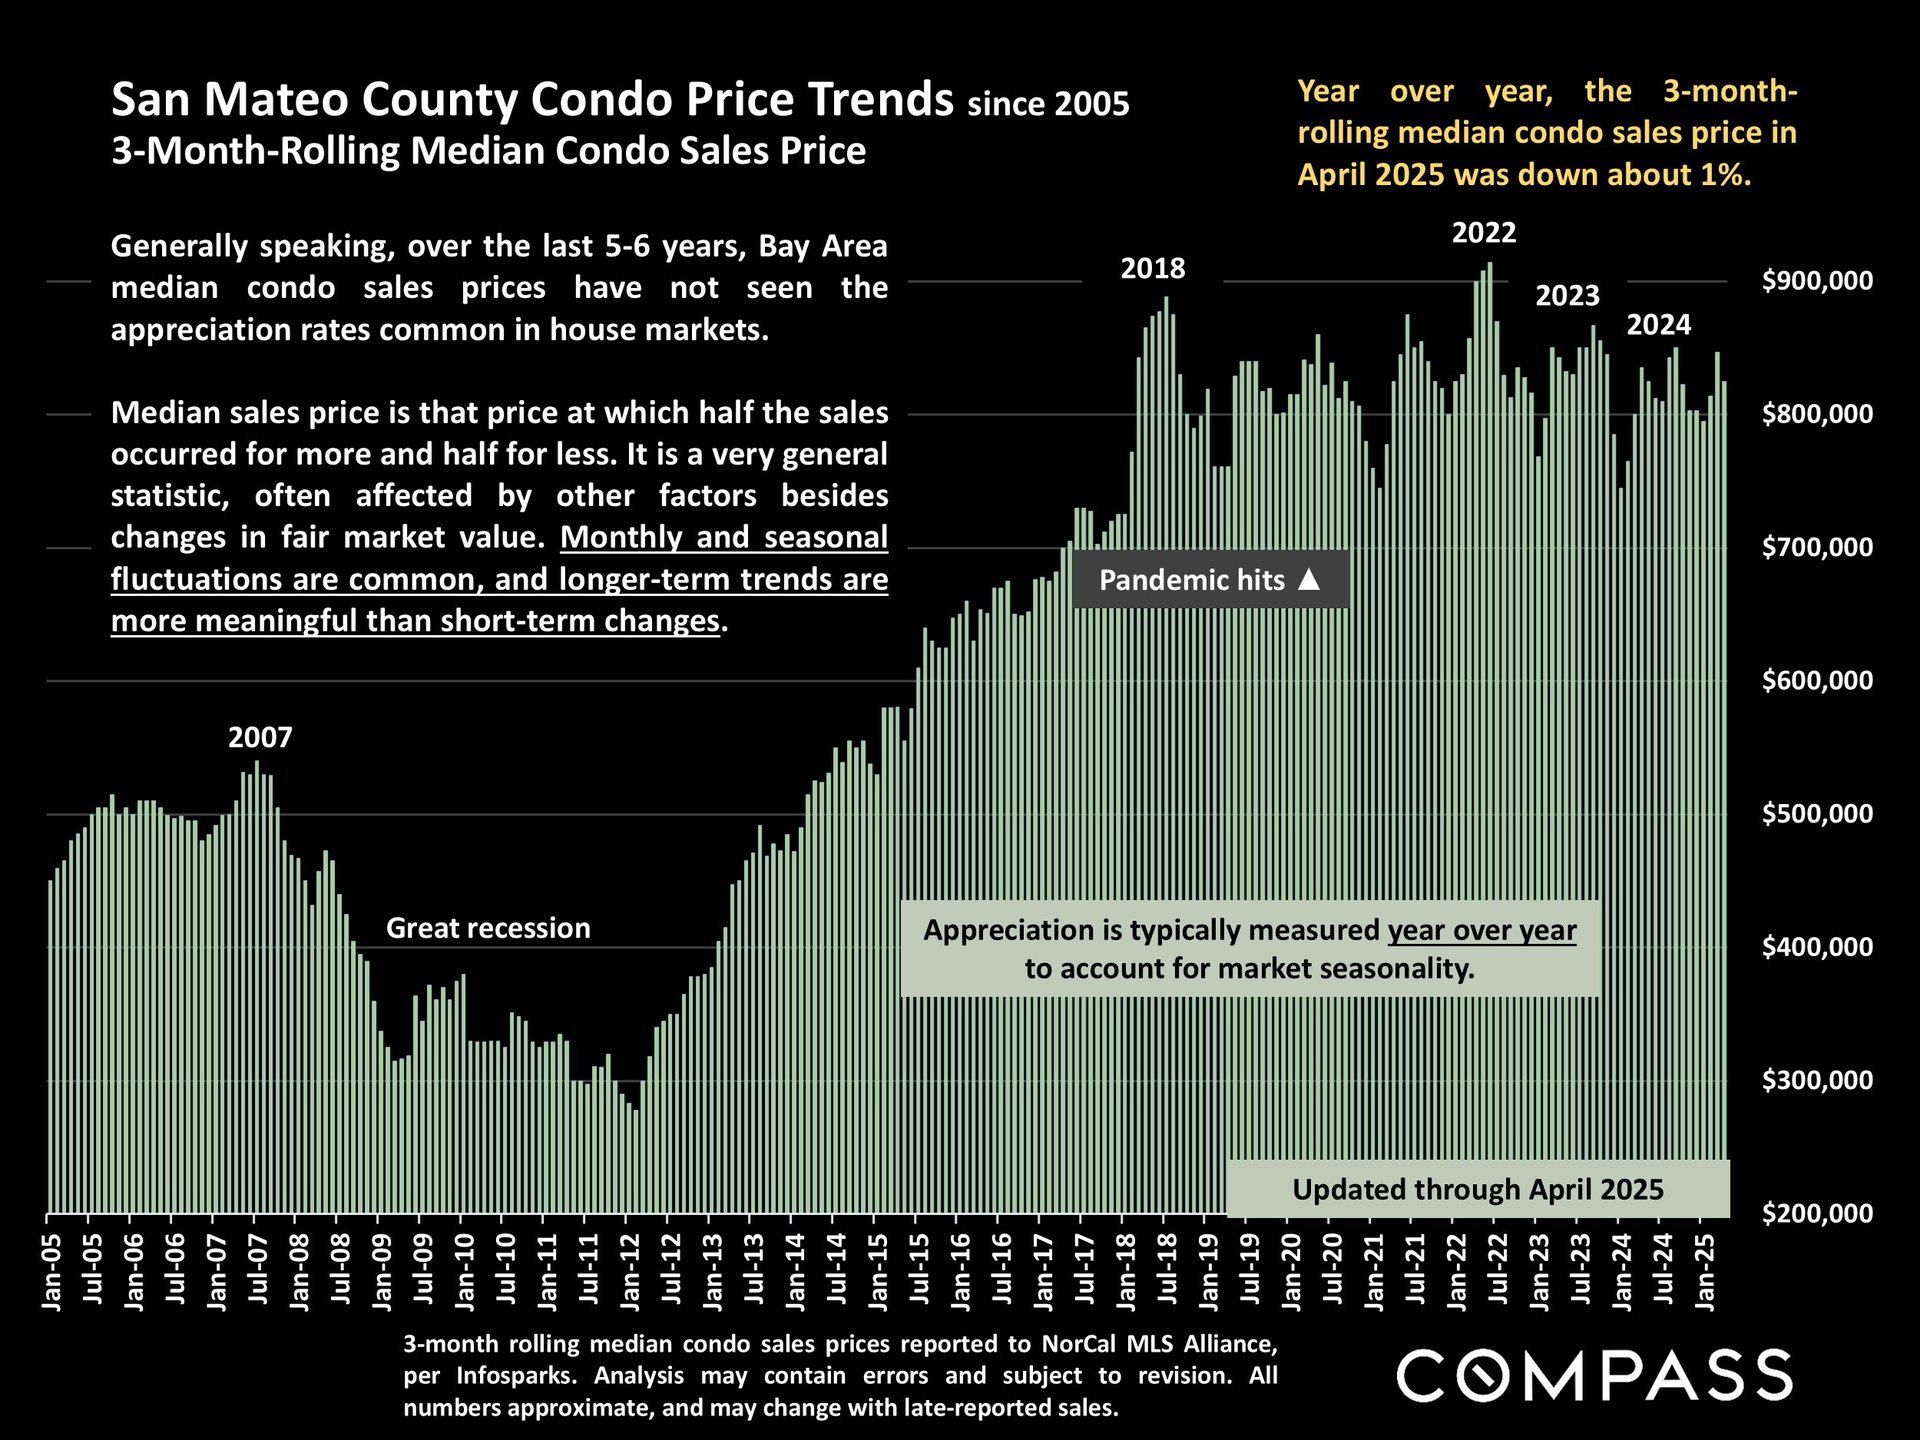
San Mateo County condo price trend chart, 2005–April 2025, with April prices down about 1% year over year.


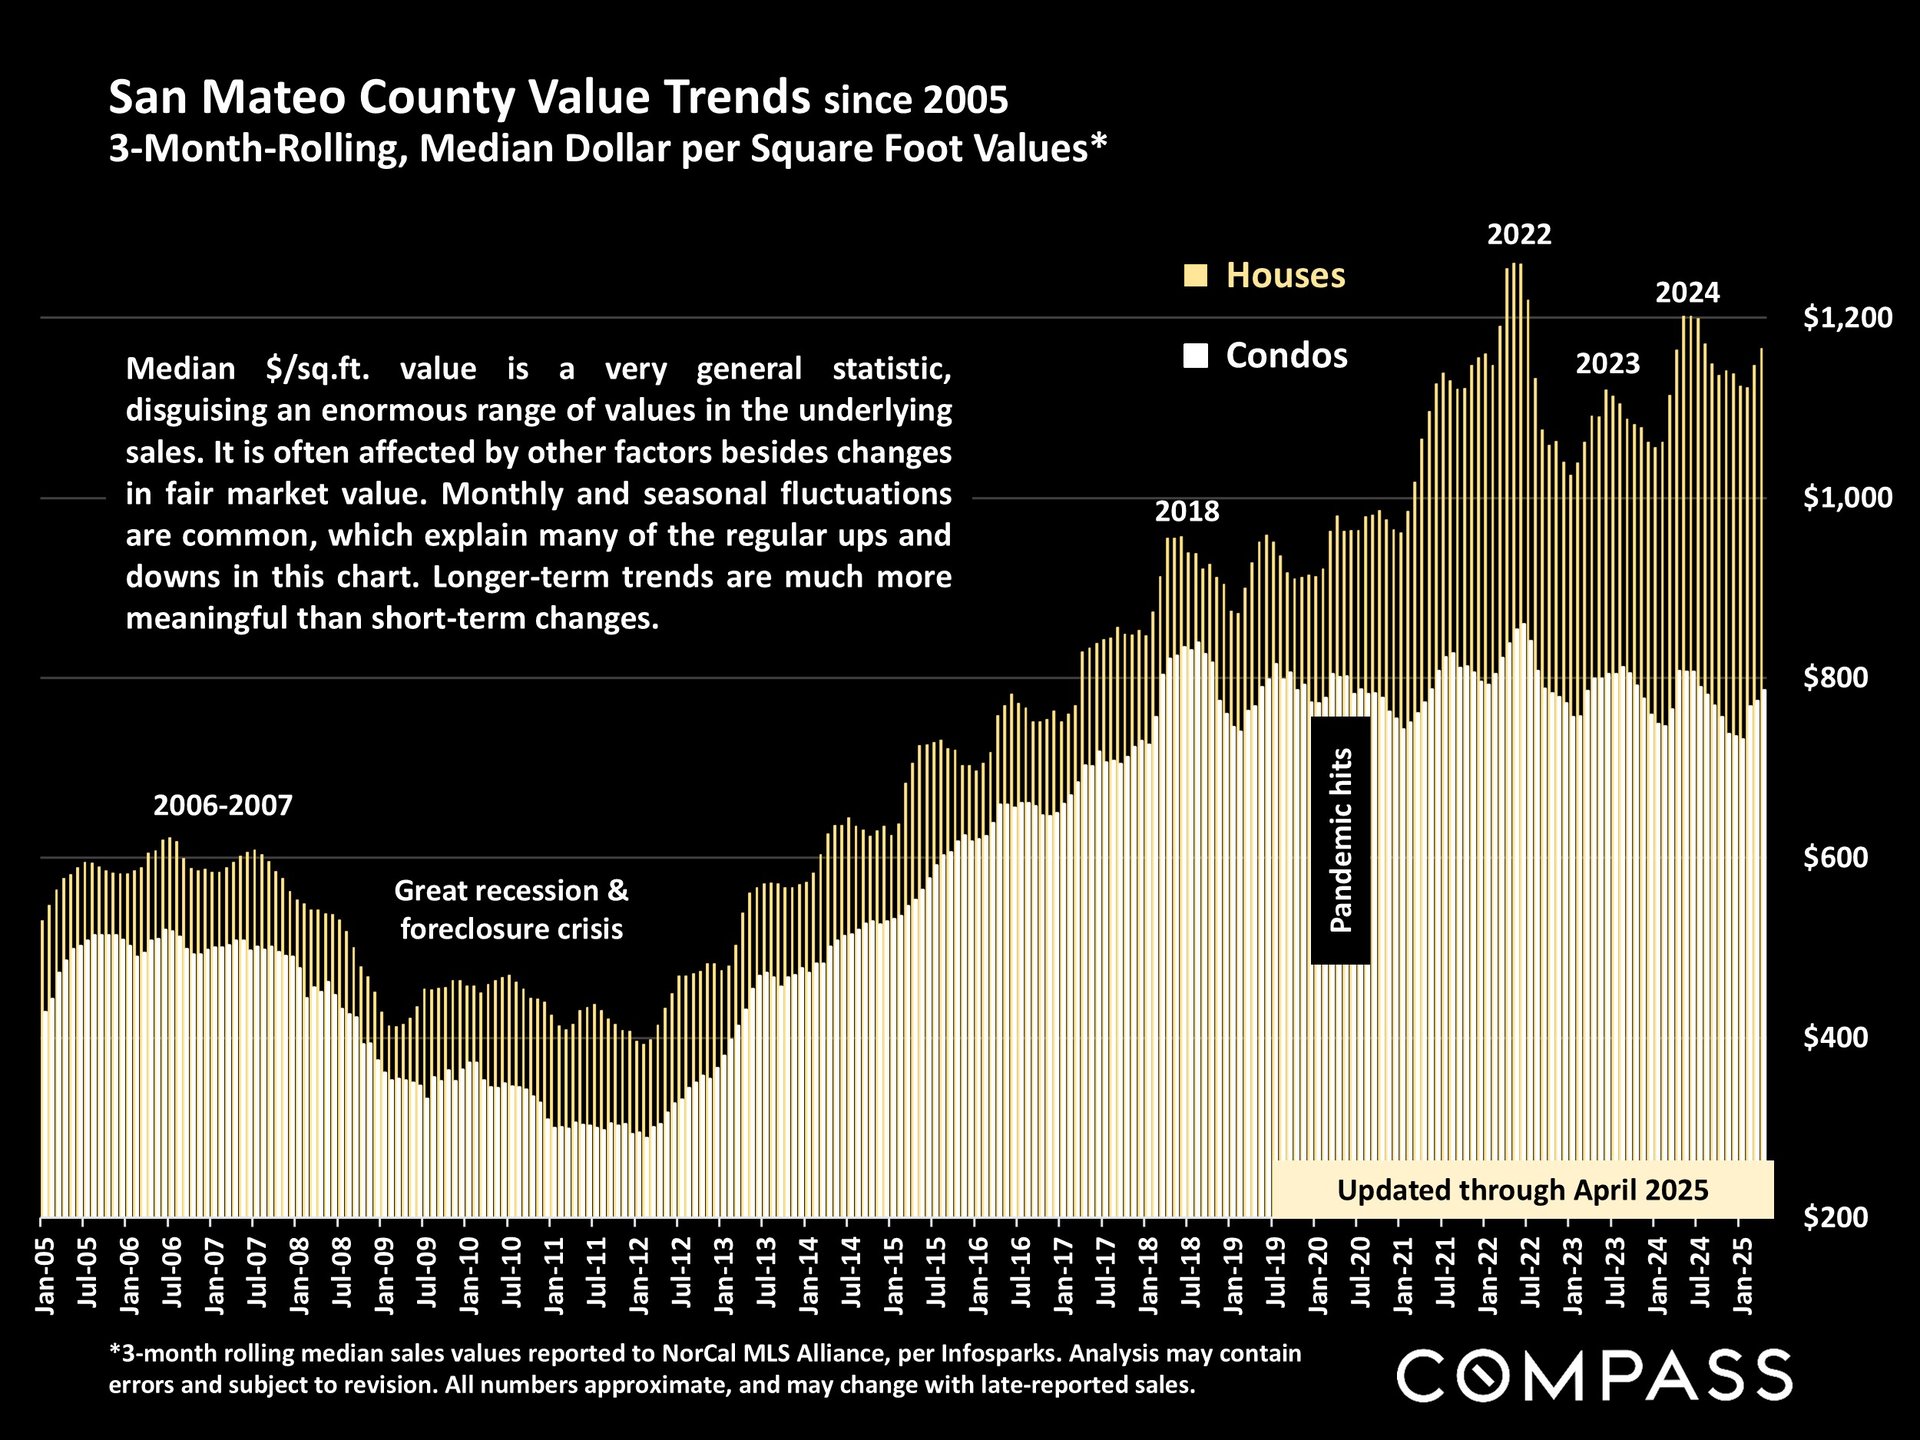
Chart of San Mateo County house and condo values per square foot, updated through April 2025.


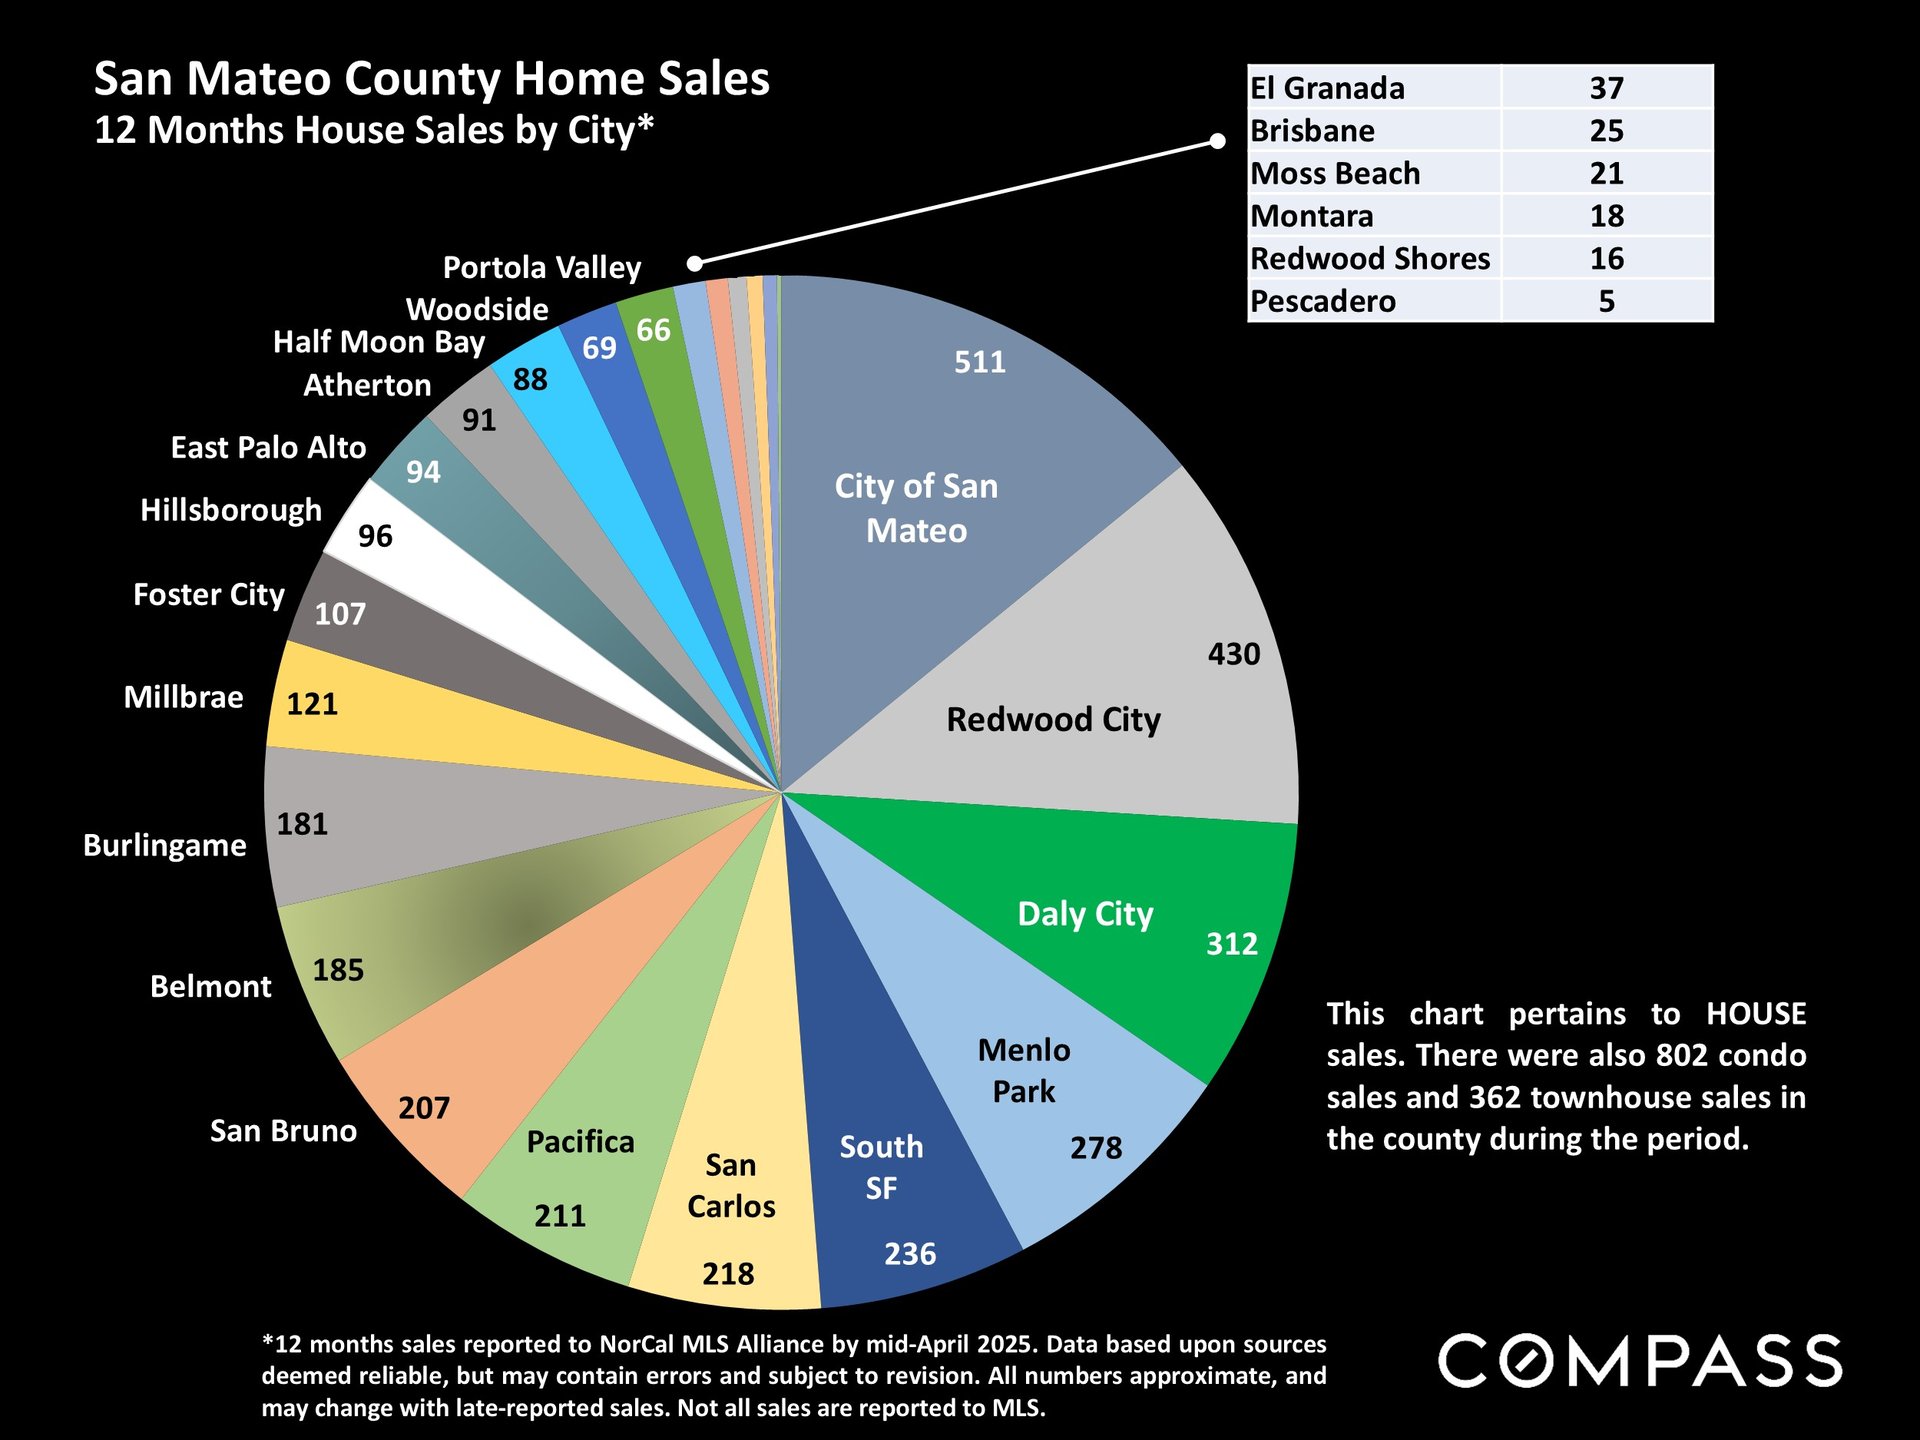
Pie chart of San Mateo County house sales by city; San Mateo leads with 511 sales, followed by Redwood City with 430.


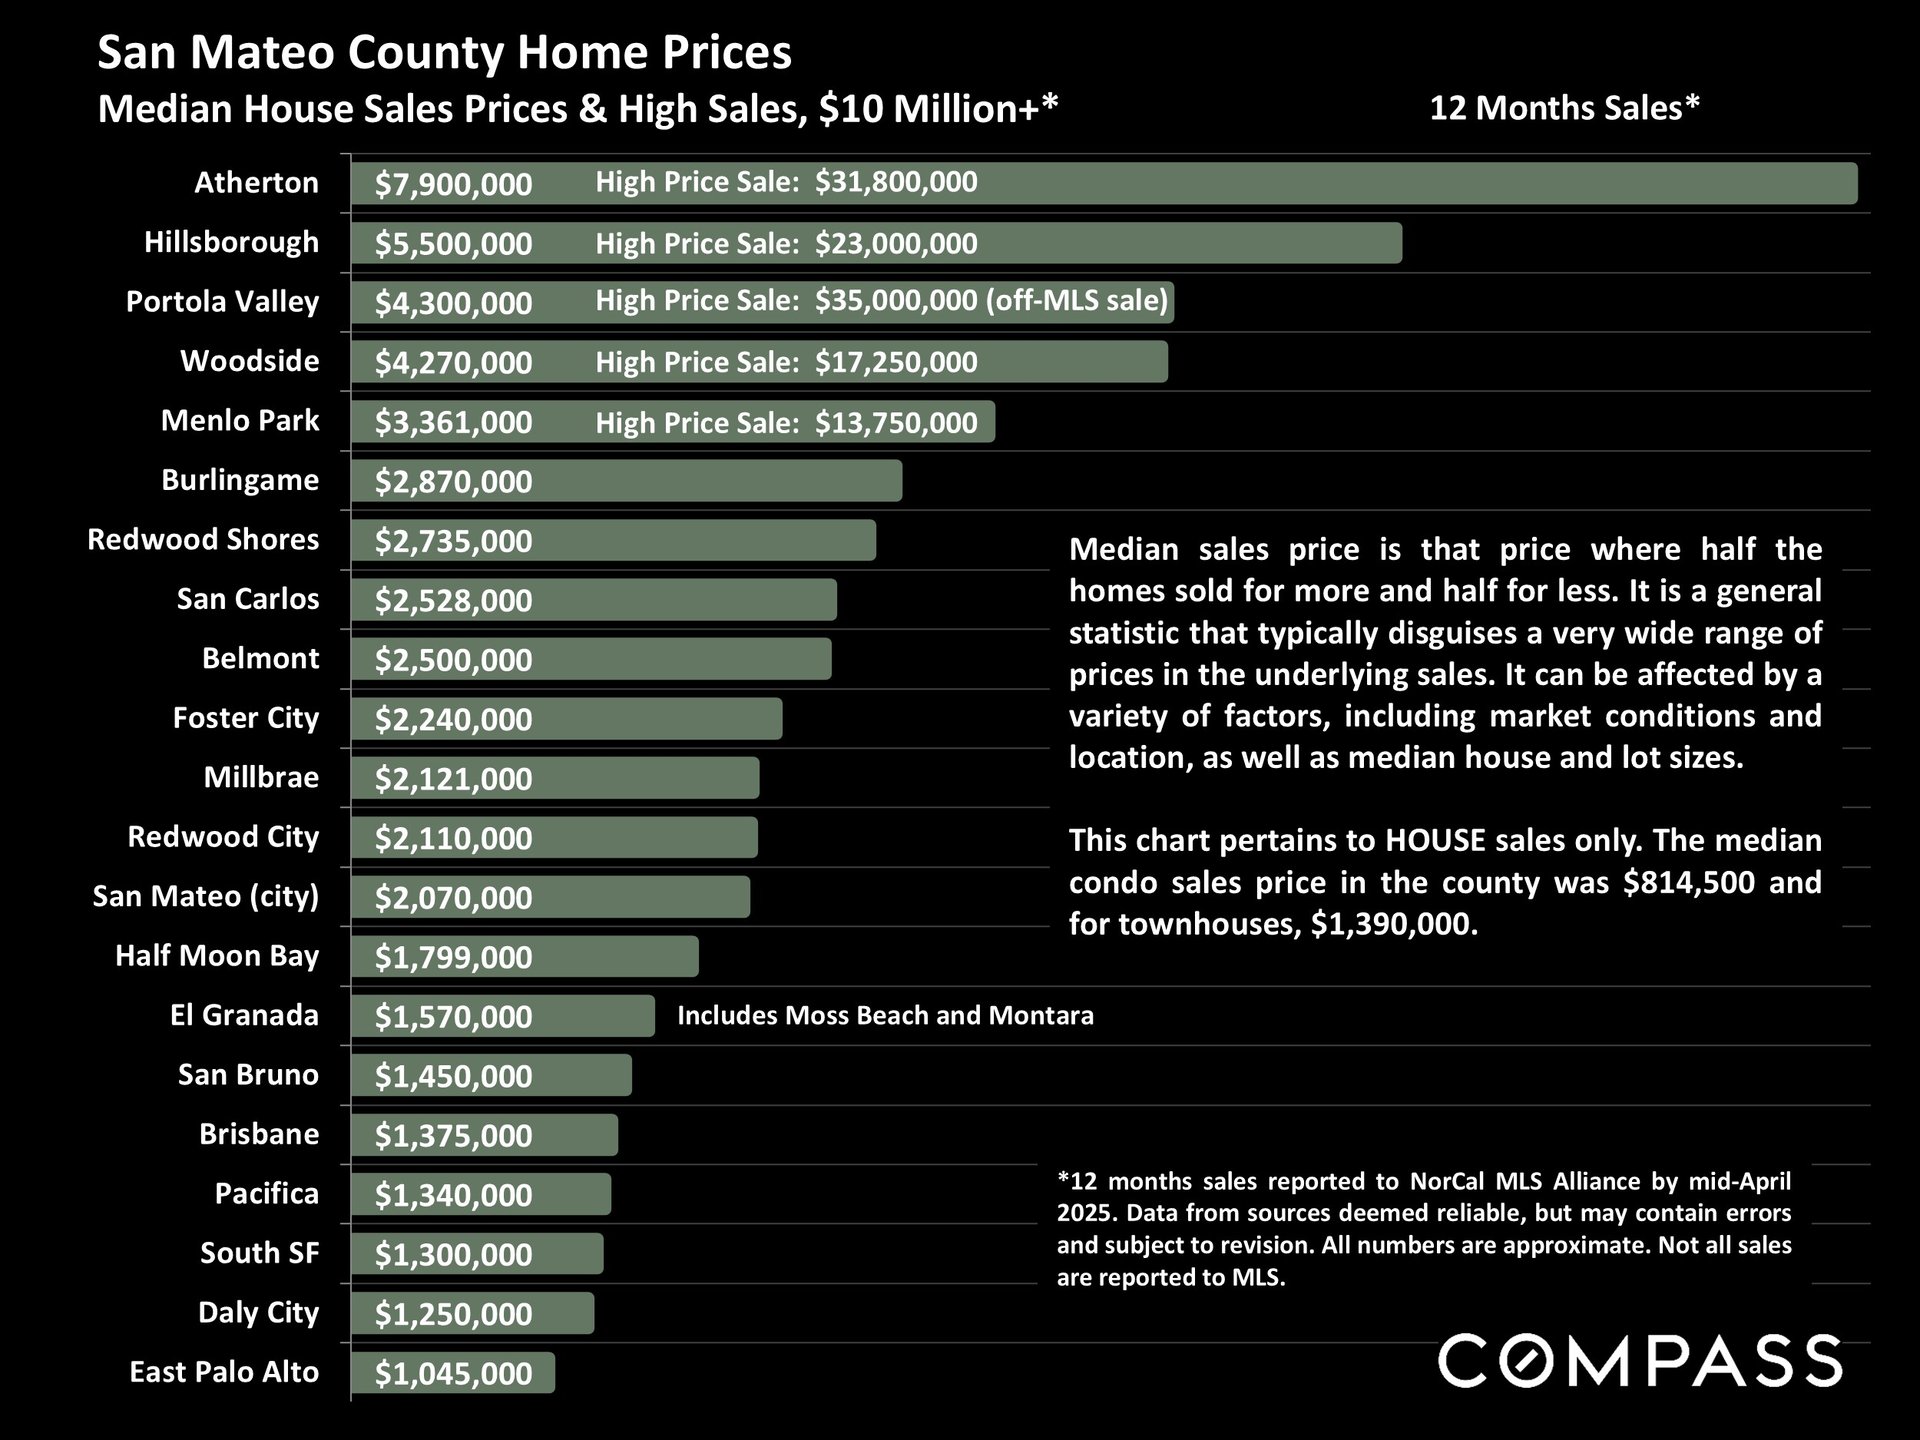
Chart of San Mateo County median home prices, with Atherton highest and East Palo Alto lowest.


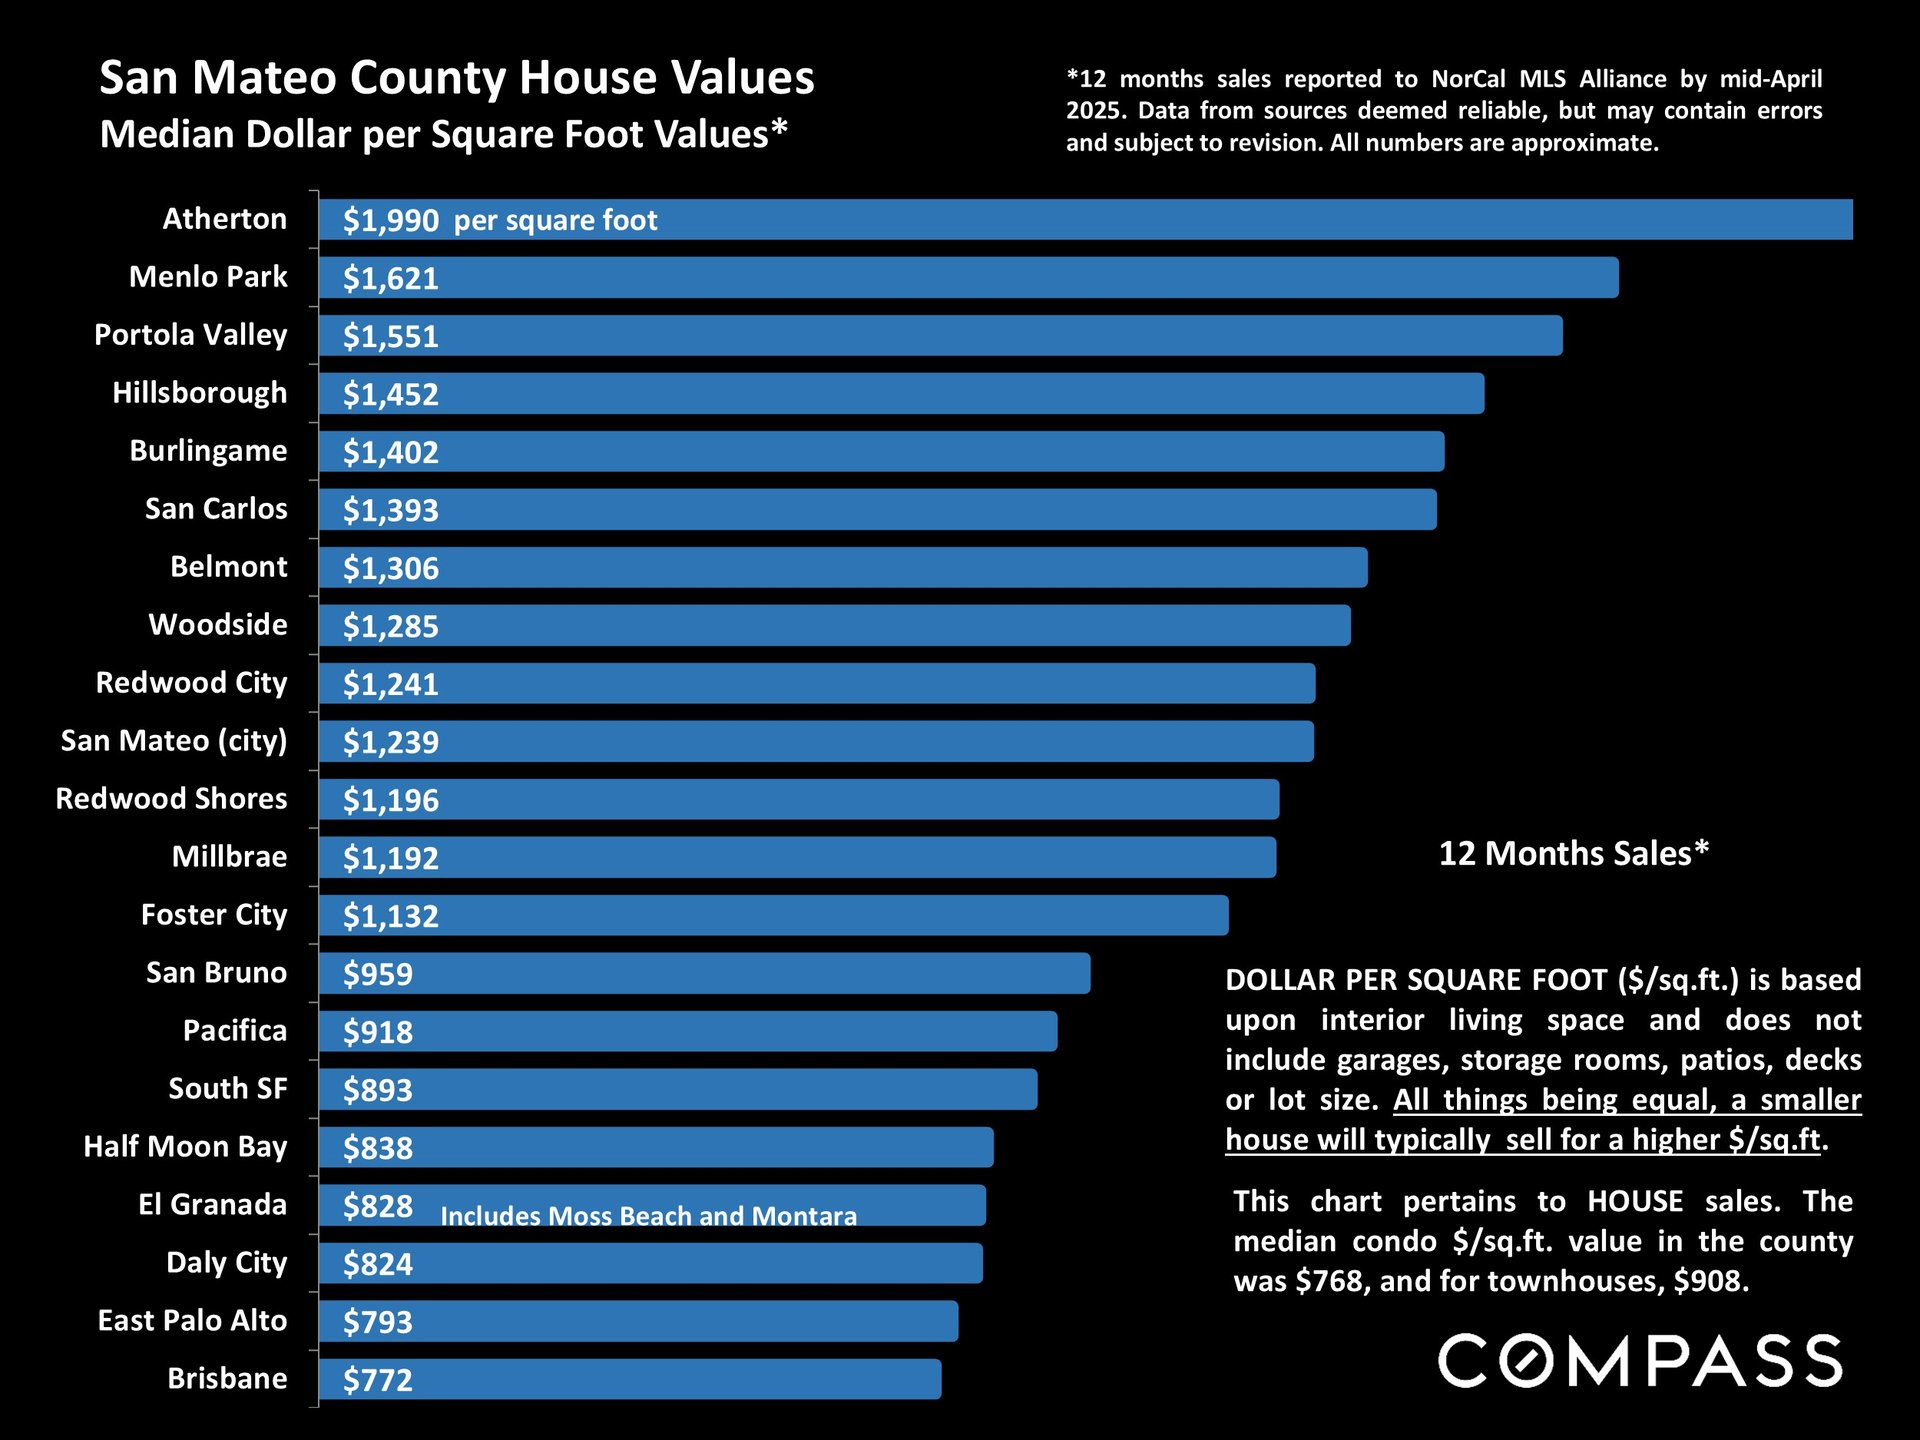
San Mateo County home values bar chart, with Atherton highest at $1,990 per square foot and Brisbane lowest at $772.


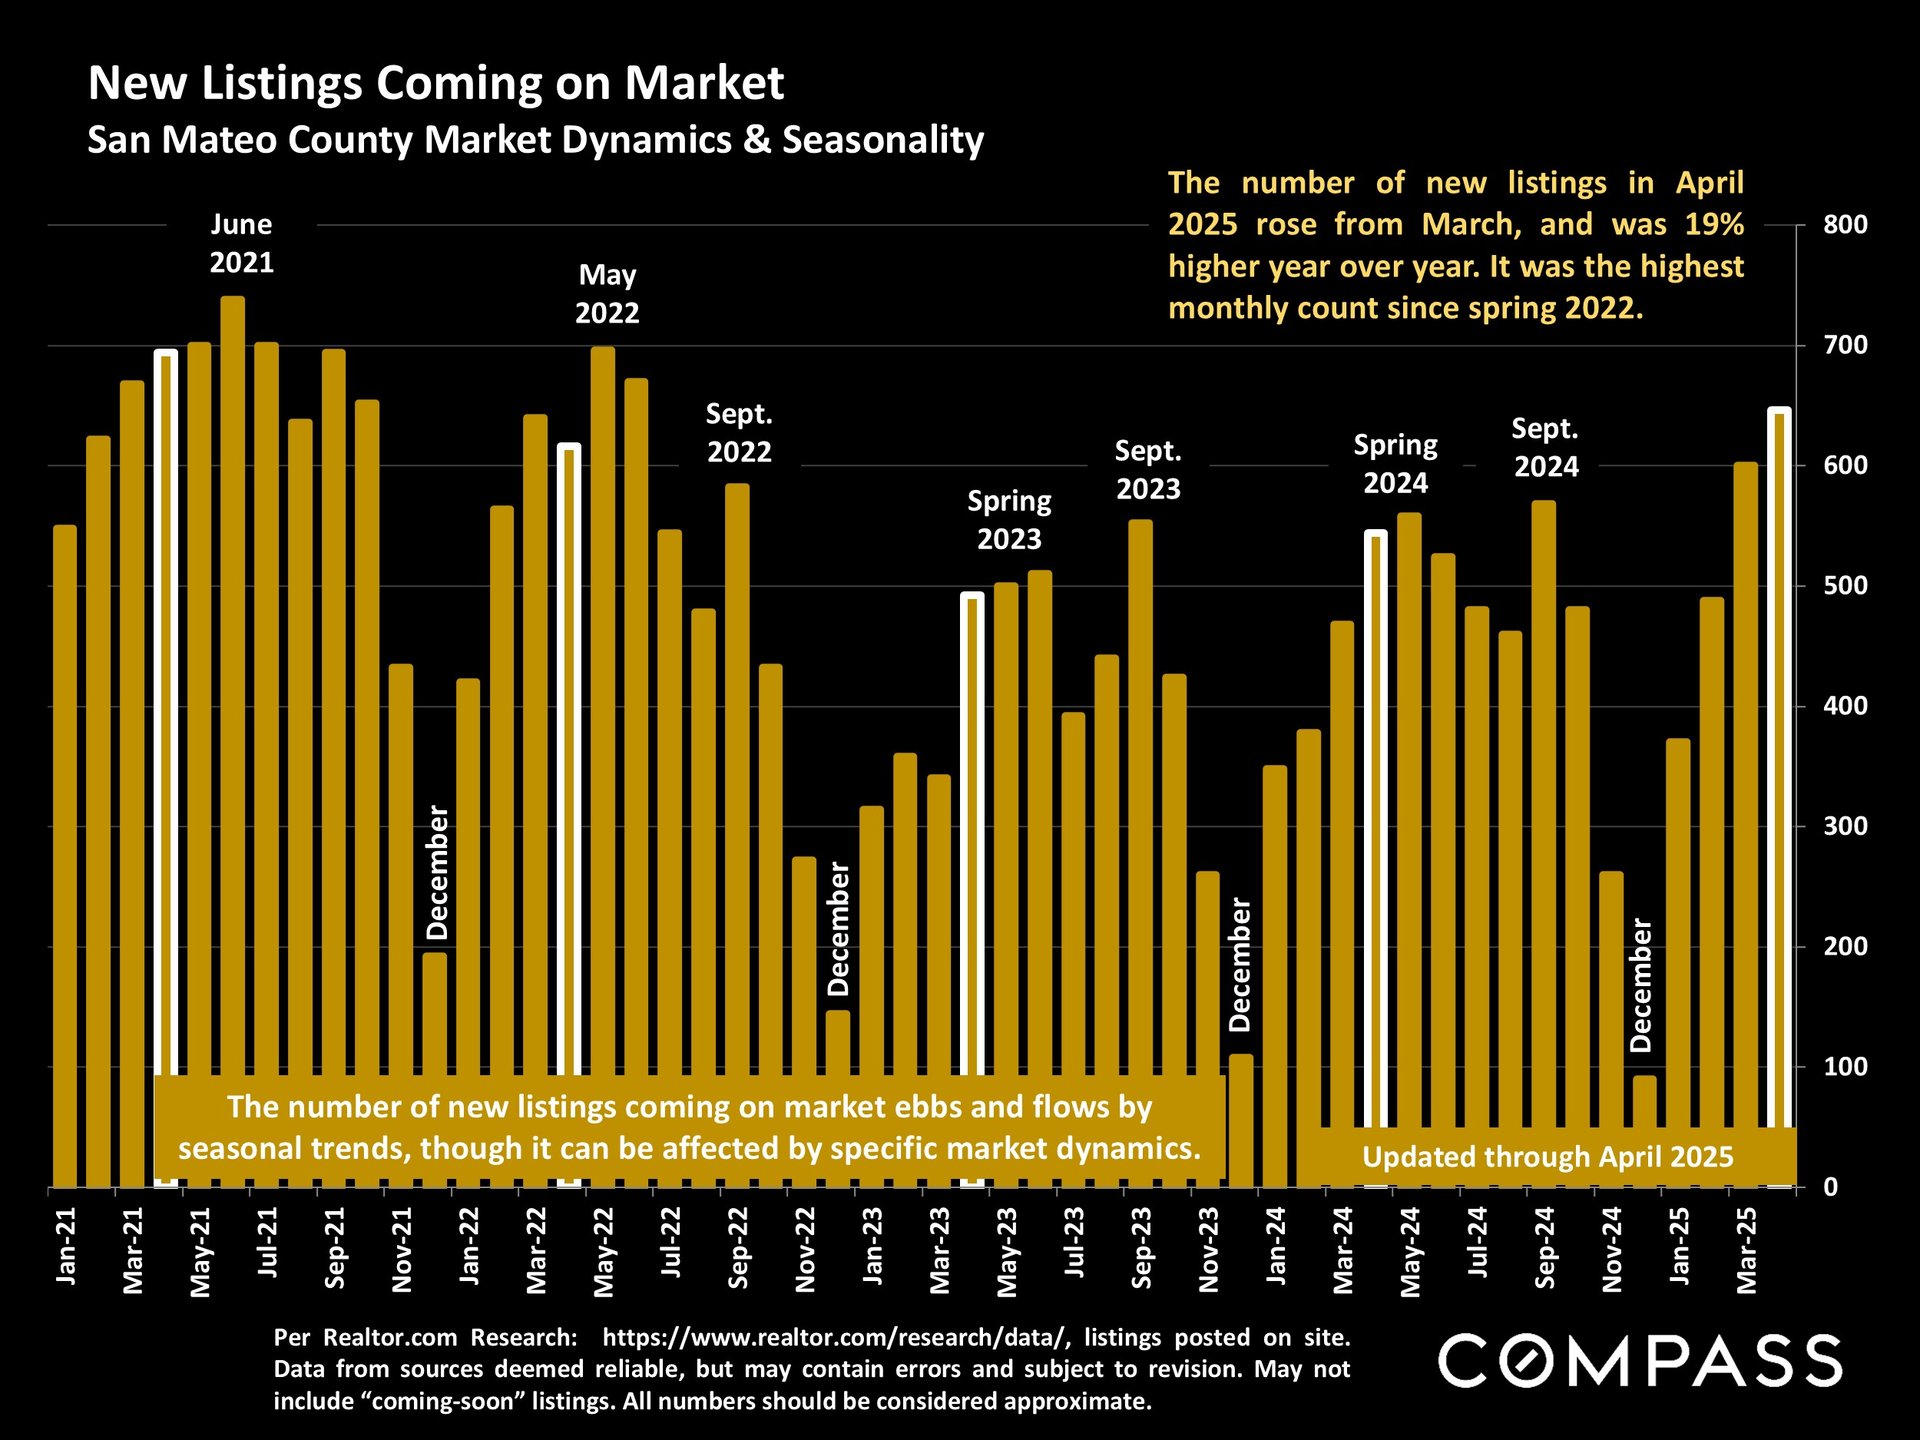
Chart of monthly new listings in San Mateo County from 2021 to April 2025, with seasonal trends and April 2025 highlighted.


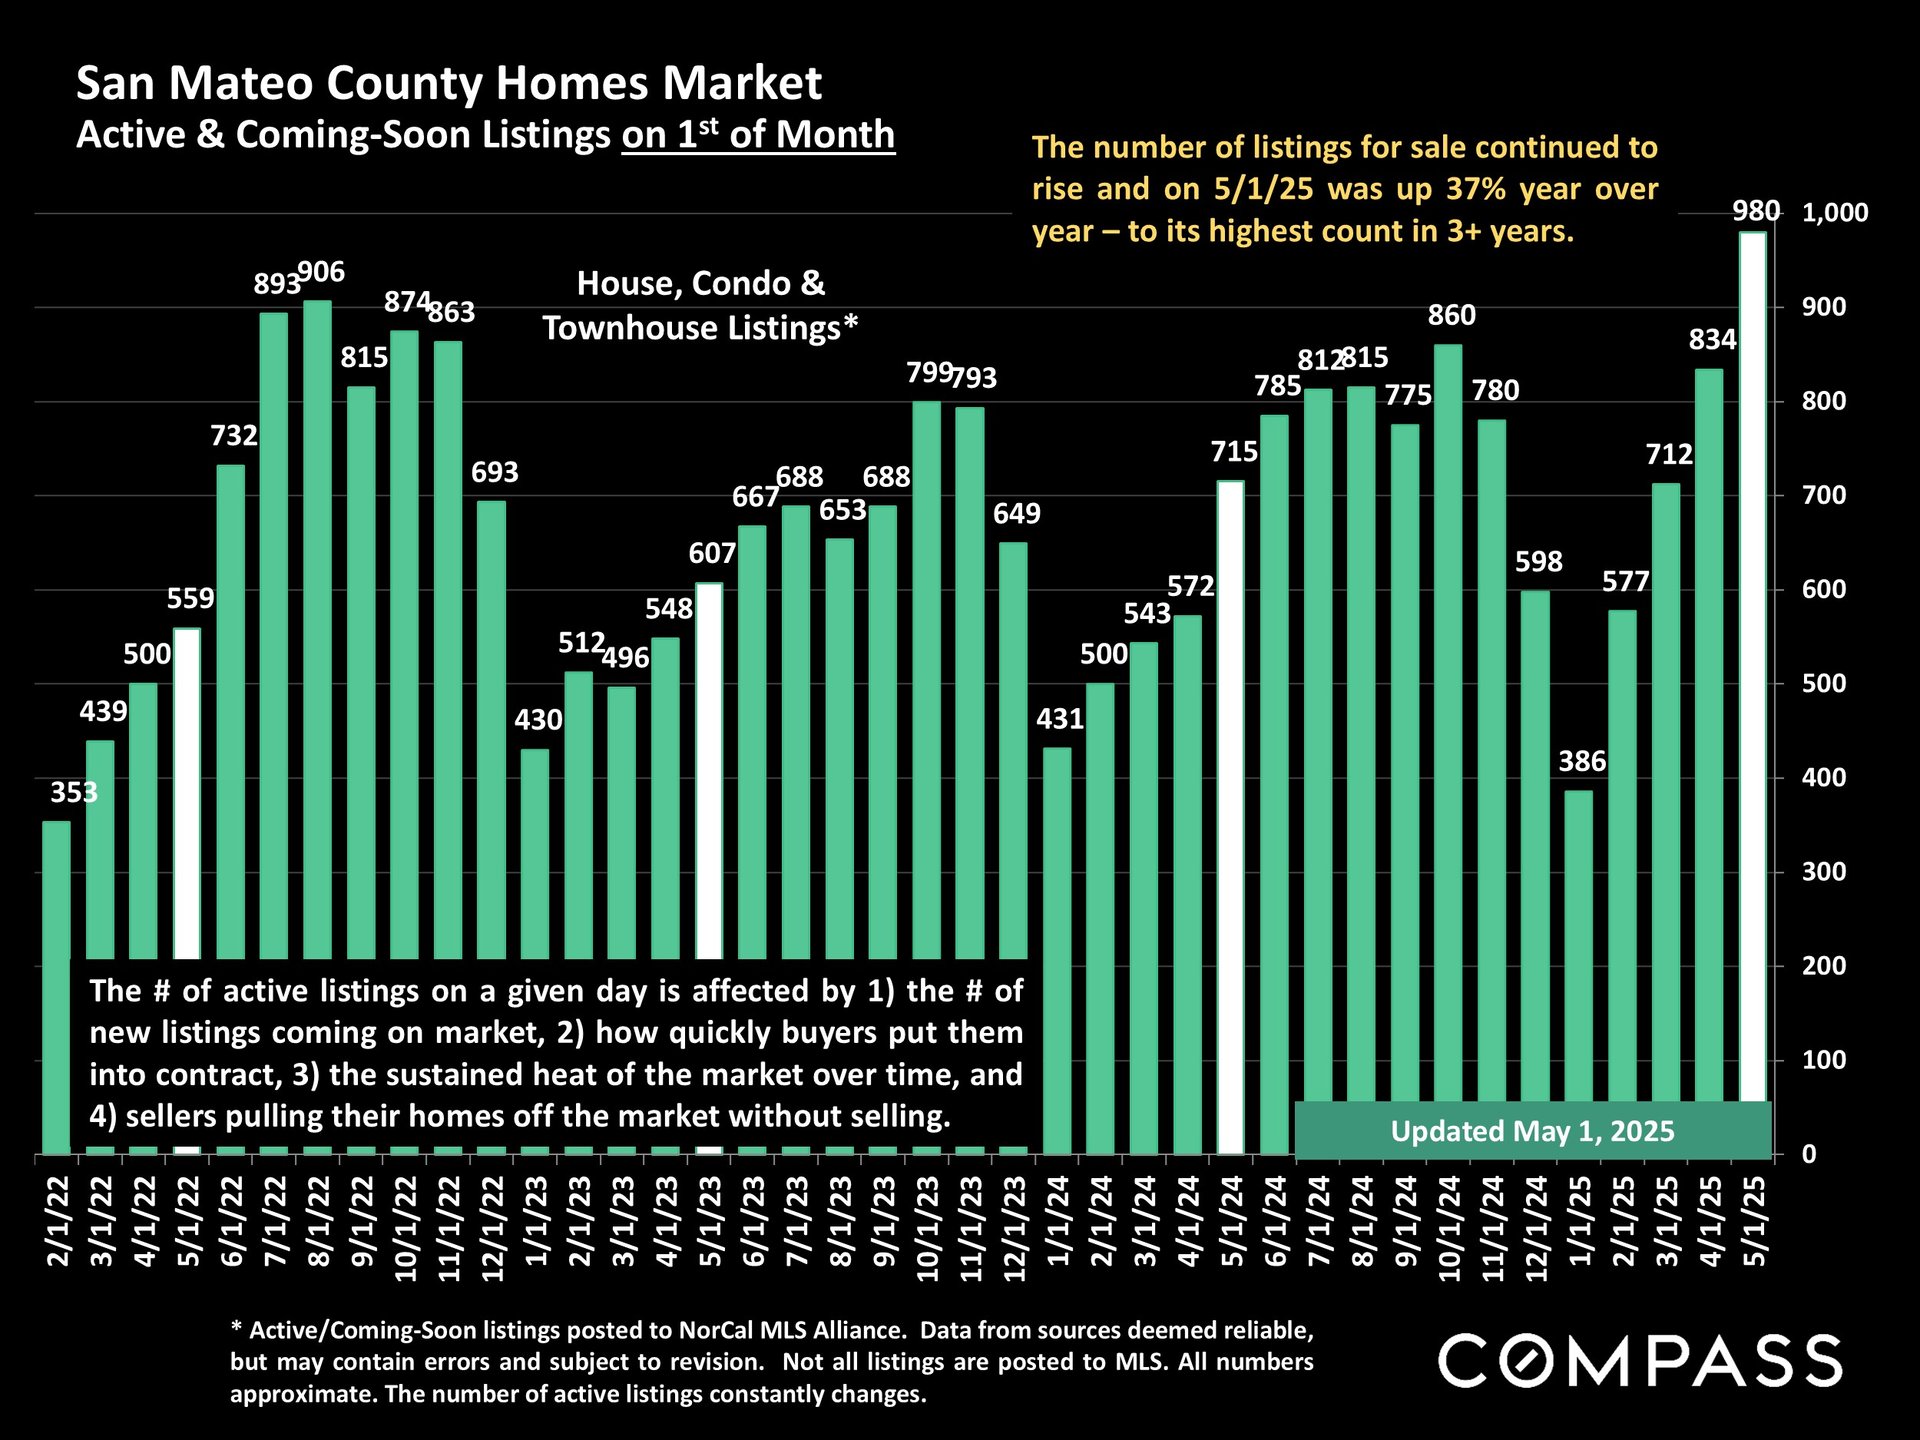
Bar chart of San Mateo County home listings, highlighting 980 listings on May 1, 2025, up 37% year over year.


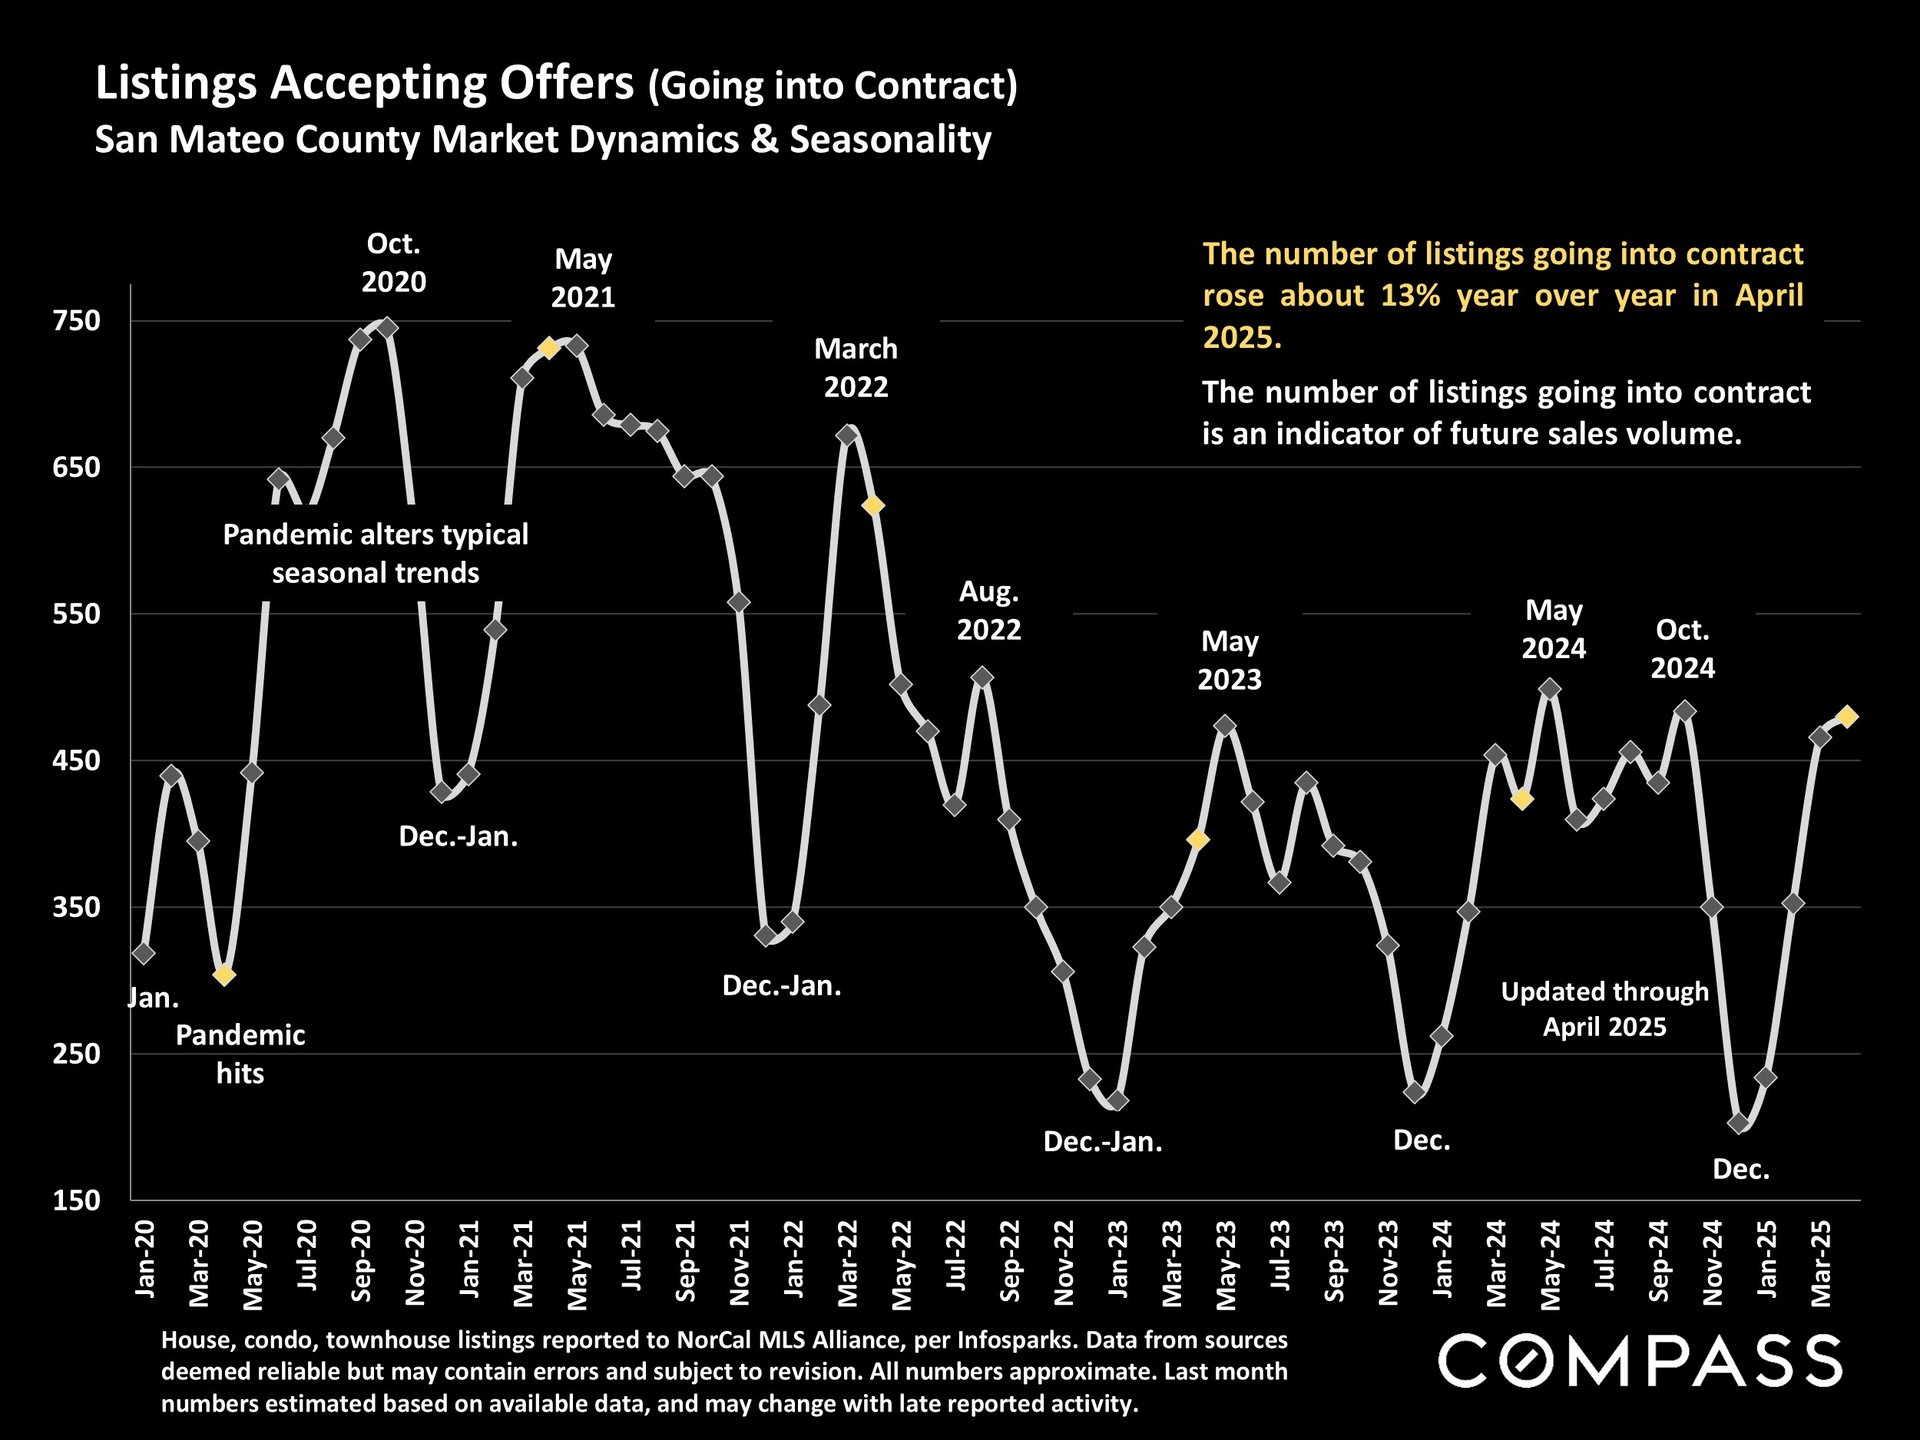
San Mateo County chart of listings going into contract, highlighting a 13% year-over-year increase in April 2025.


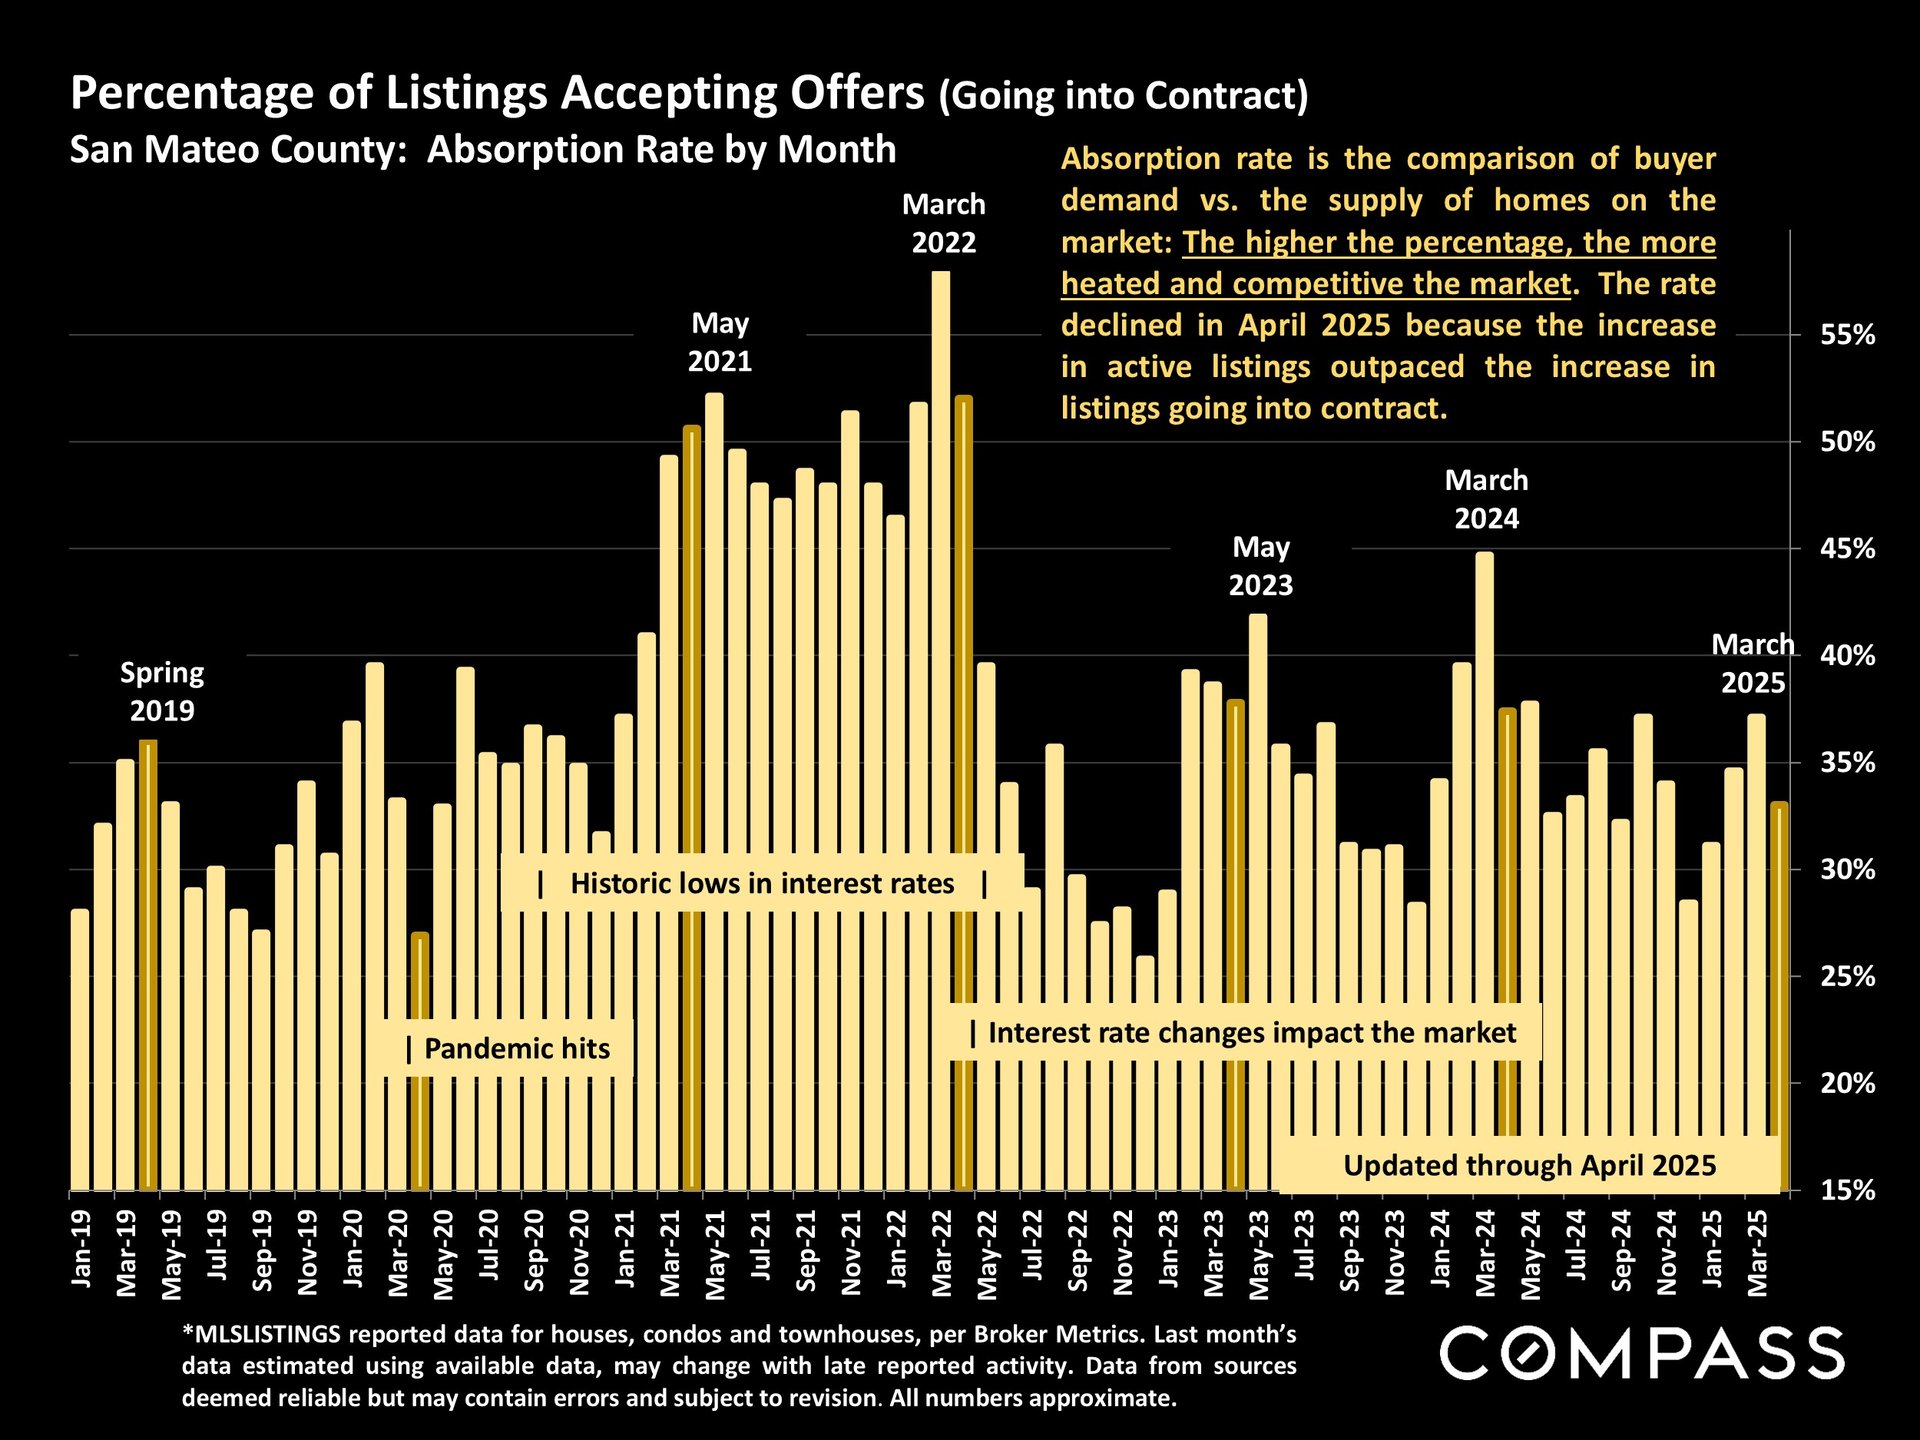
San Mateo County monthly listing absorption rates, January 2019 through April 2025.


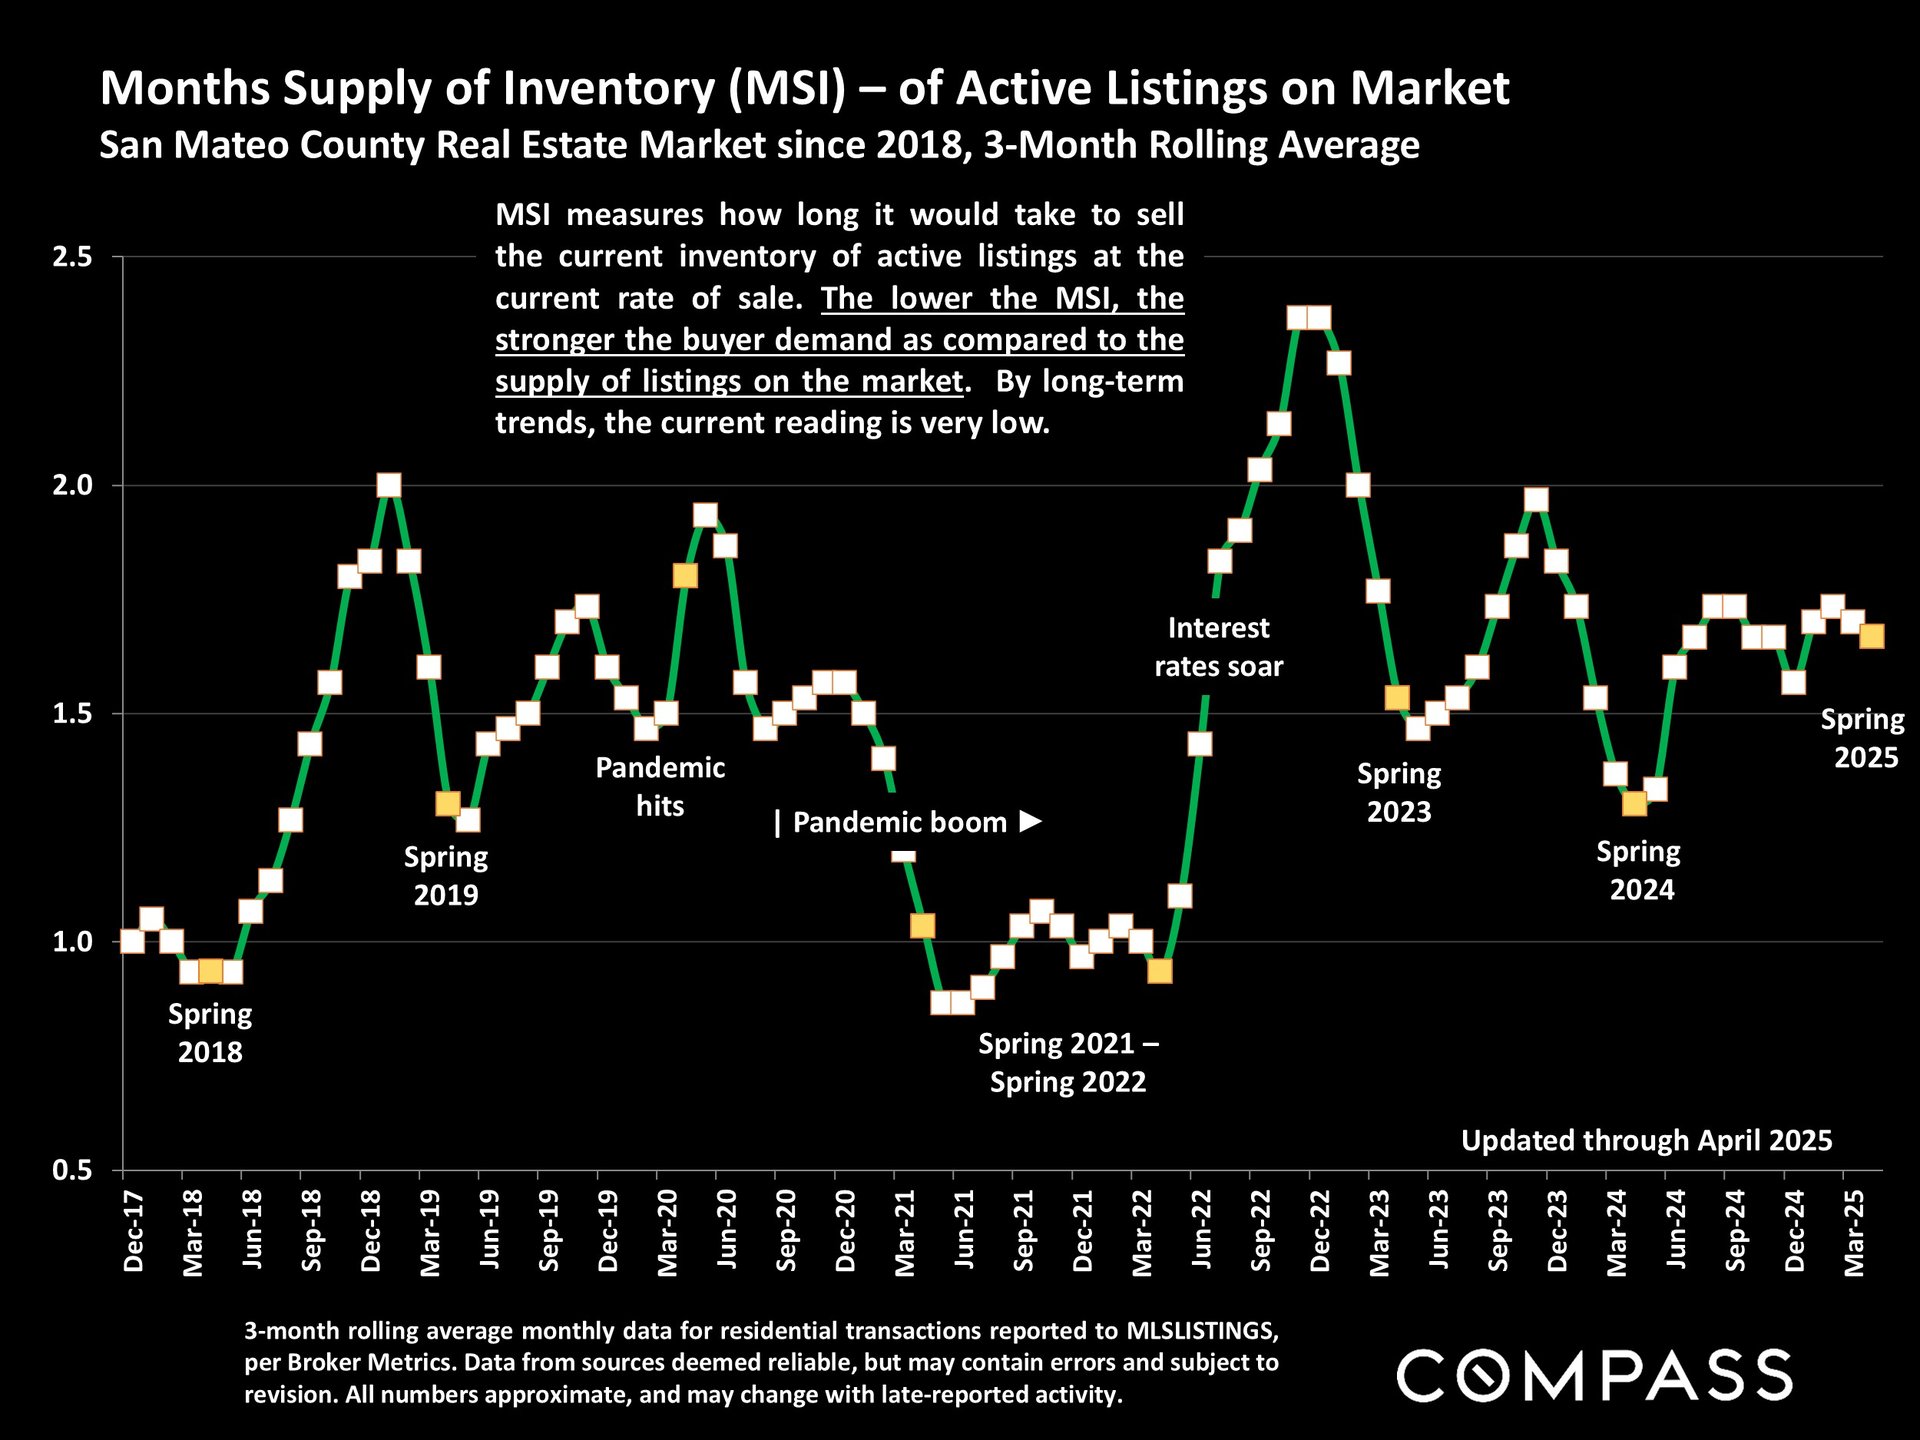
San Mateo County months-supply-of-inventory chart from 2017 to 2025, with spring and market-event annotations.


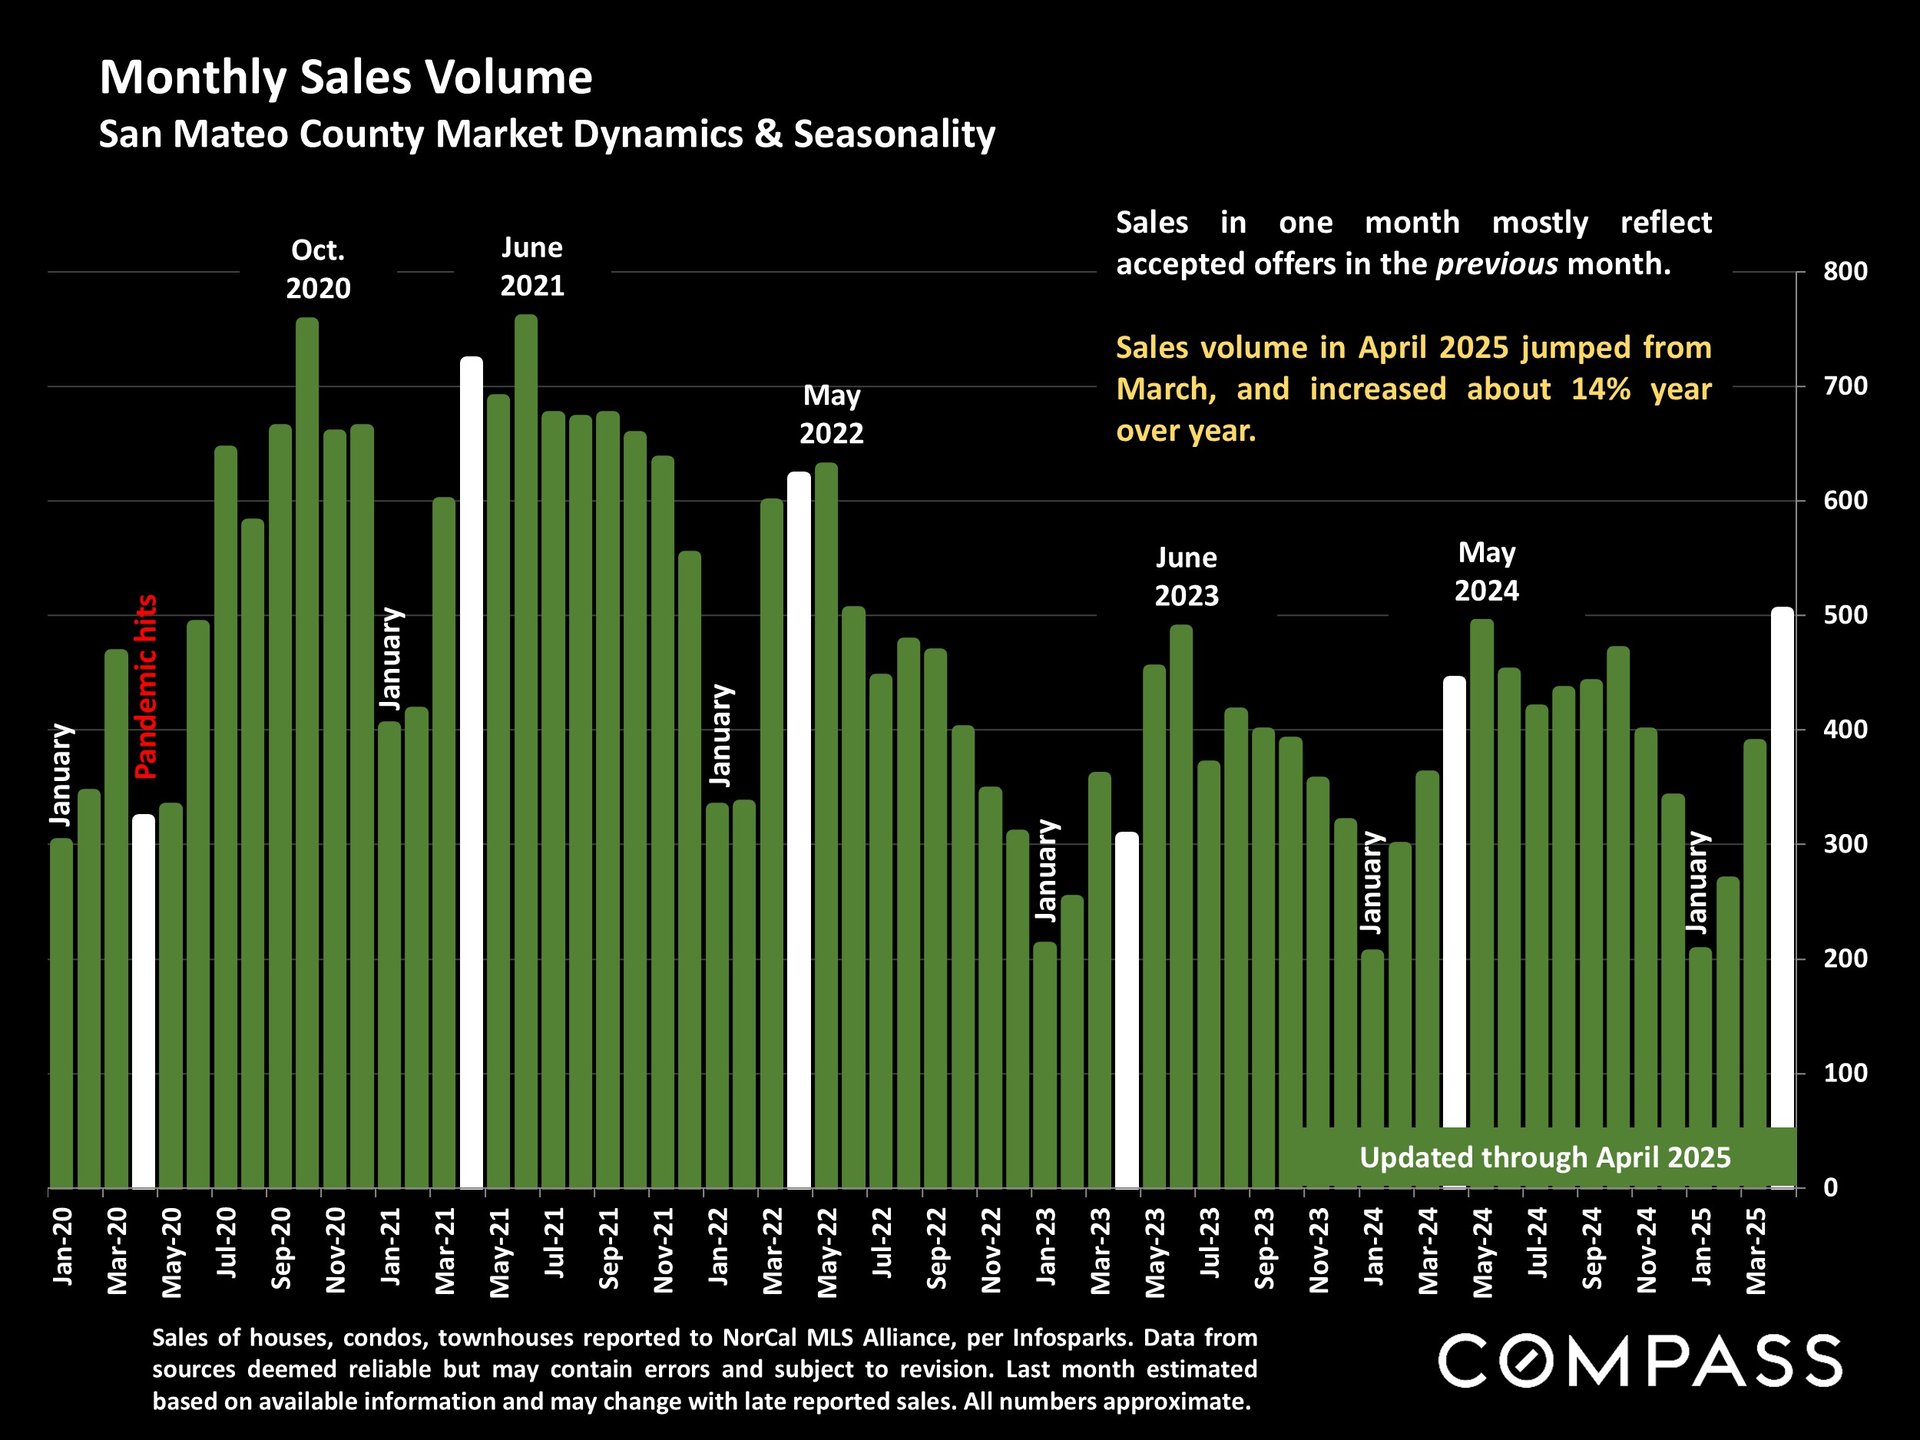
Chart of San Mateo County monthly home sales from 2020 to April 2025, highlighting April’s 14% year-over-year increase.


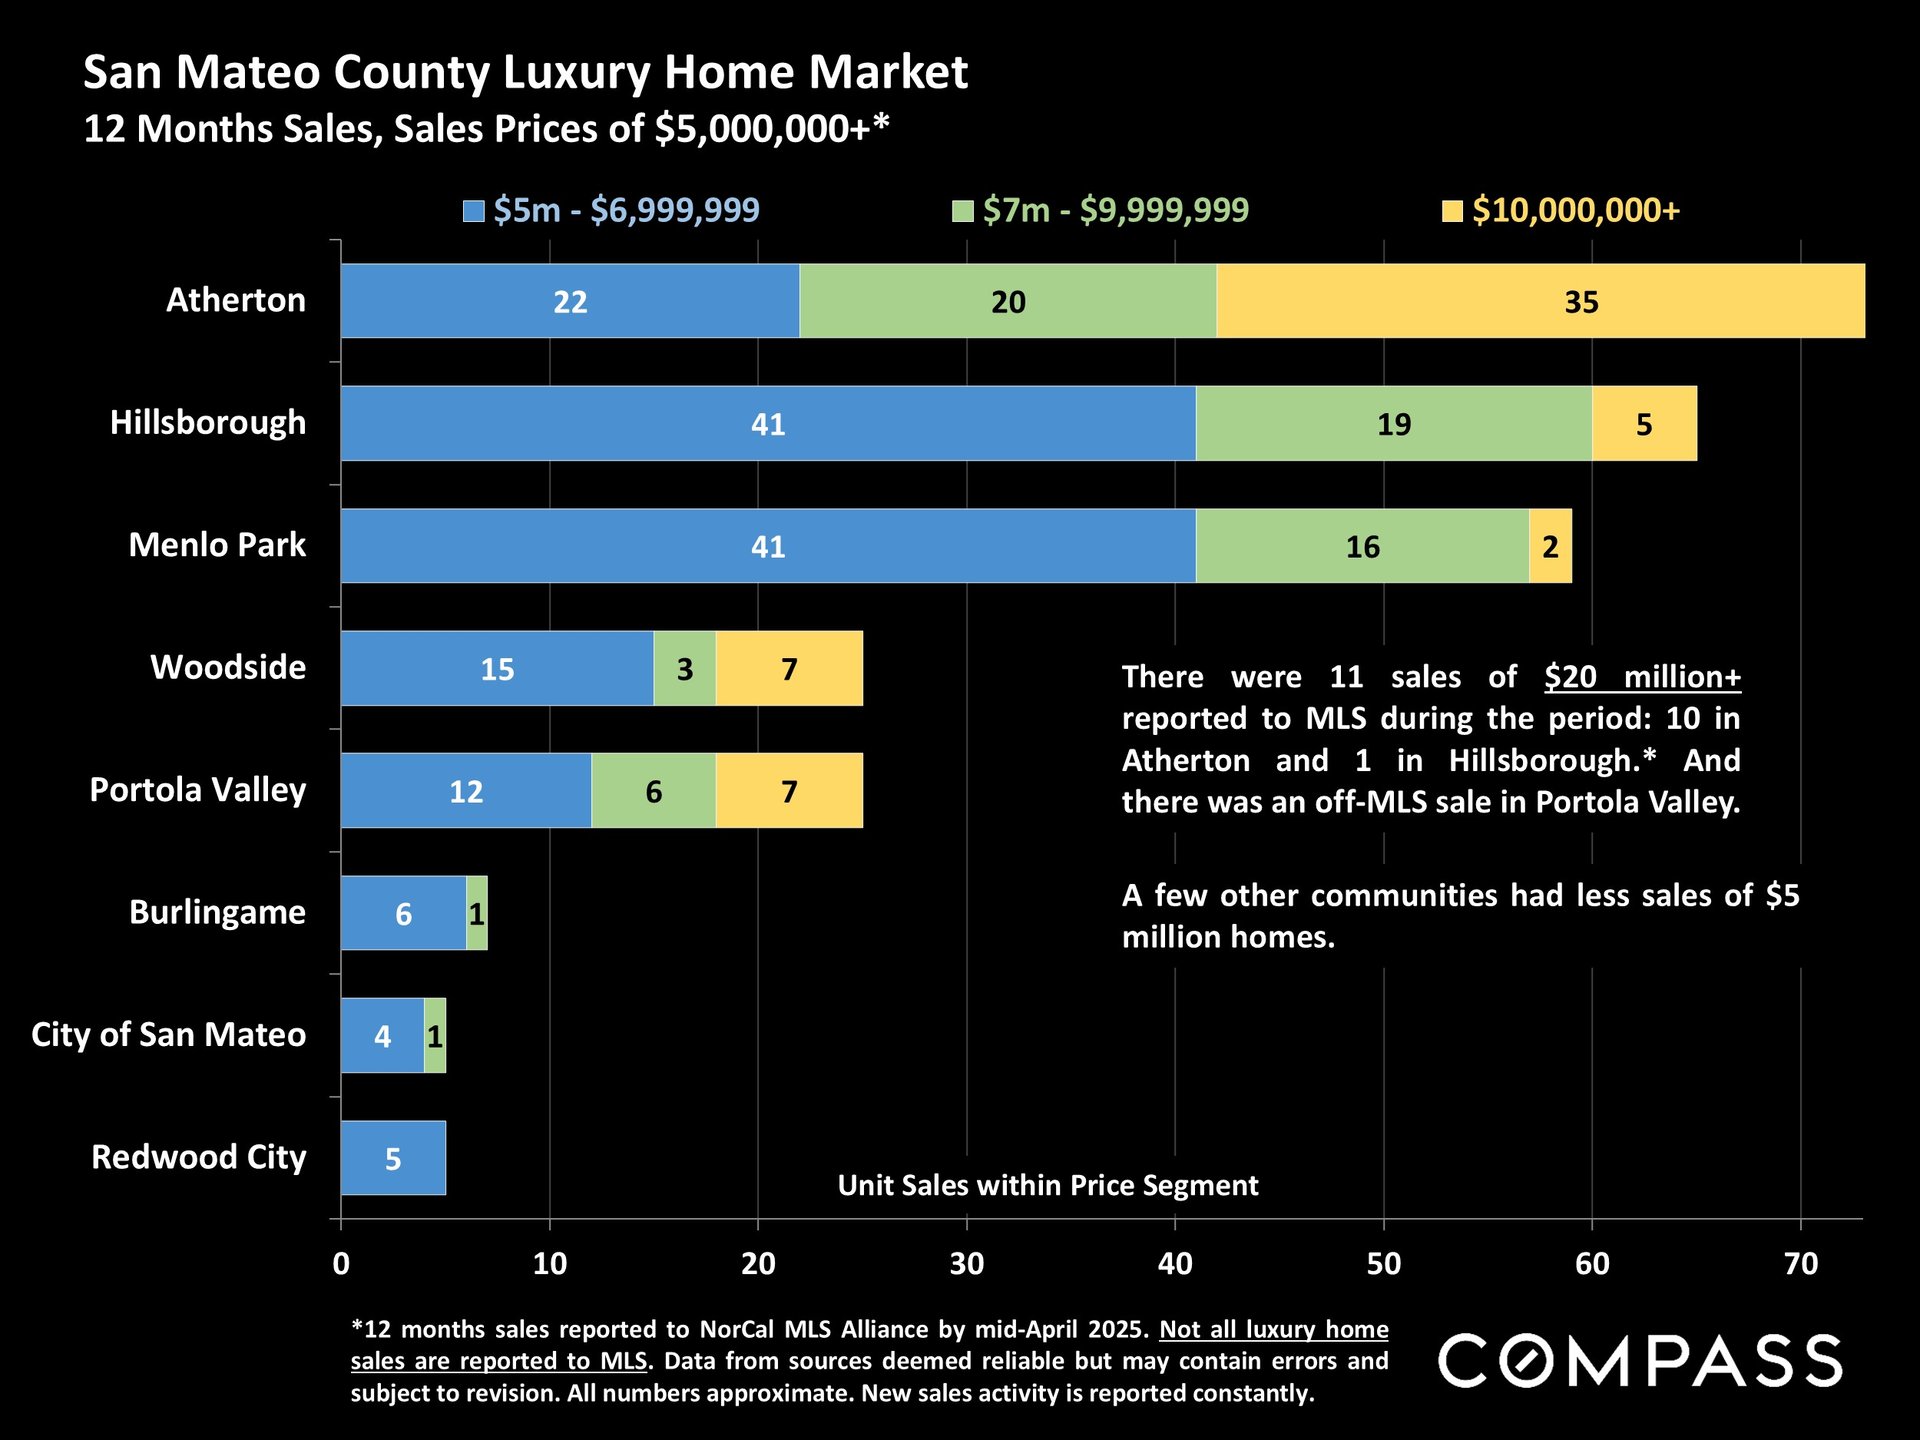
Chart of San Mateo County luxury home sales by city and price segment over 12 months.


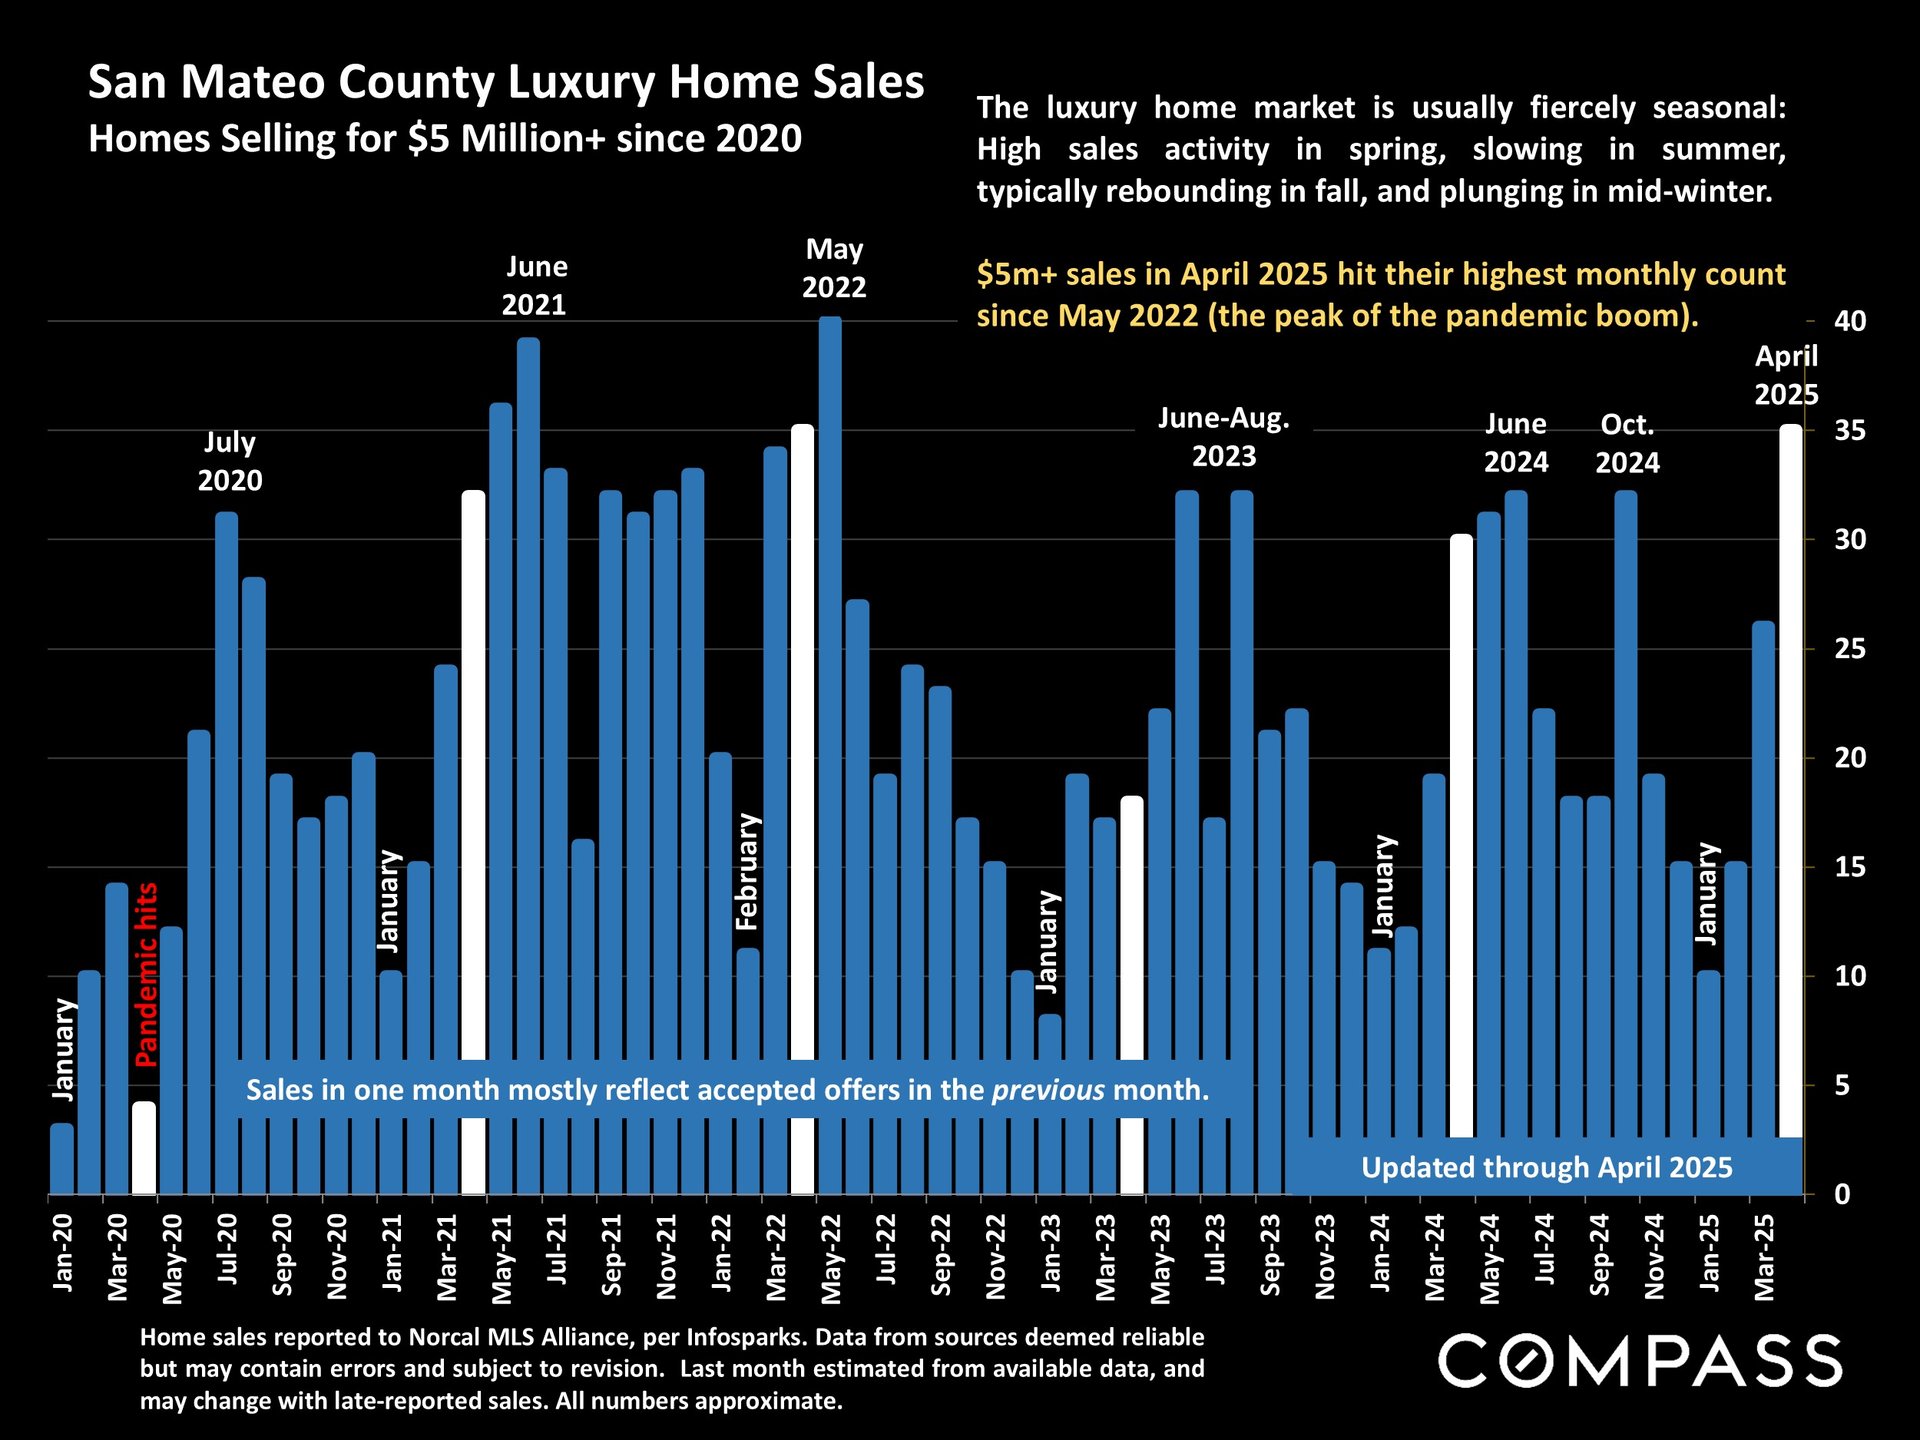
Bar chart of San Mateo County luxury home sales over $5 million, January 2020 through April 2025.


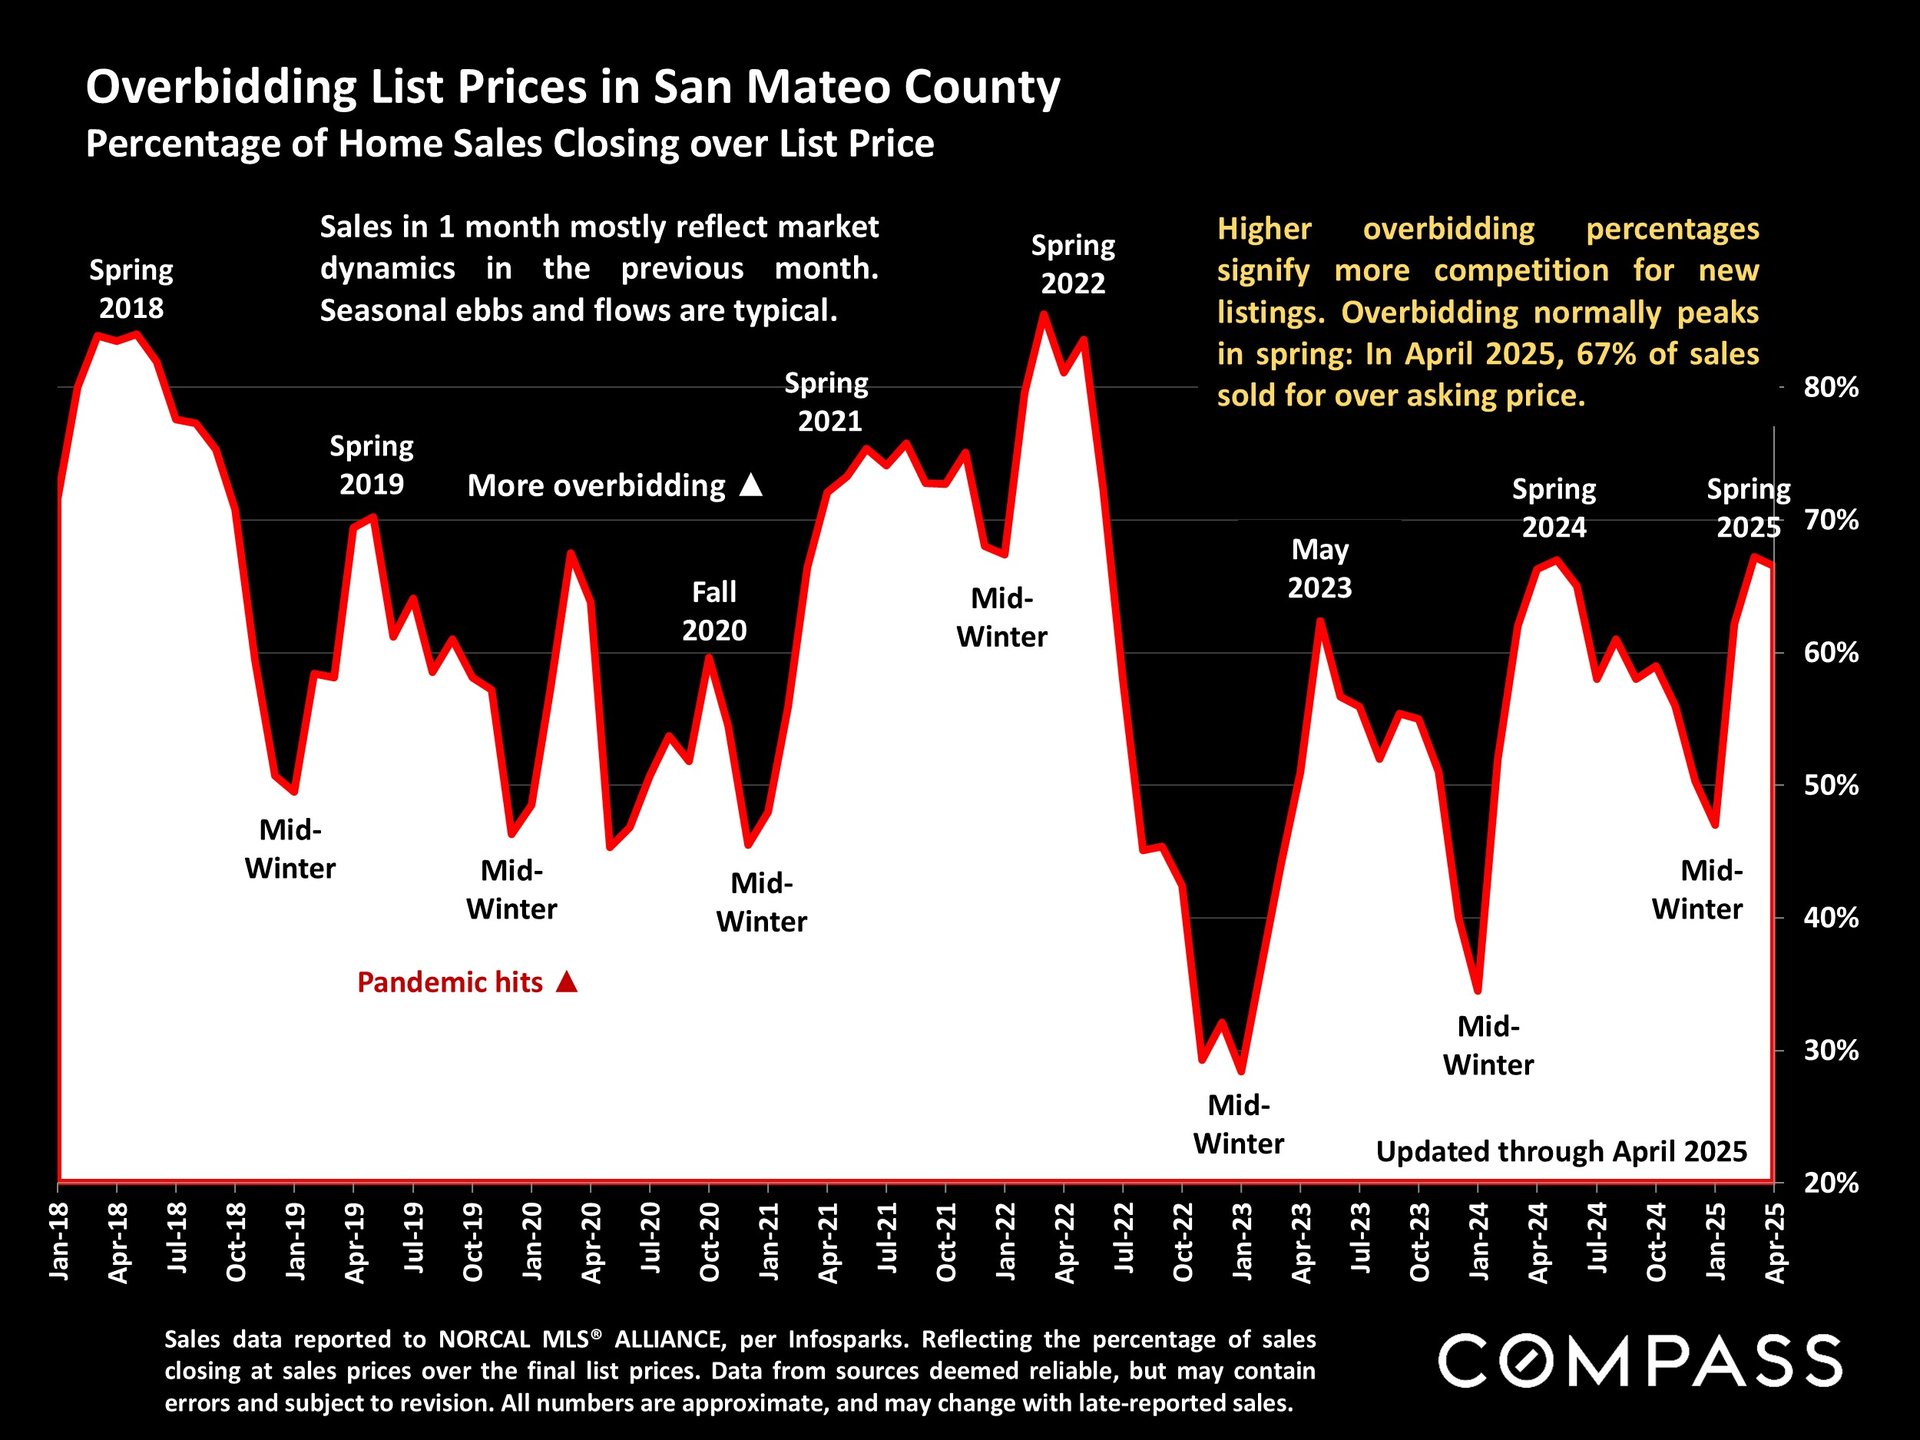
Chart of San Mateo County home sales over list price, with monthly rates from 2018 through April 2025.


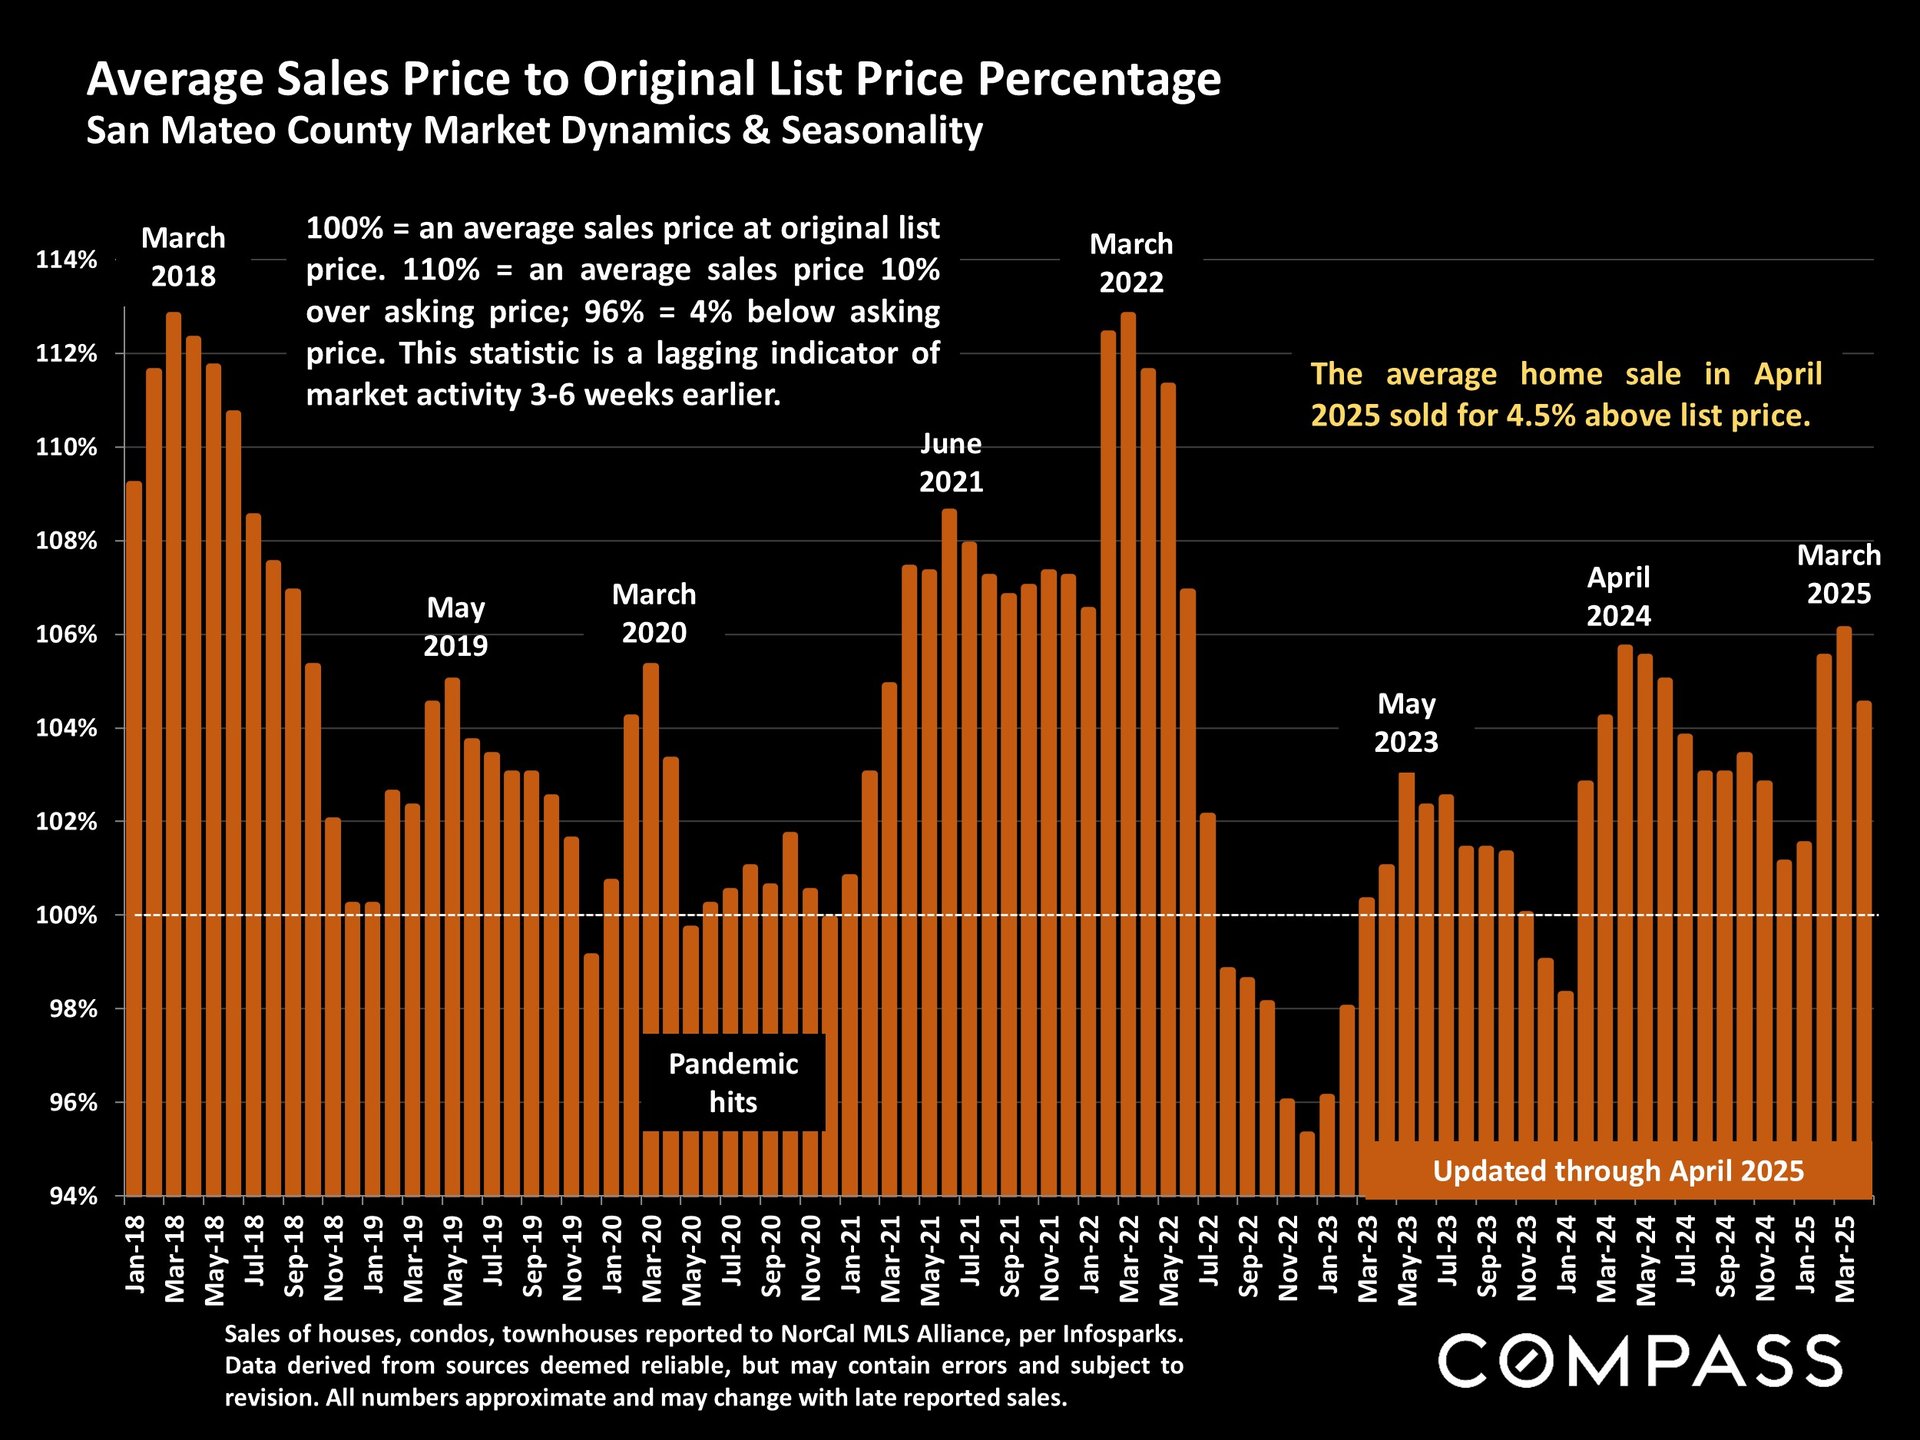
San Mateo County sale-to-list price chart, January 2018–March 2025; April 2025 average sale was 4.5% above list.


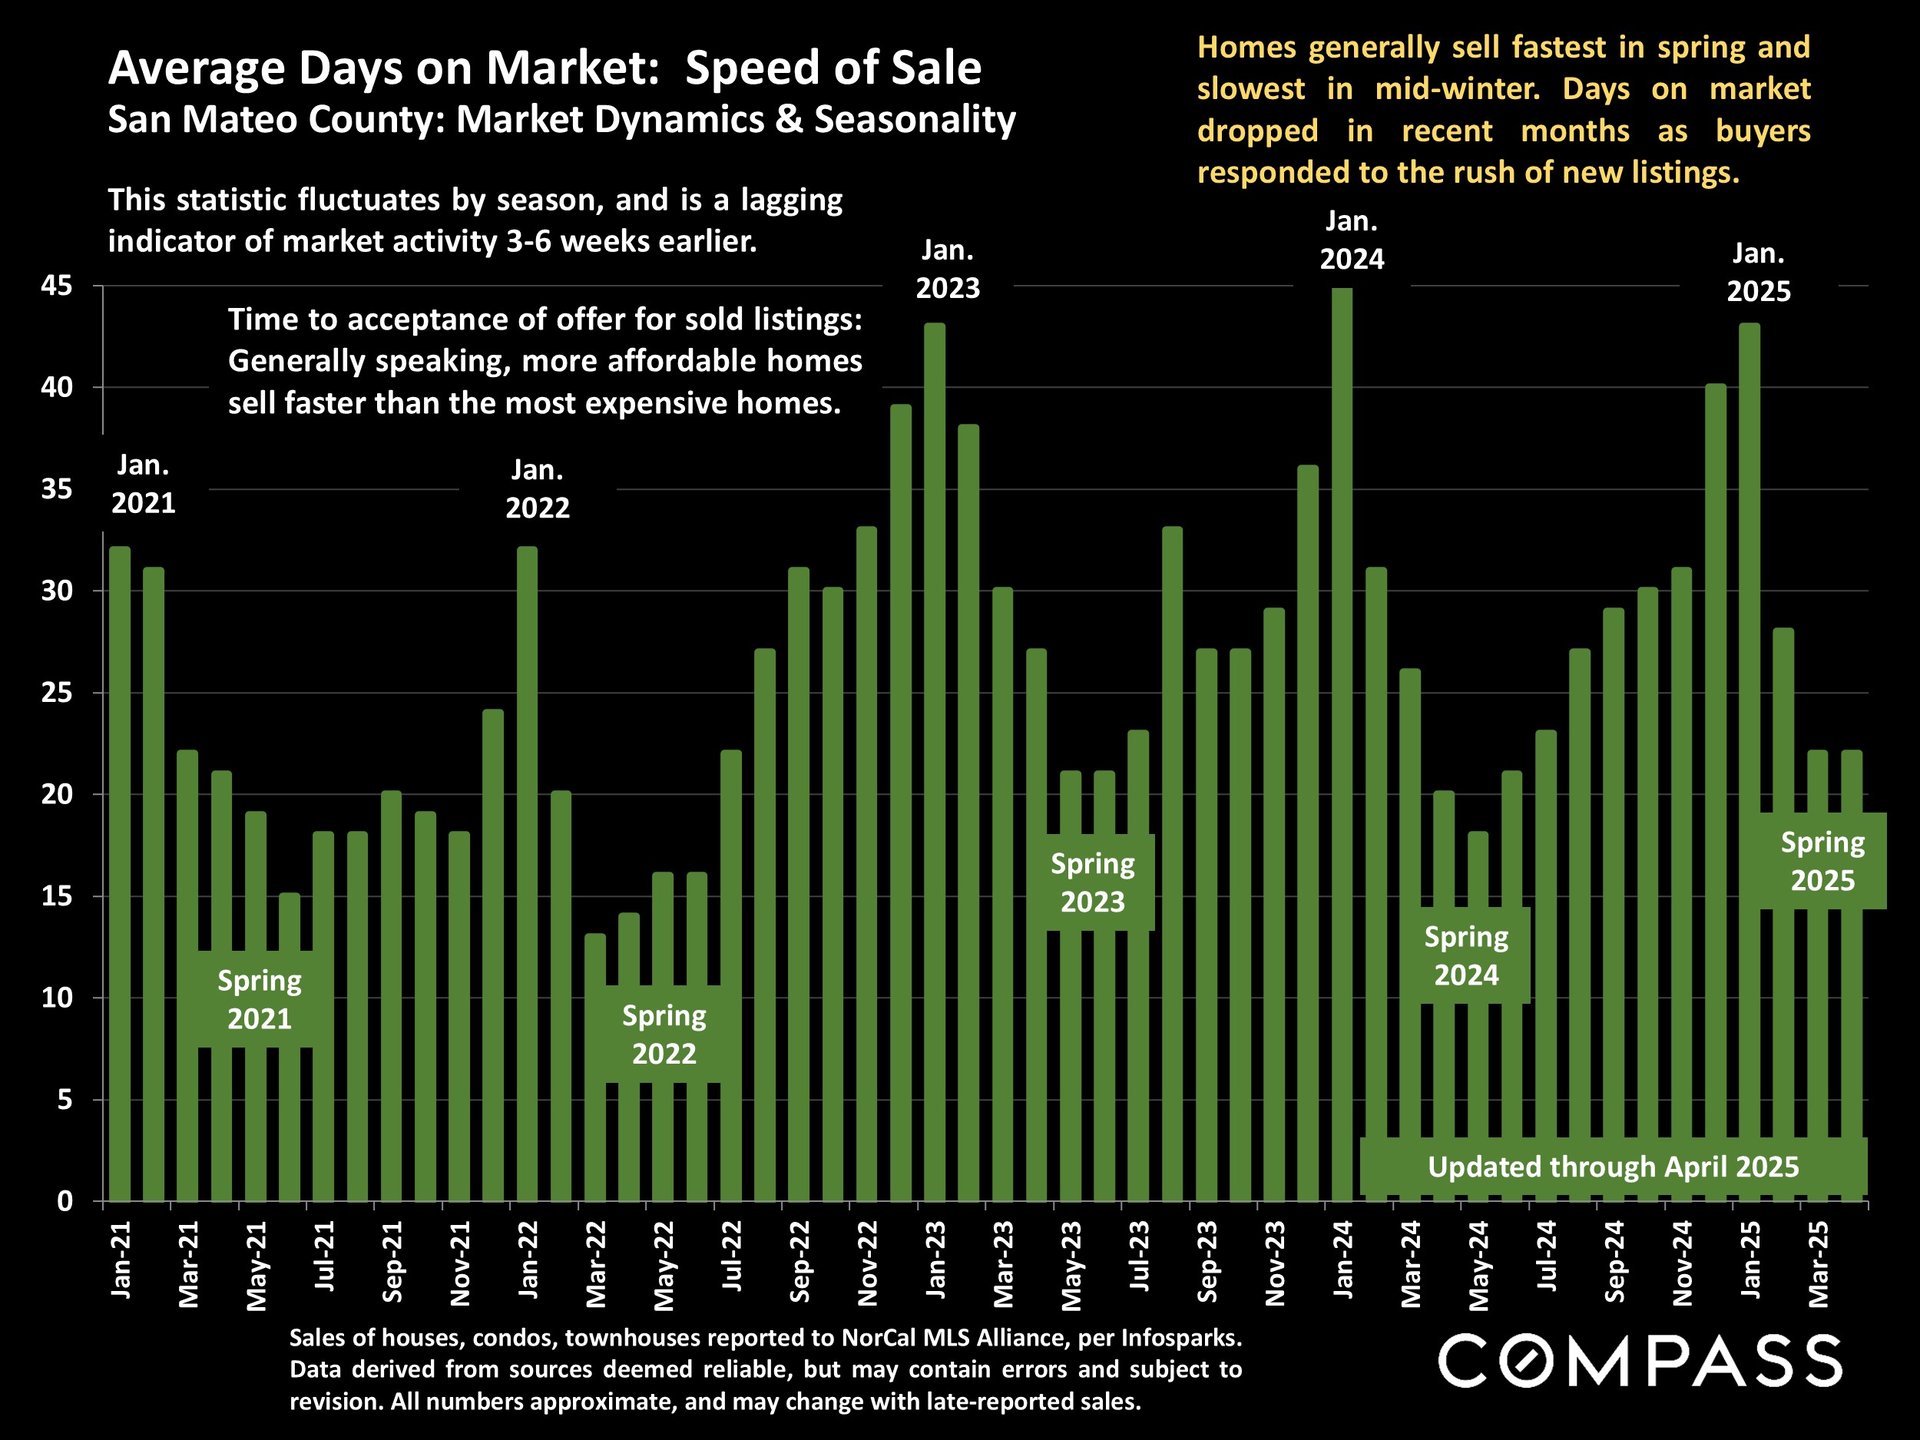
San Mateo County days-on-market chart from January 2021 through April 2025, with seasonal patterns and spring labels.


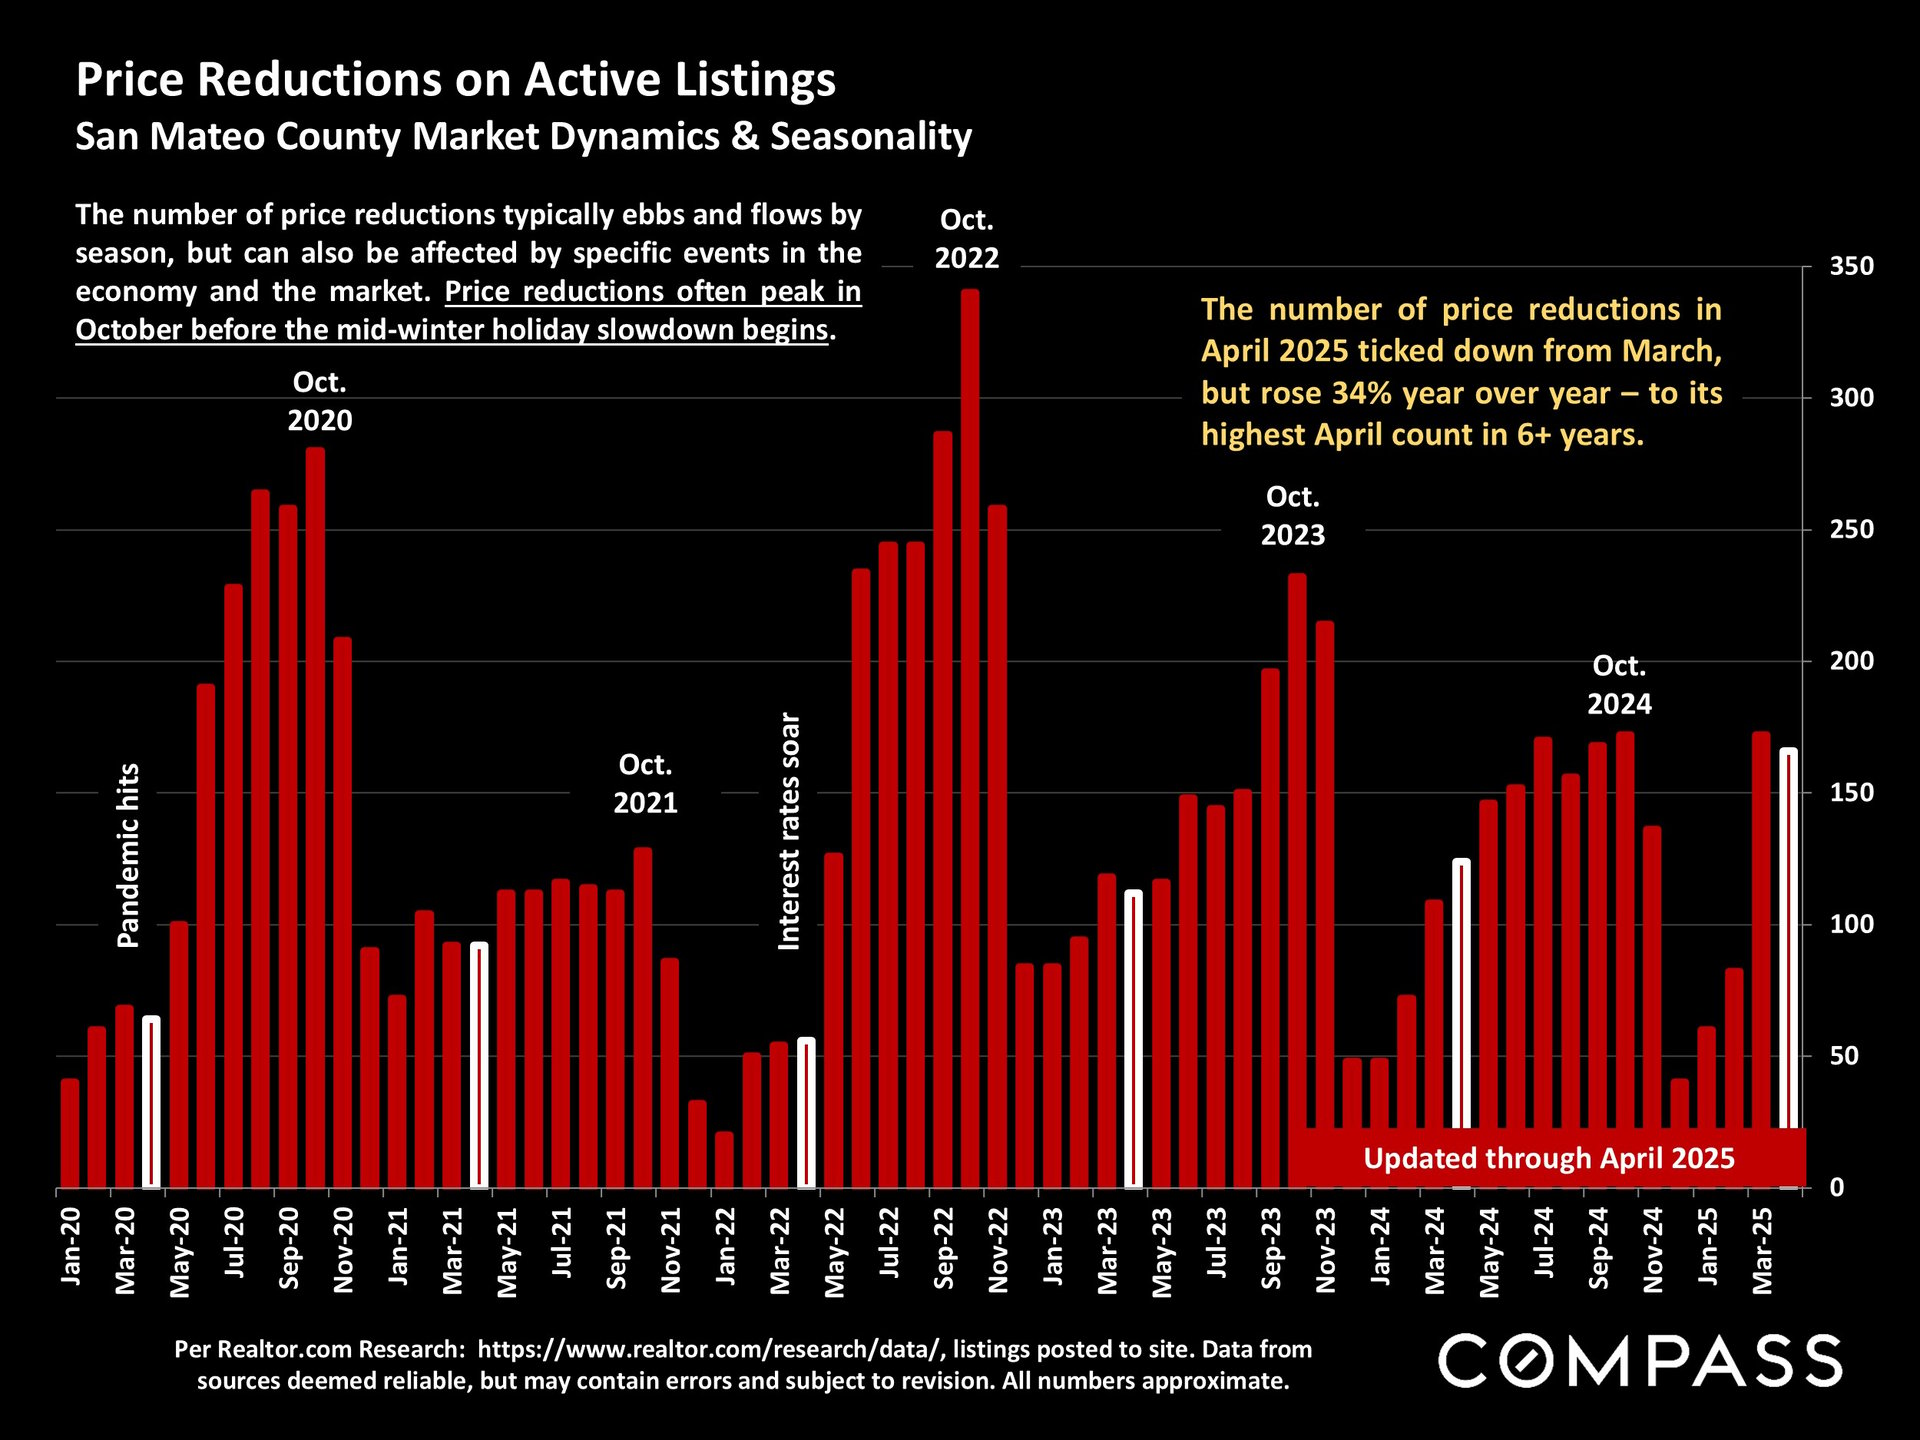
San Mateo County monthly price reductions, with April 2025 up 34% year over year and the highest April count in six years.


Chart of San Mateo County listings with price reductions, showing monthly percentages from January 2020 through April 2025.


Work With Us

We pride ourselves in providing personalized solutions that bring our clients closer to their dream properties and enhance their long-term wealth.
Contact Us

Follow Us On Instagram