Blog

San Mateo 2025 December Market Update

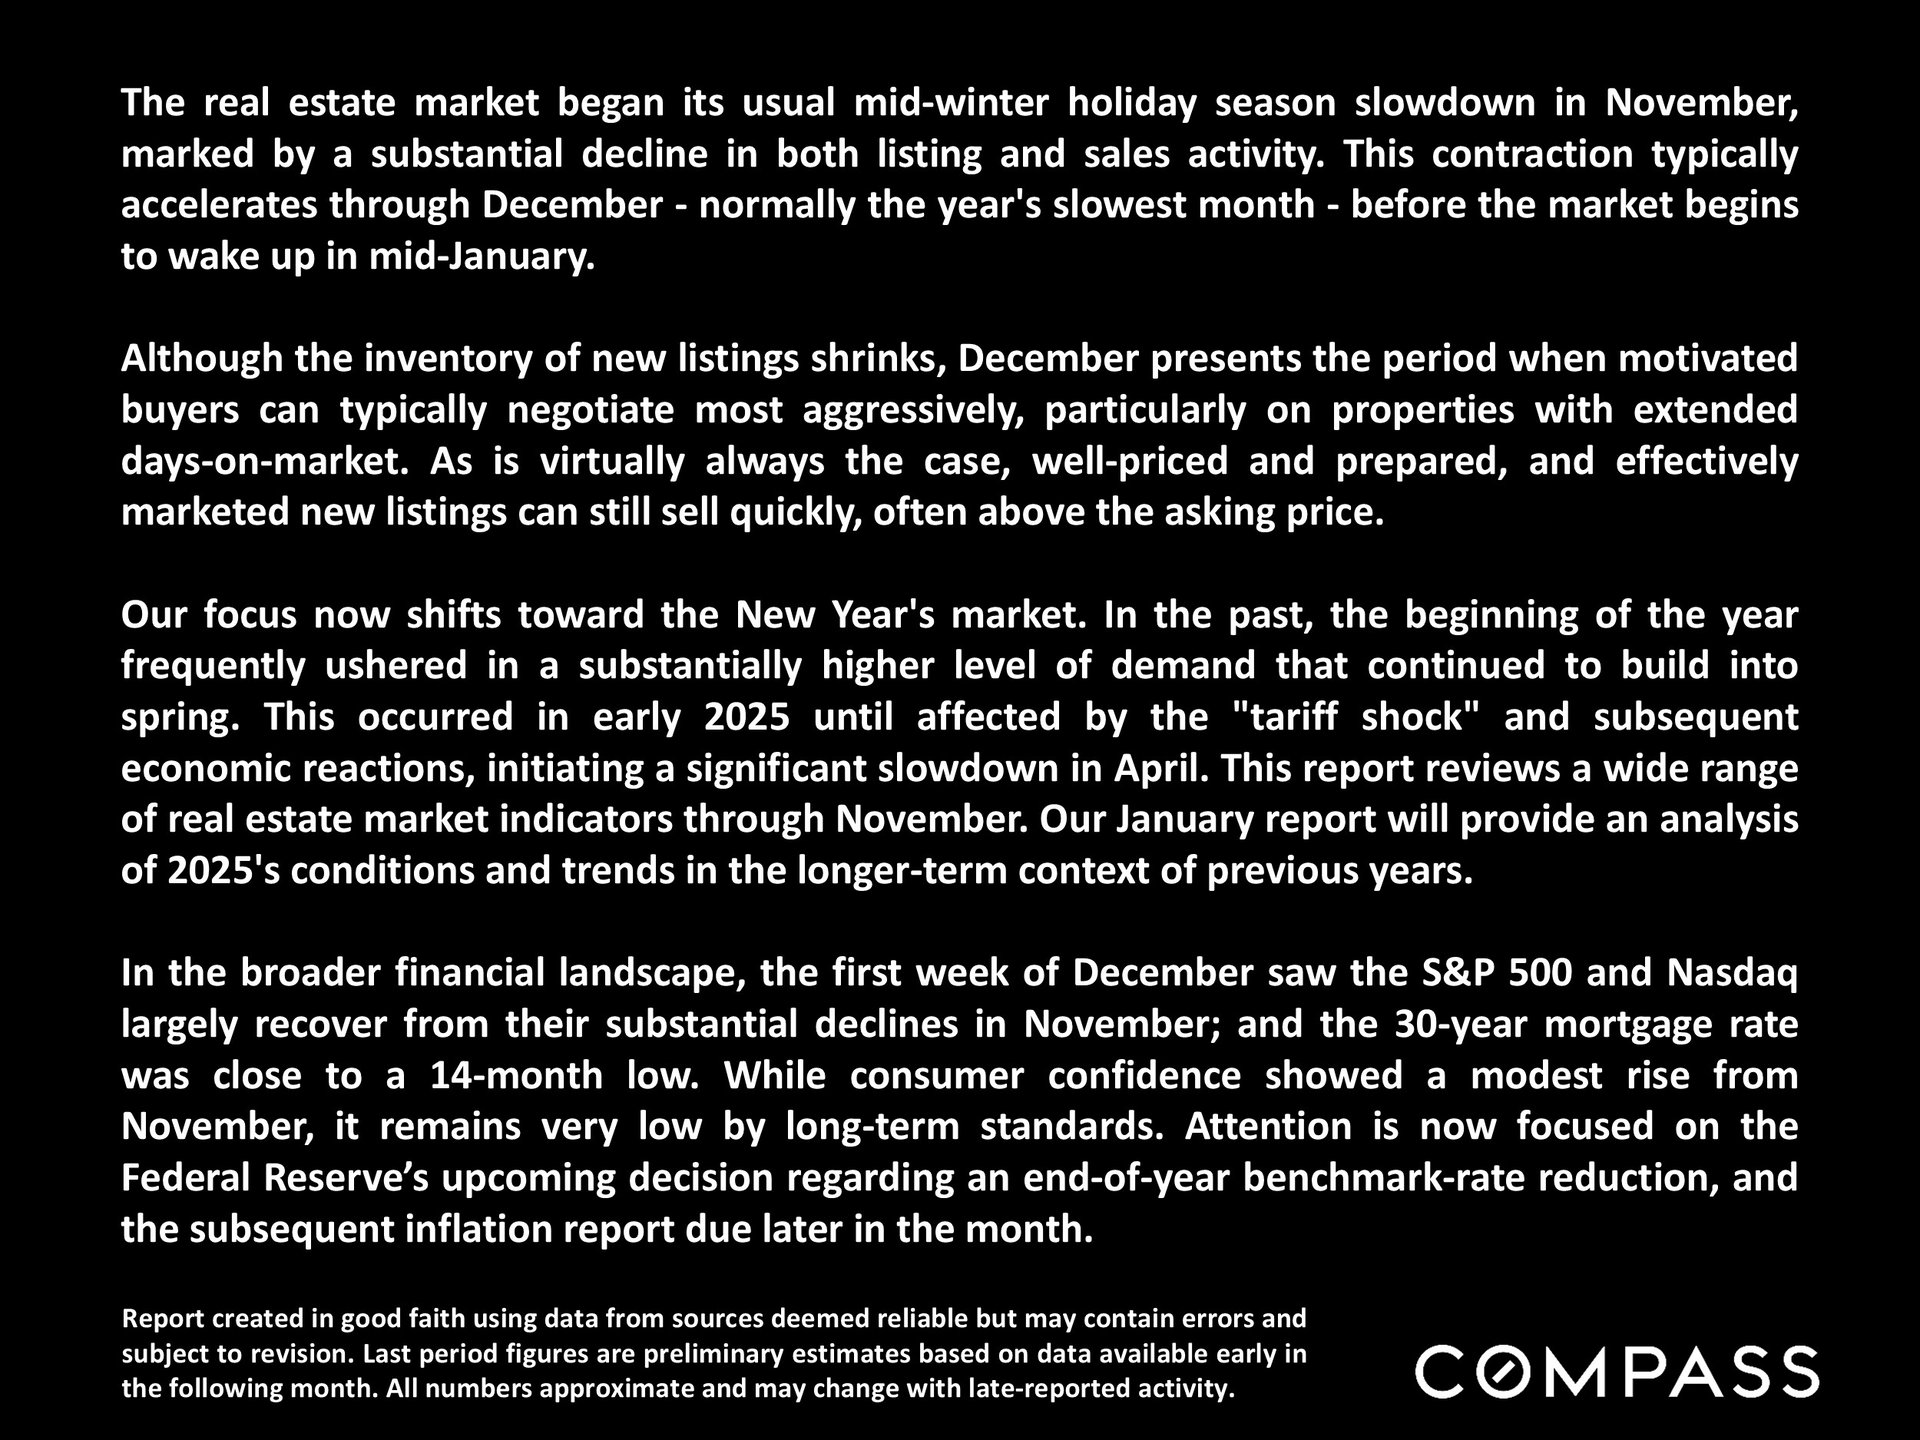
real estate market began its usual mid-winter holiday season slowdown in November, marked by a substantial decline in both listing and sales activity. This contraction typically accelerates through December - normally the year's slowest month - before the market begins to wake up in mid-January. Although the inventory of new listings shrinks, December presents the period when motivated buyers can typically negotiate most aggressively, particularly on properties with extended days-on-market. As is virtually always the case, well-priced and prepared, and effectively marketed new listings can still sell quickly, often well above the asking price. Our focus now shifts toward the New Year's market. In the past, the beginning of the year frequently ushered in a substantially higher level of demand that continued to build into spring. This occurred in early 2025 until affected by the "tariff shock" and subsequent economic reactions, initiating a significant slowdown in April. This report reviews a wide range of real estate market indicators through November. Our January report will provide an analysis of 2025's conditions and trends in the longer-term context of previous years. In the broader financial landscape, the first week of December saw the S&P 500 and Nasdaq largely recover from their substantial declines in November; and the 30-year mortgage rate was close to a 14-month low. While consumer confidence showed a modest rise from November, it remains very low by long-term standards. Attention is now focused on the Federal Reserve’s upcoming decision regarding an end-of-year benchmark-rate reduction, and the subsequent inflation report due later in the month.

San Mateo County December 2025 real estate market report cover with a coastal hillside view.


San Mateo market update describing the winter slowdown, buyer opportunities, 2025 trends, mortgage rates, and financial indicators.


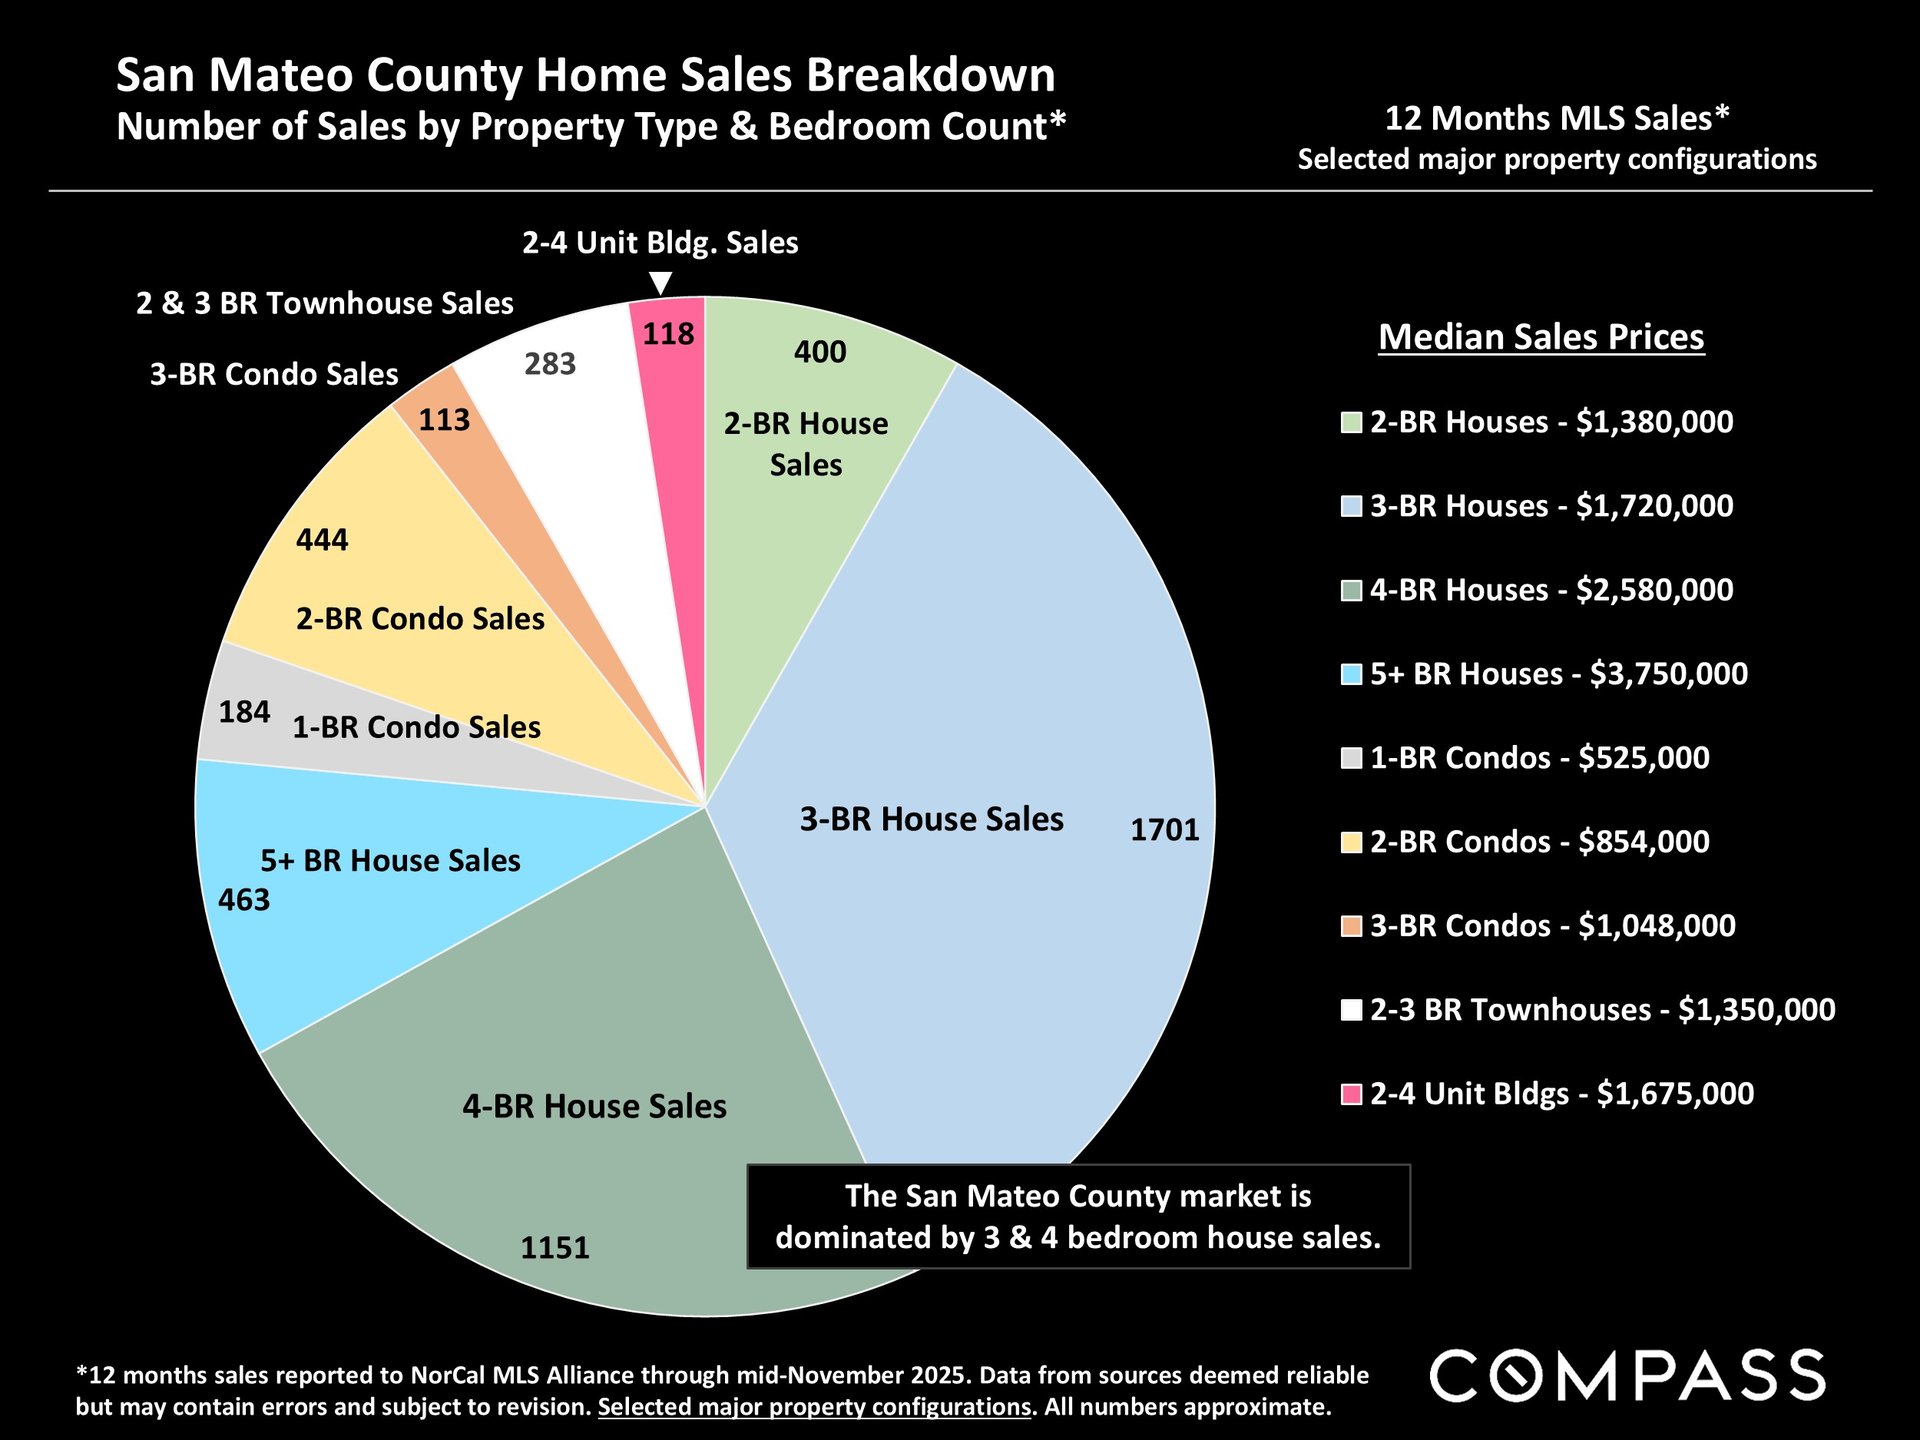
San Mateo County home sales pie chart showing sales counts and median prices by property type and bedroom count.


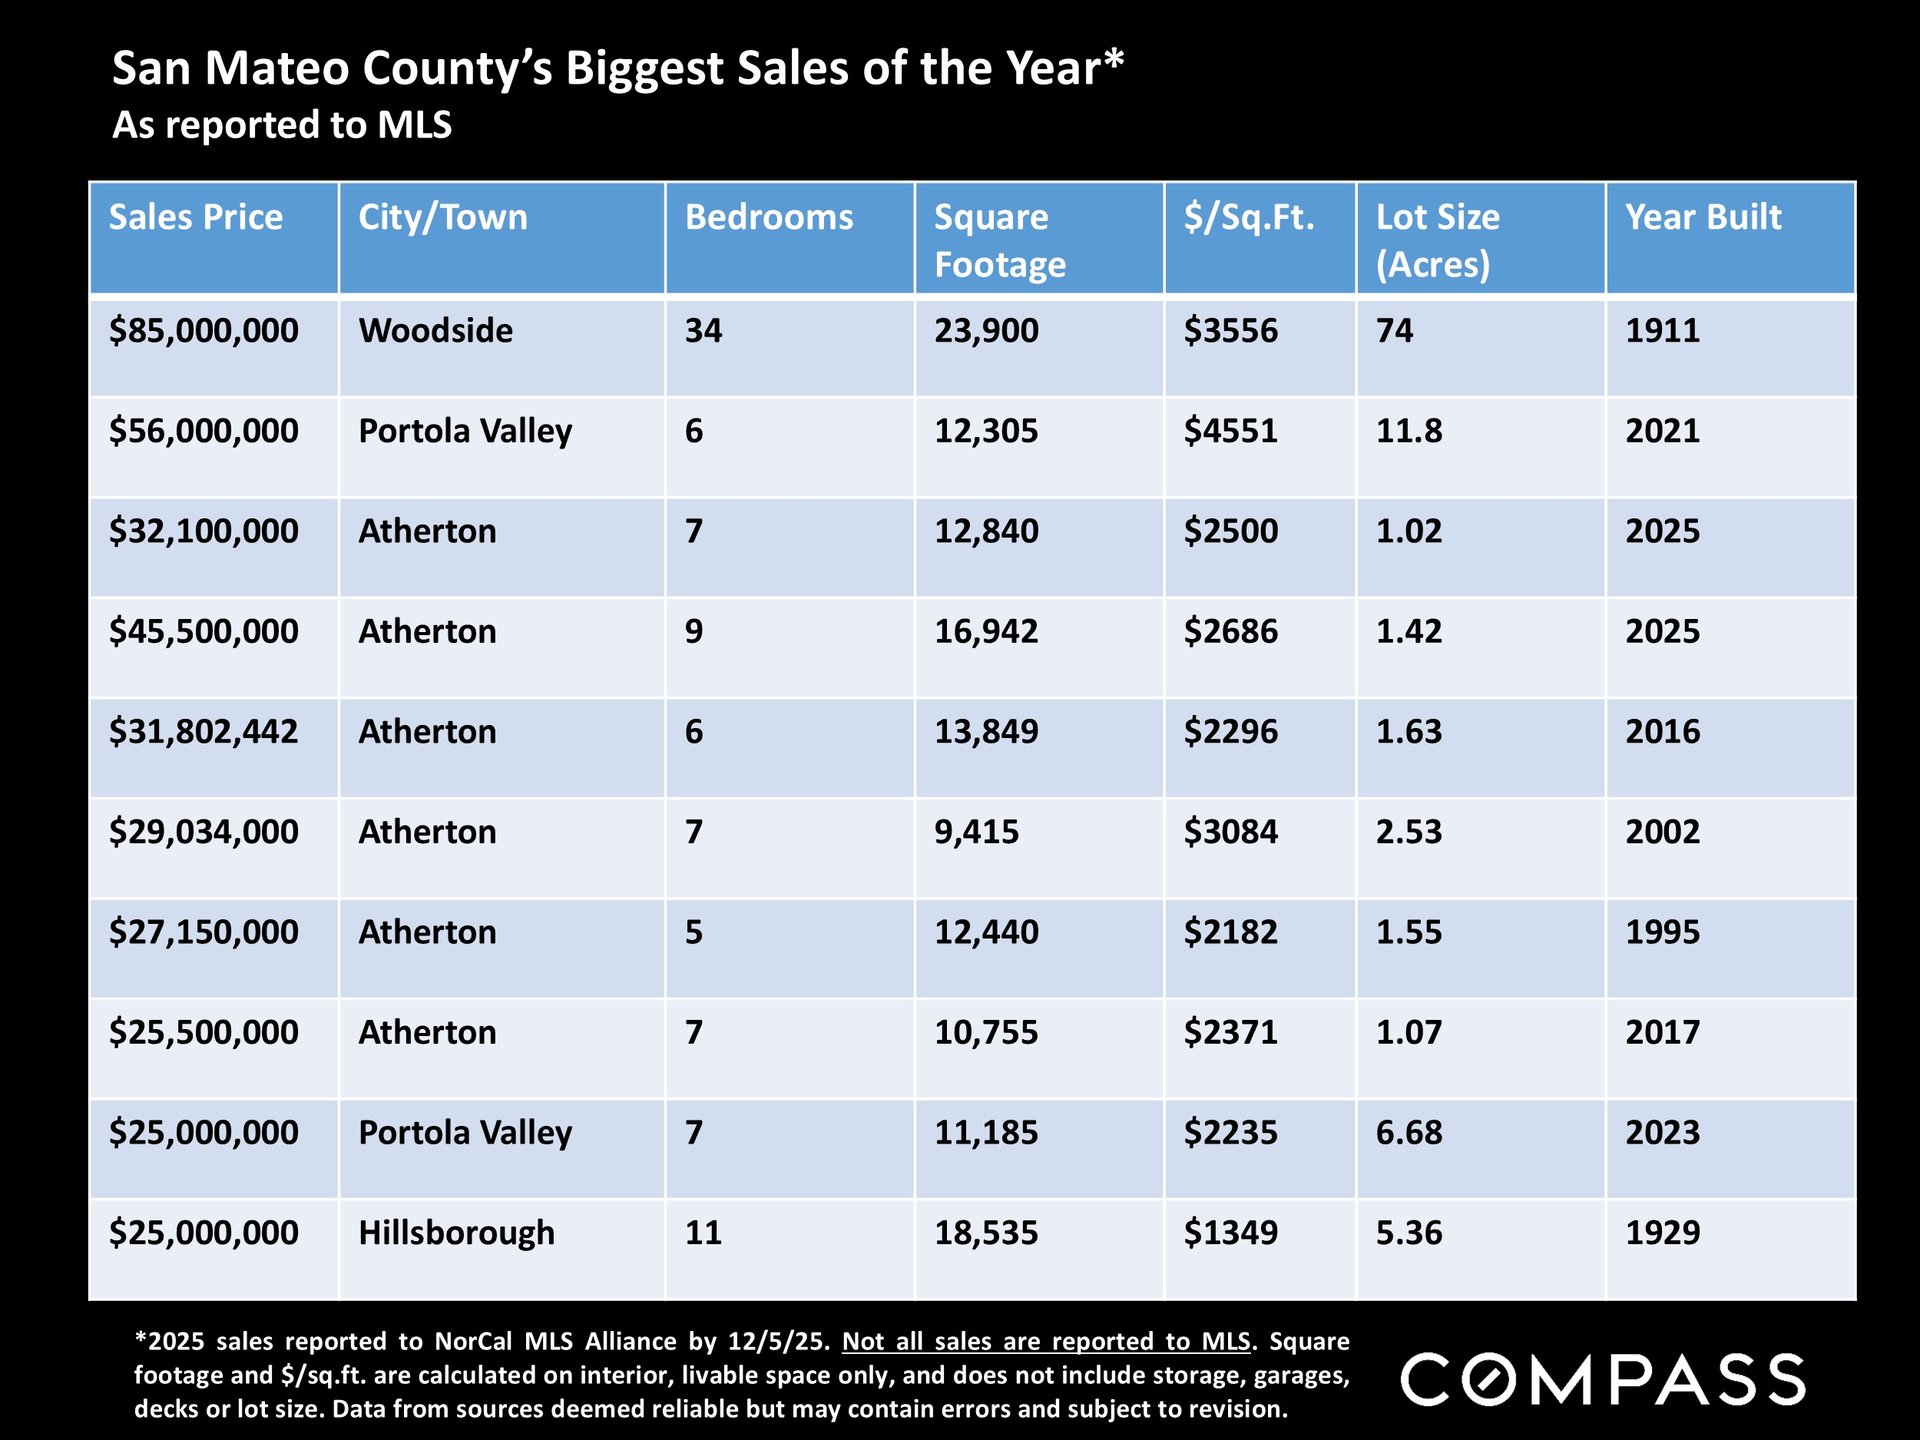
Table of San Mateo County’s biggest reported 2025 home sales, with prices and property details.


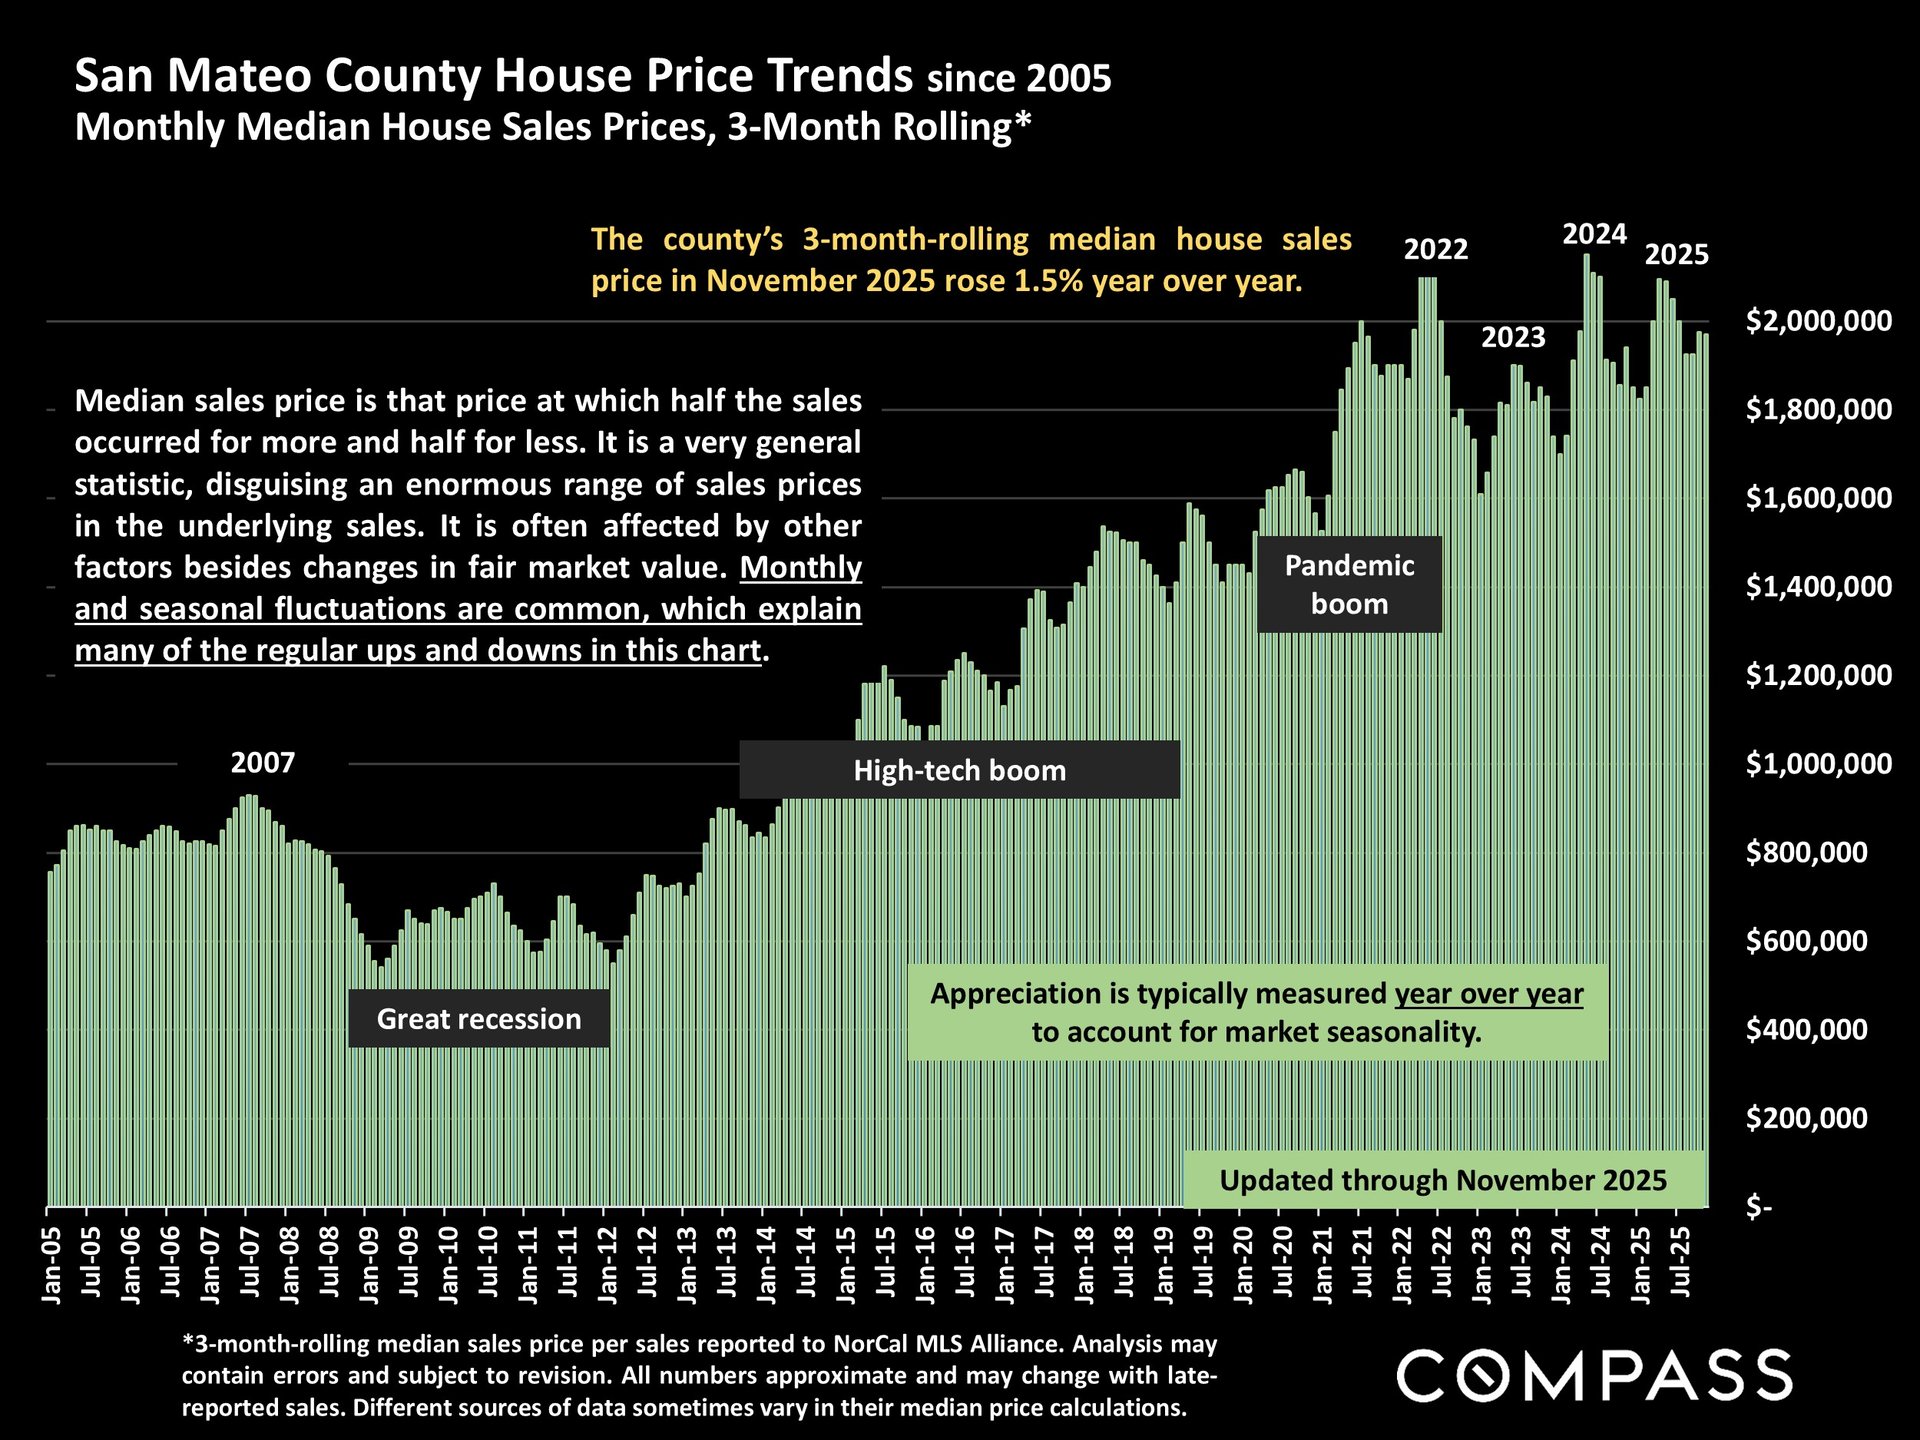
San Mateo County home price trend chart, 2005–2025, with recession, high-tech boom, and pandemic boom labeled.


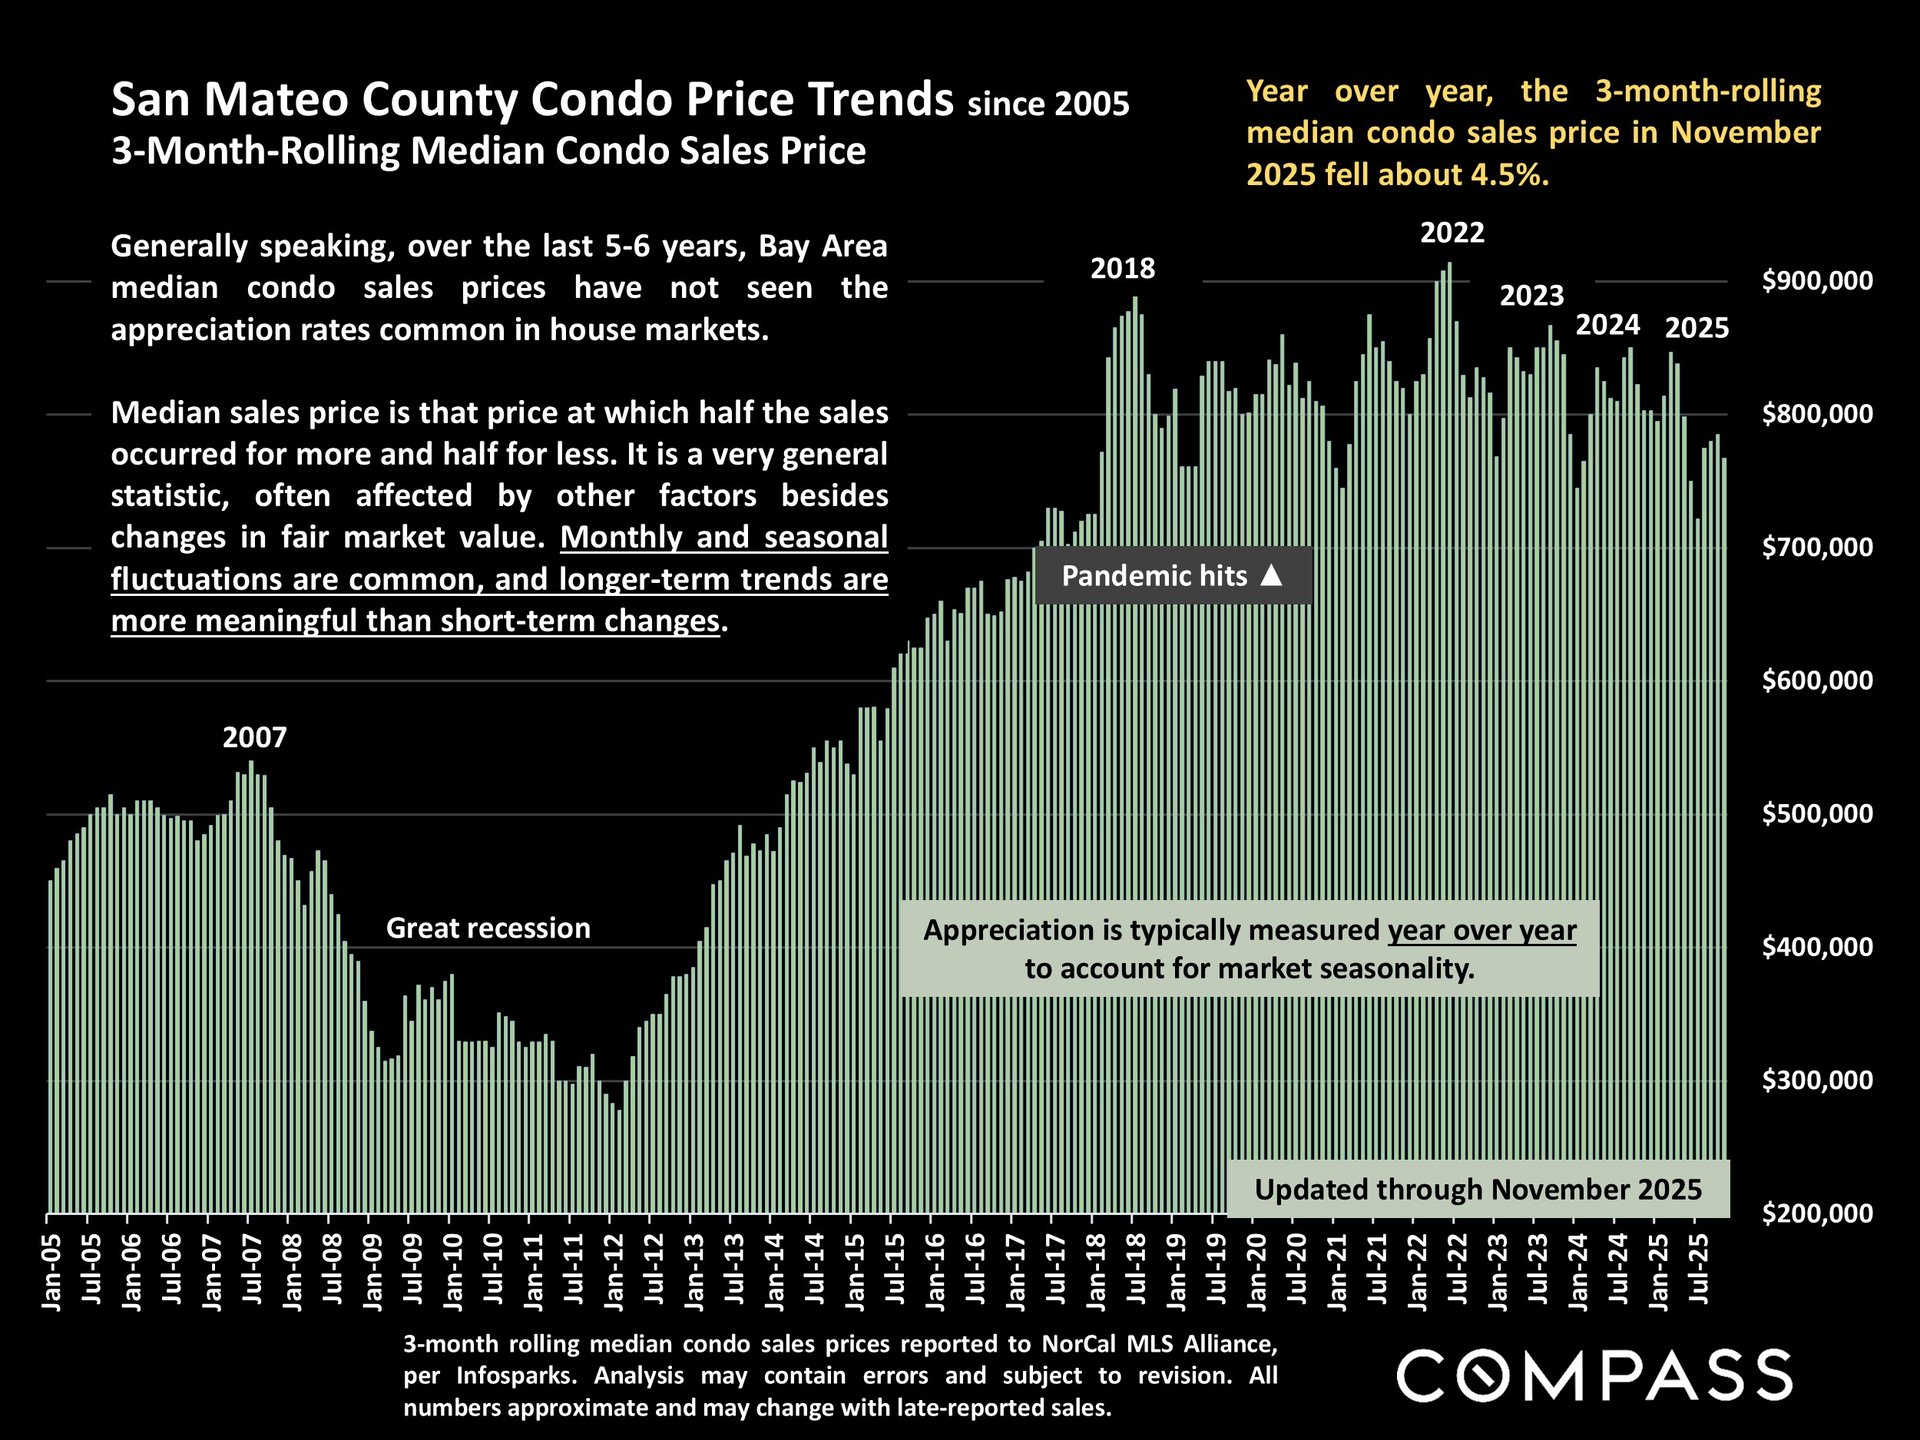
Chart of San Mateo County condo prices from 2005 to 2025, peaking in 2022 before declining.


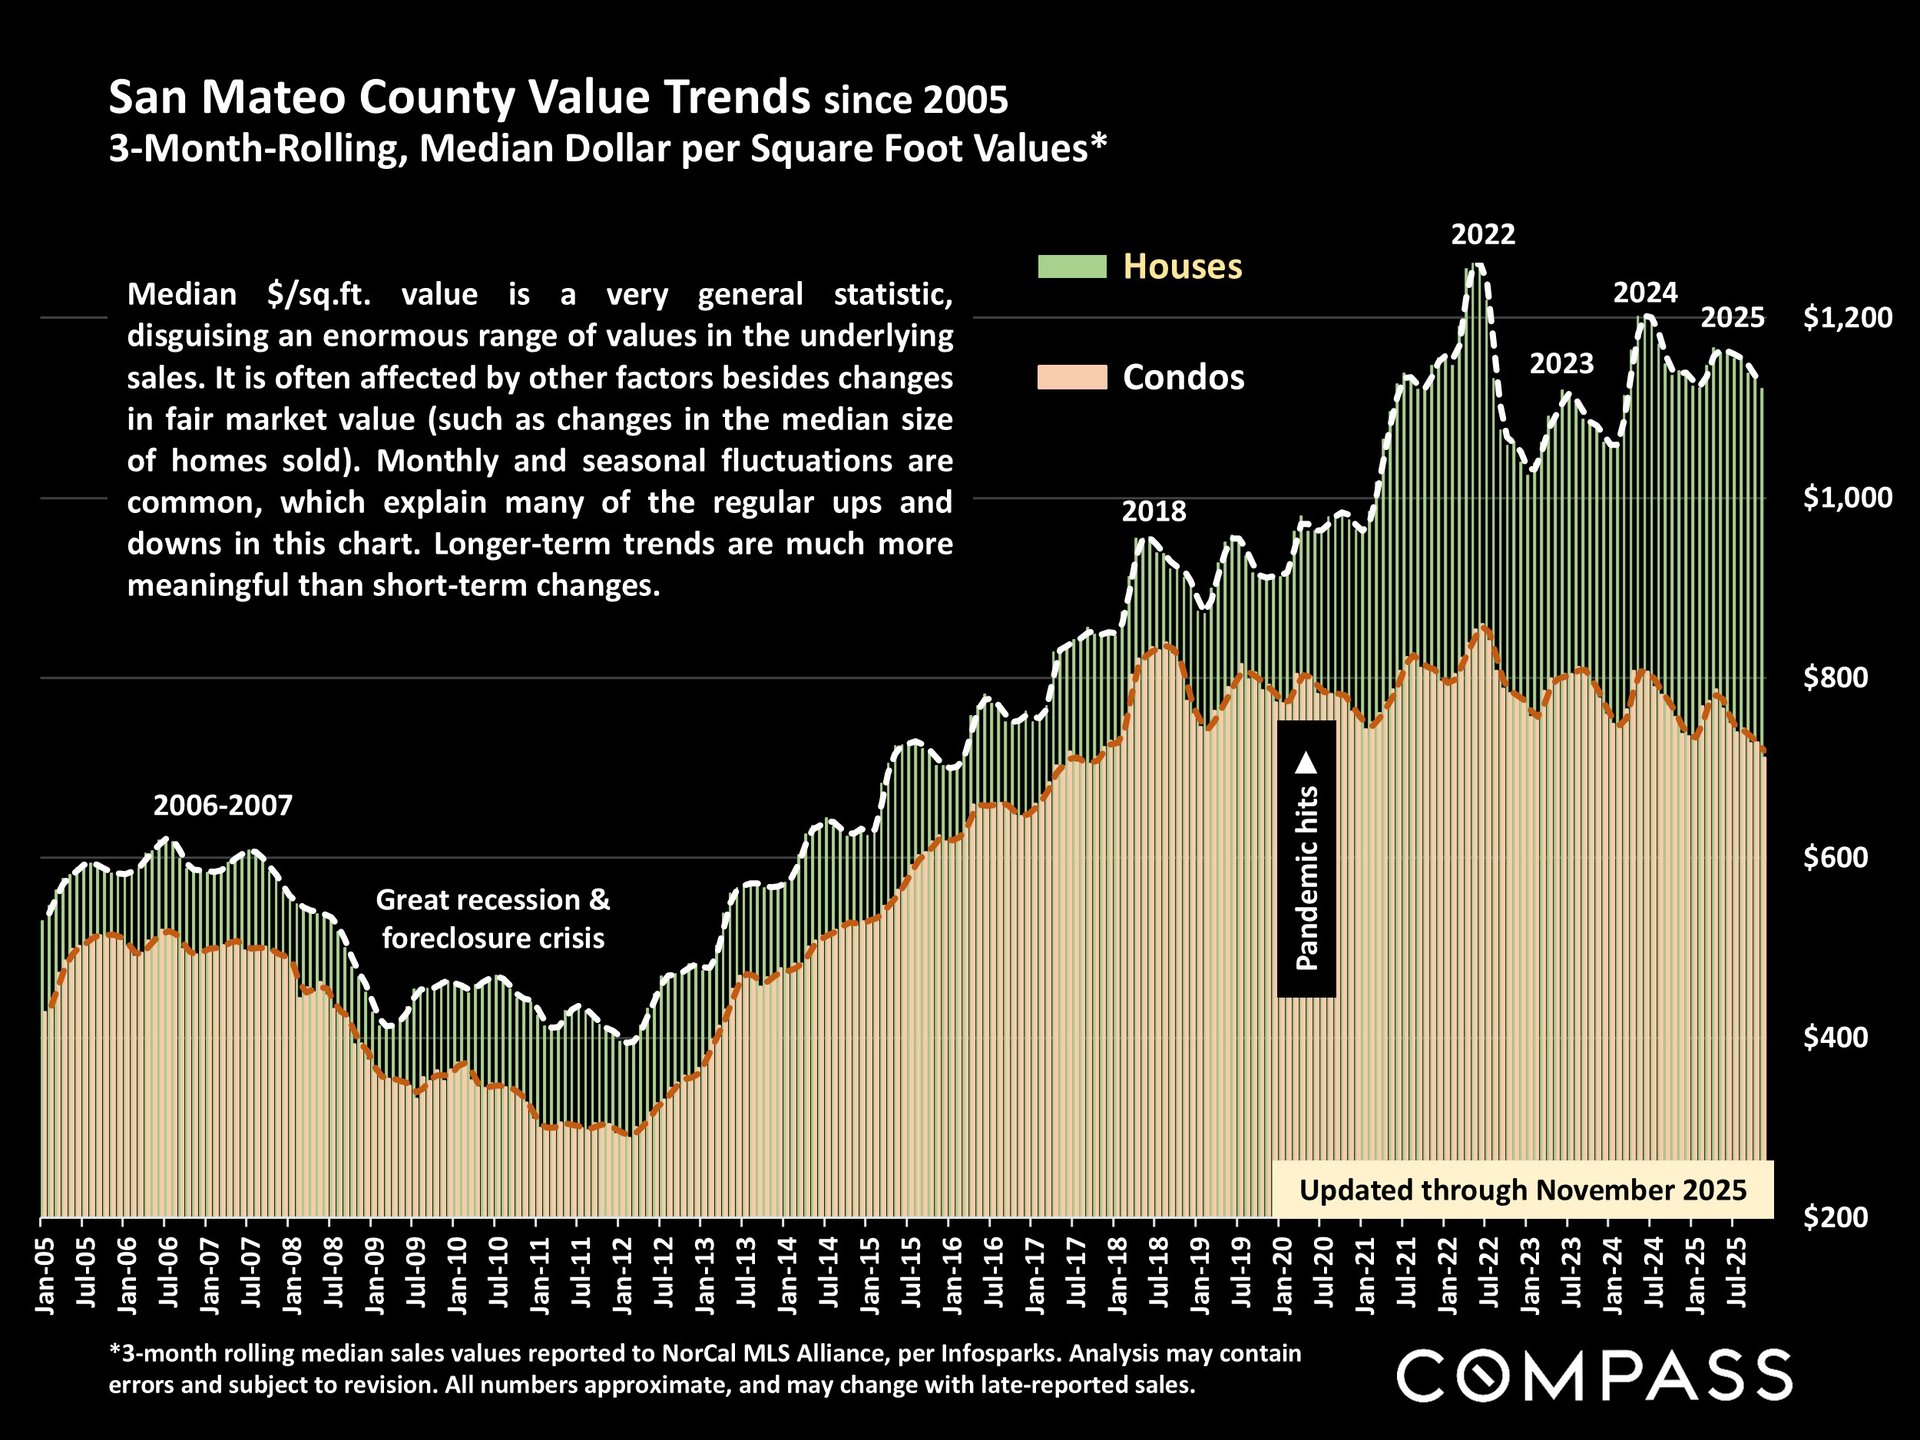
San Mateo County house and condo price-per-square-foot trends from 2005 through November 2025.


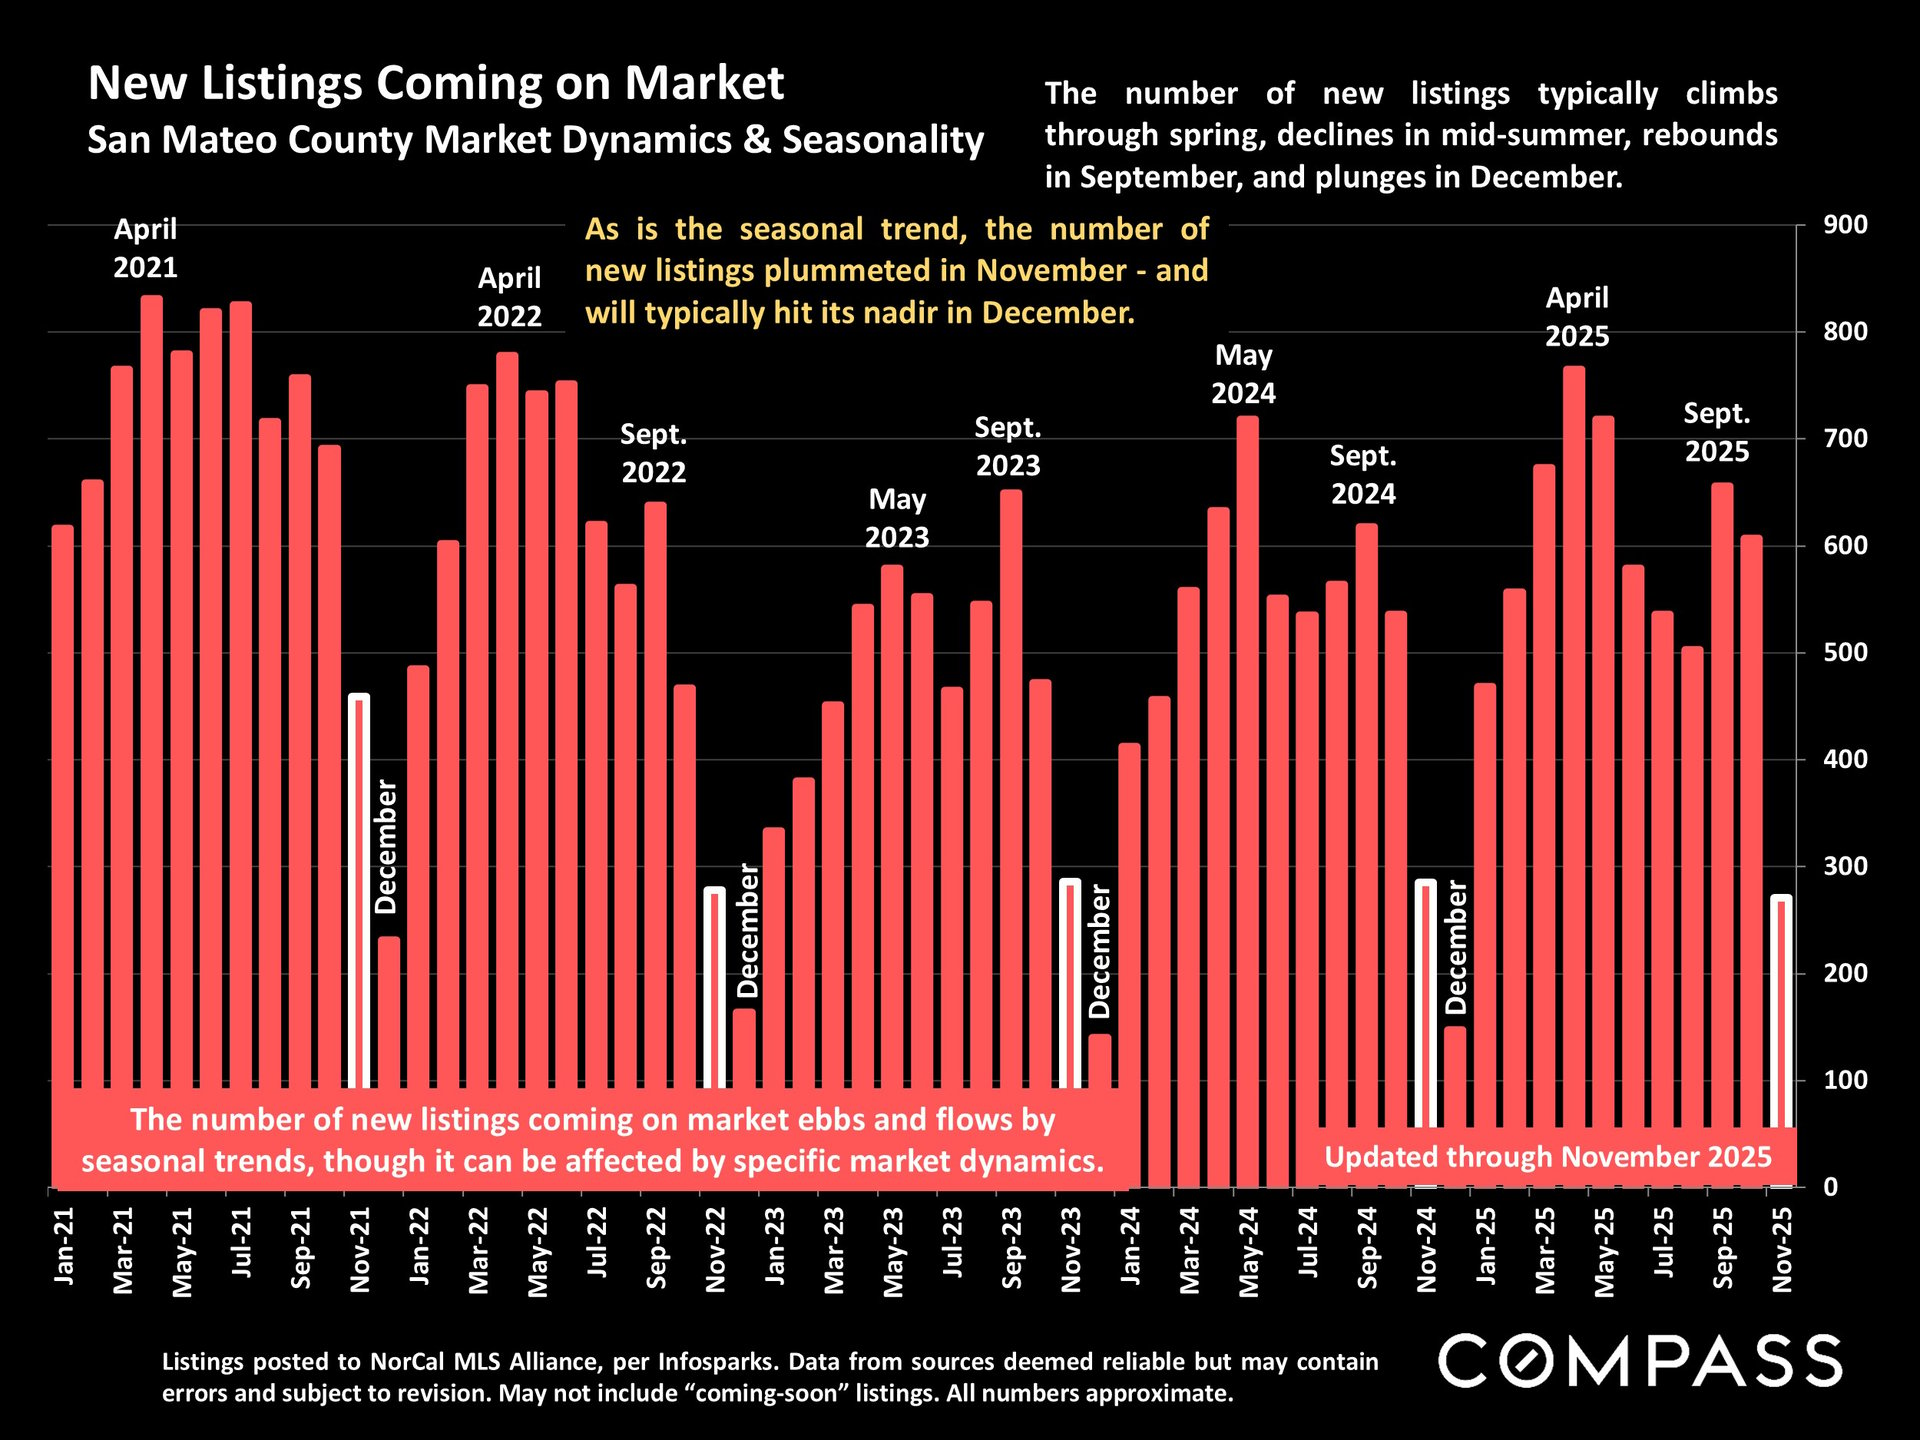
San Mateo County monthly new-listings chart, showing seasonal spring peaks and December declines from 2021 to 2025.


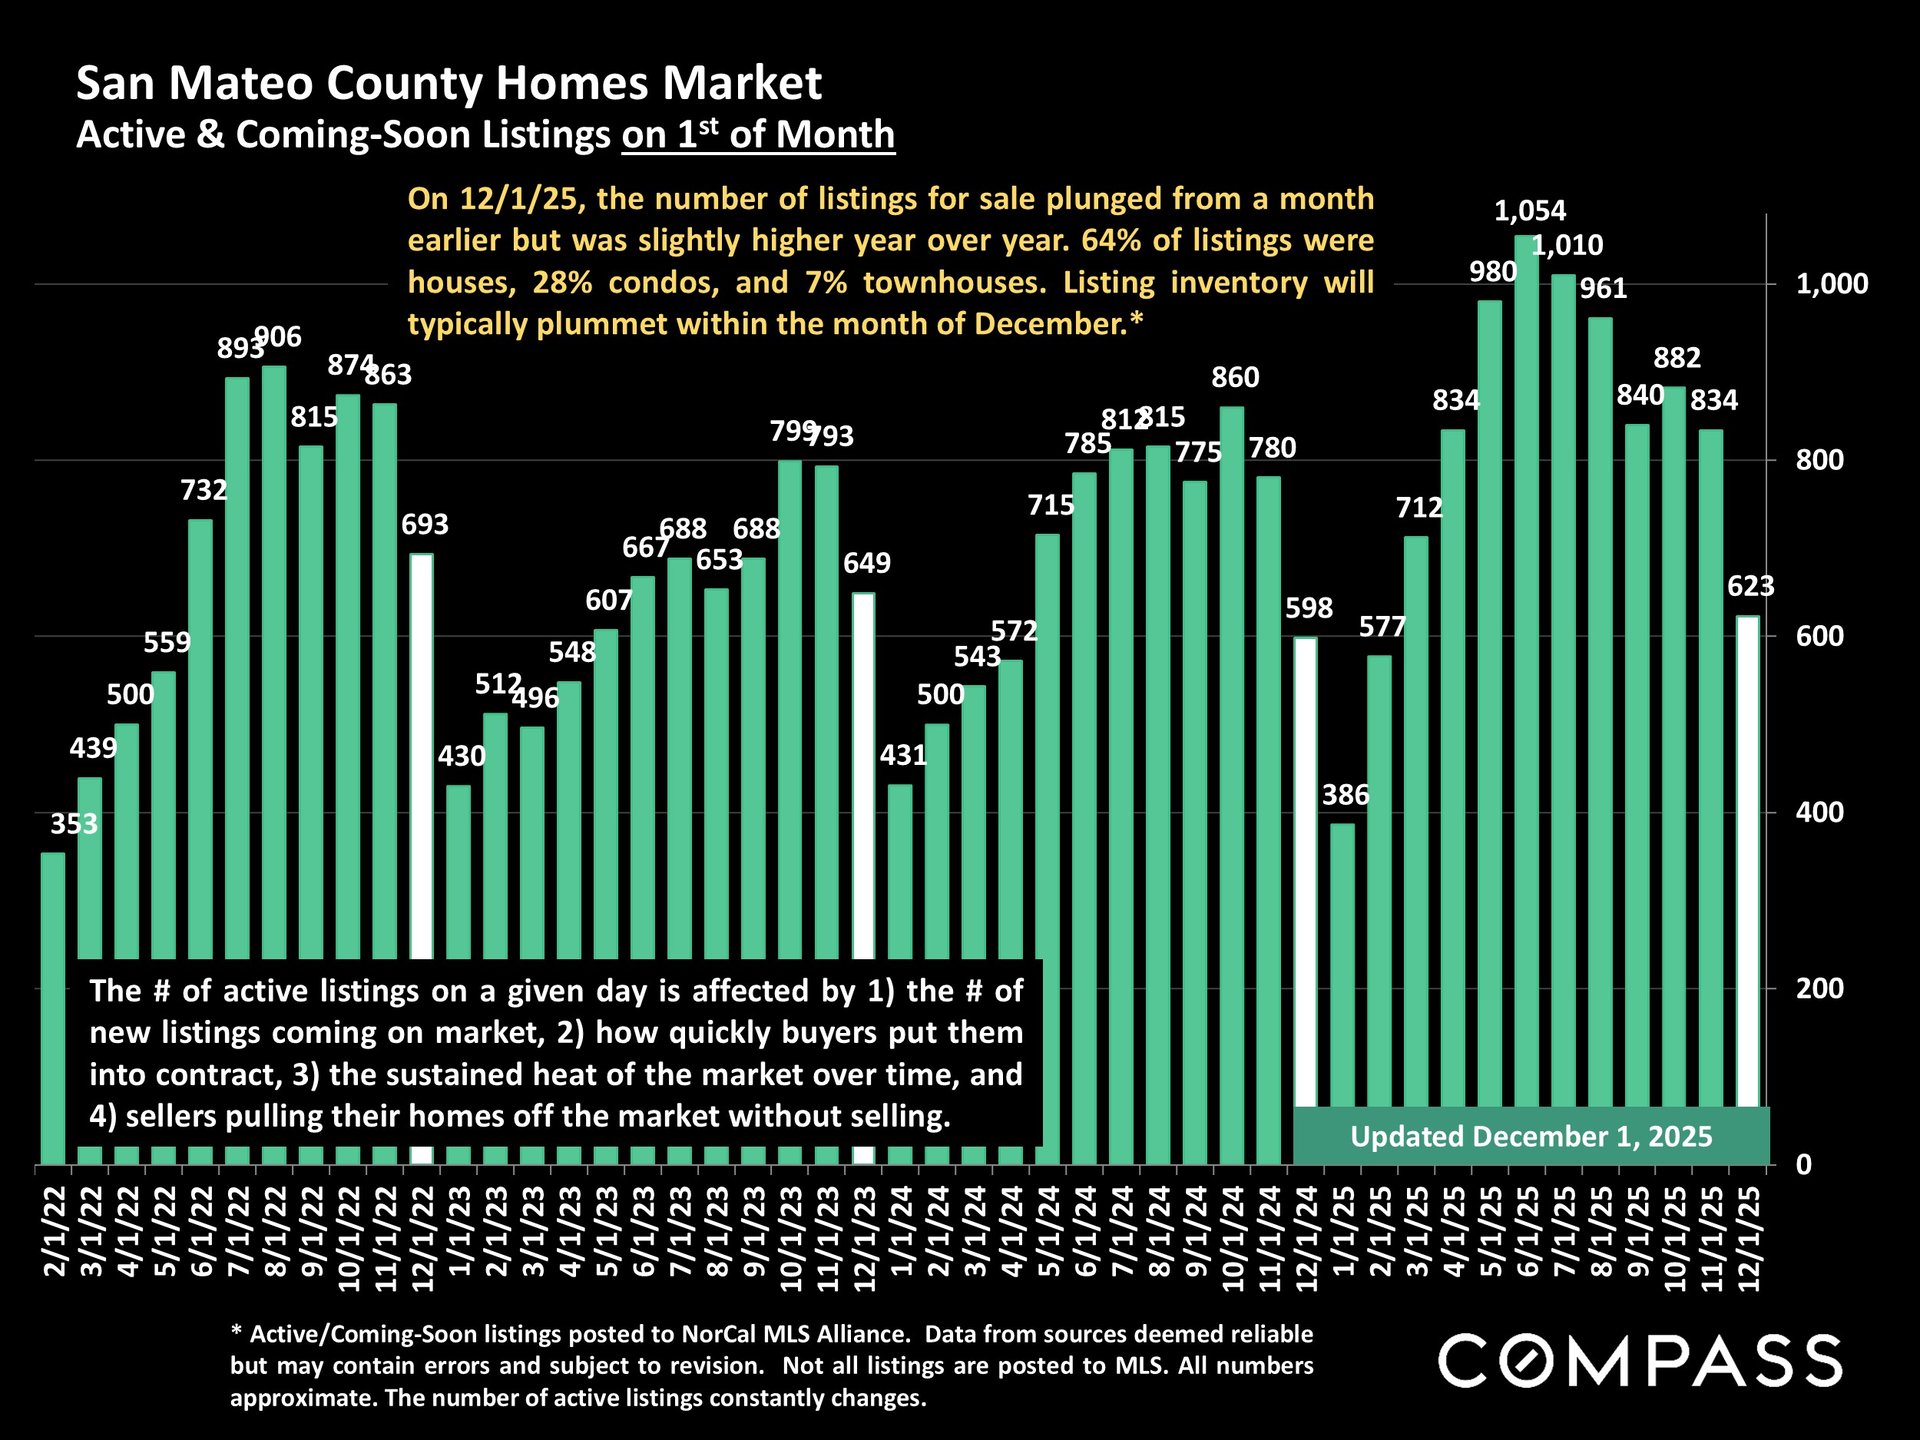
Bar chart of San Mateo County active and coming-soon listings, updated December 1, 2025, with monthly counts from 2022 to 2025.


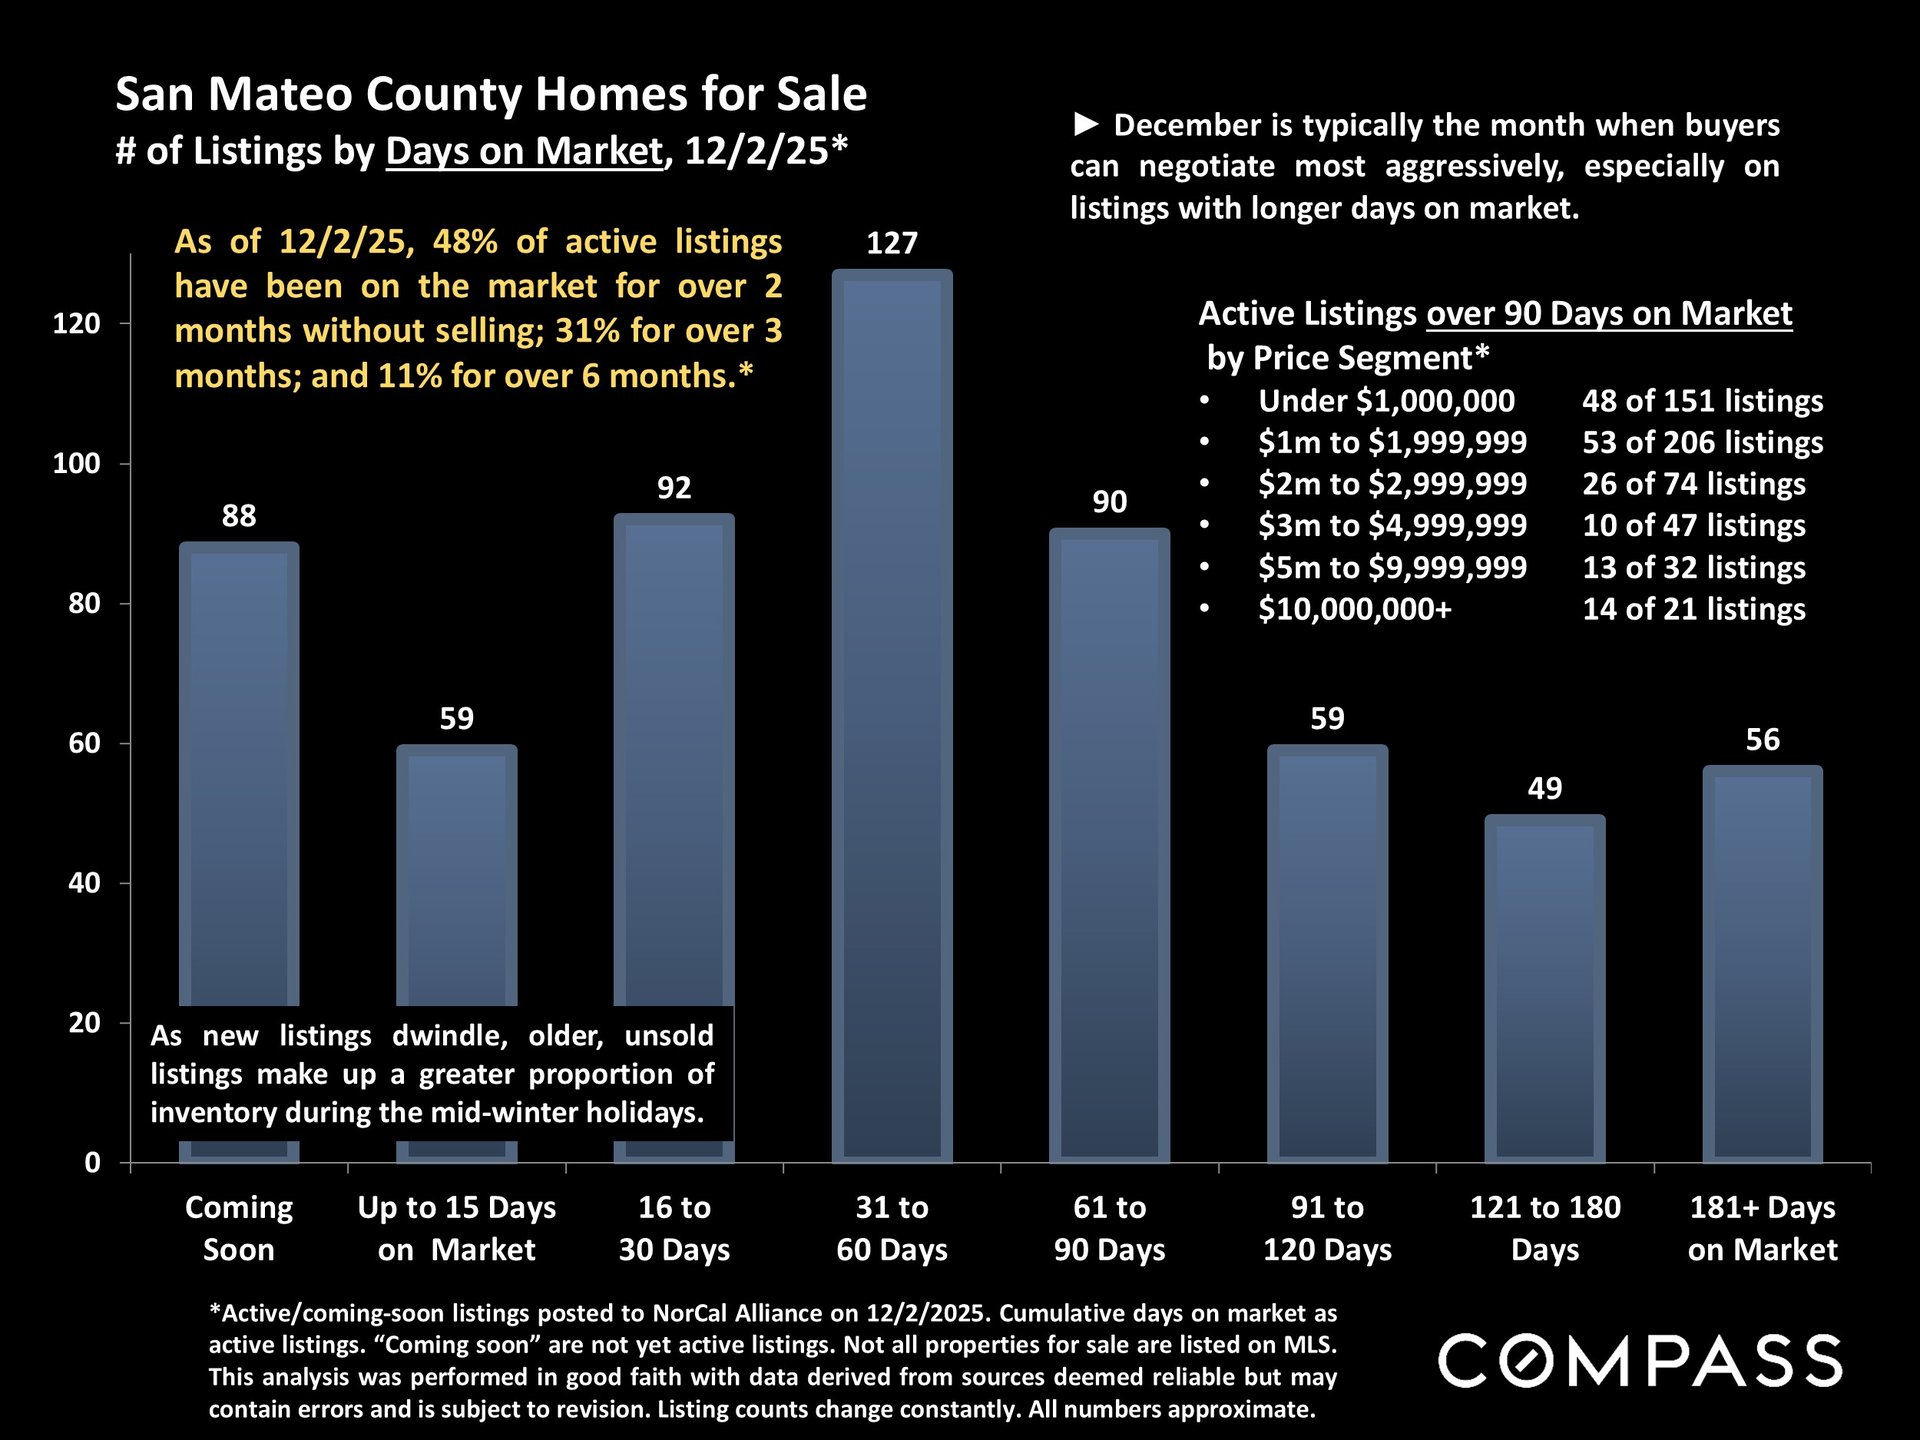
San Mateo County December 2025 market infographic charts home listings by days on market and price segment.


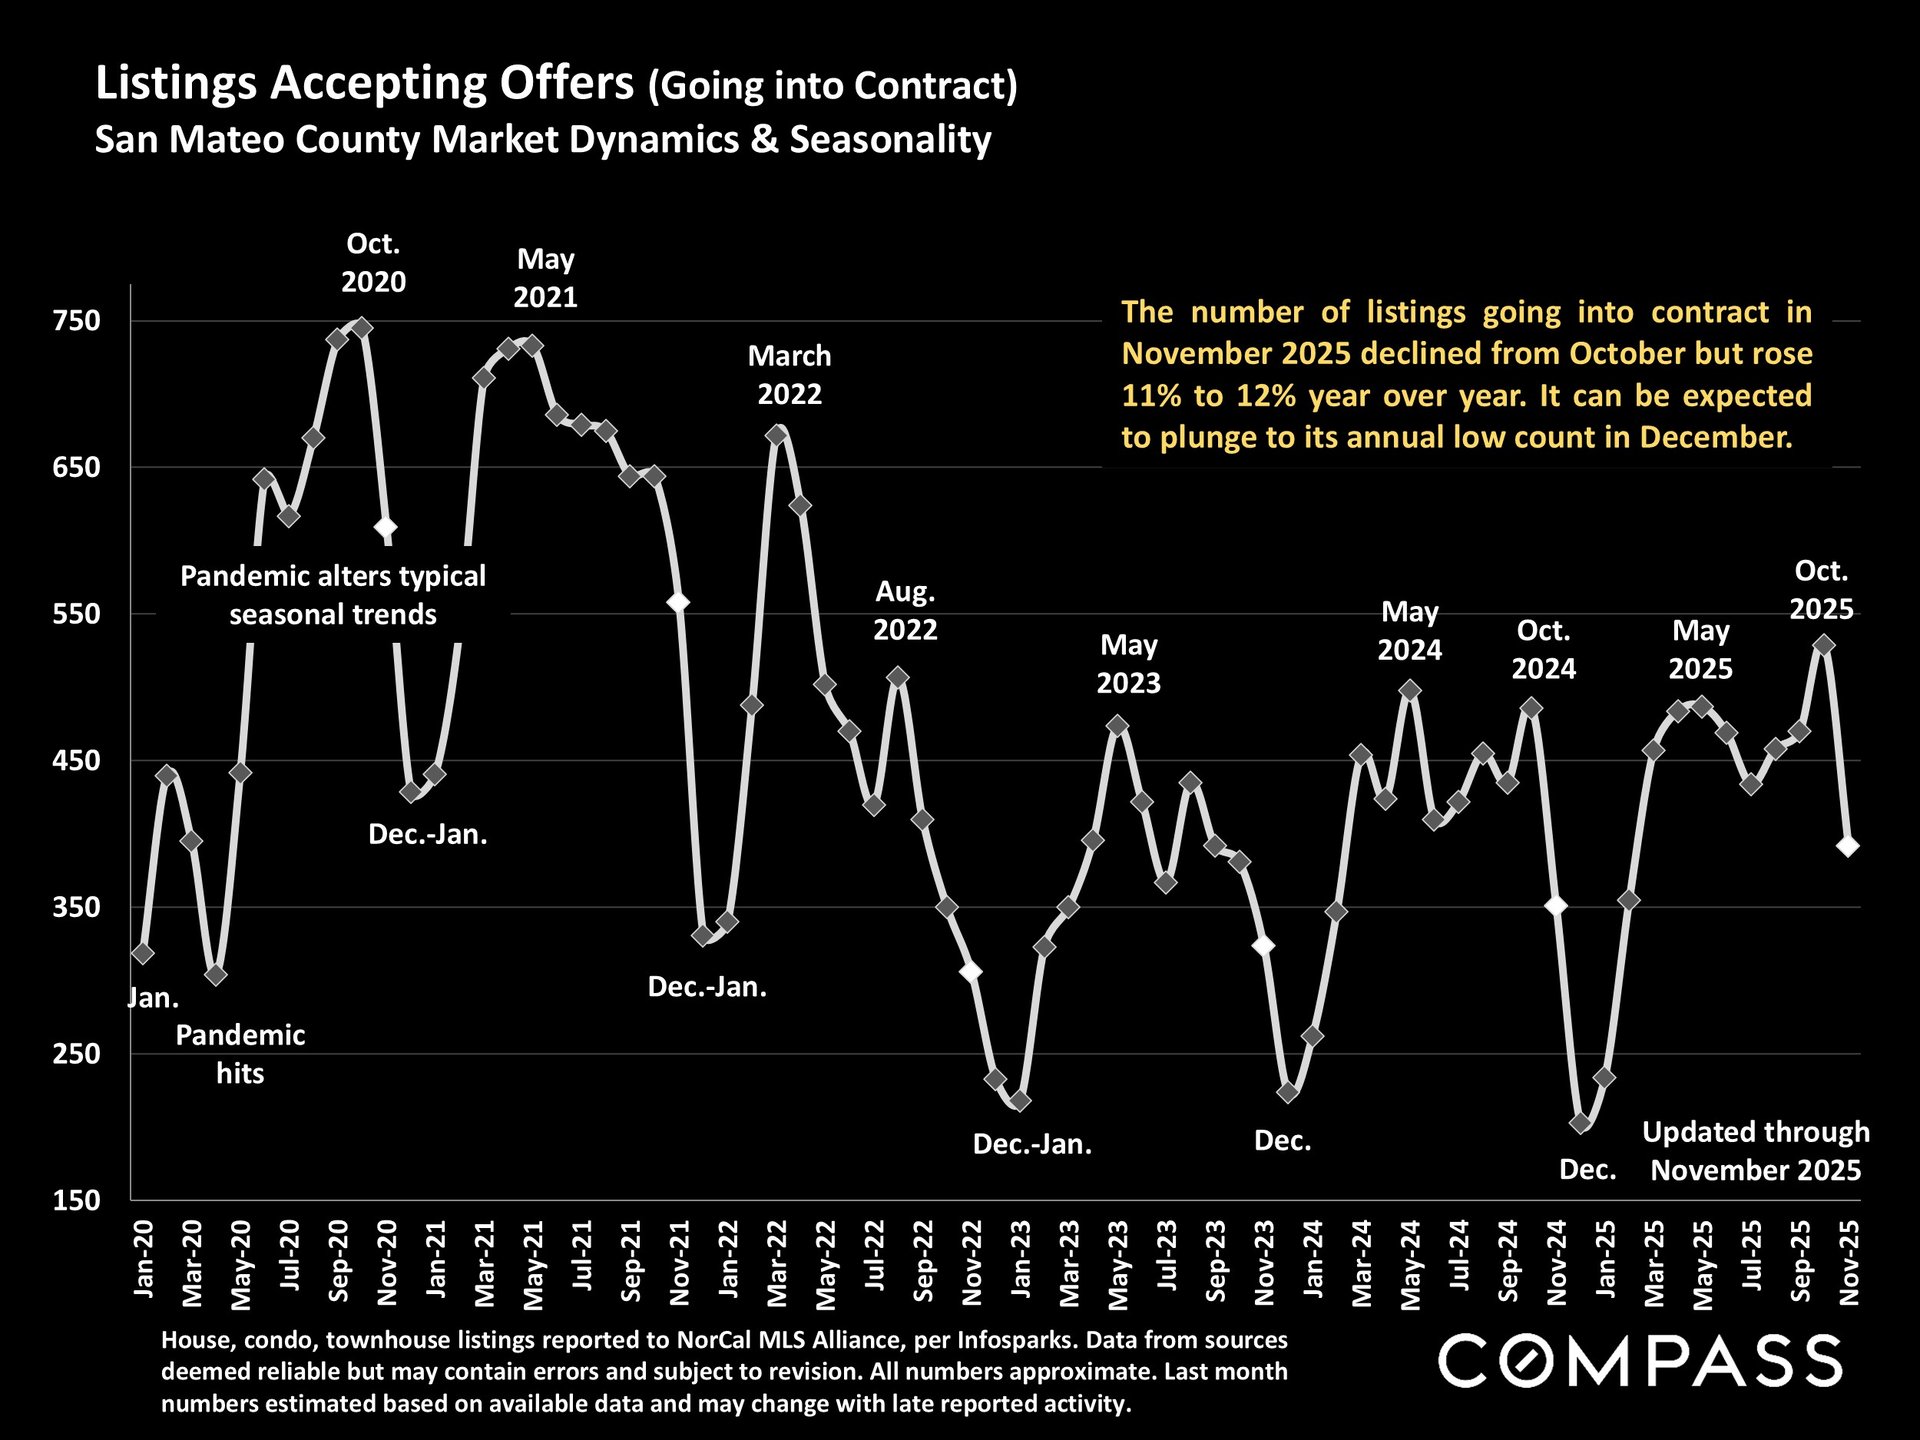
San Mateo County listings chart from 2020 to 2025, with seasonal peaks, winter lows, and a November 2025 update.


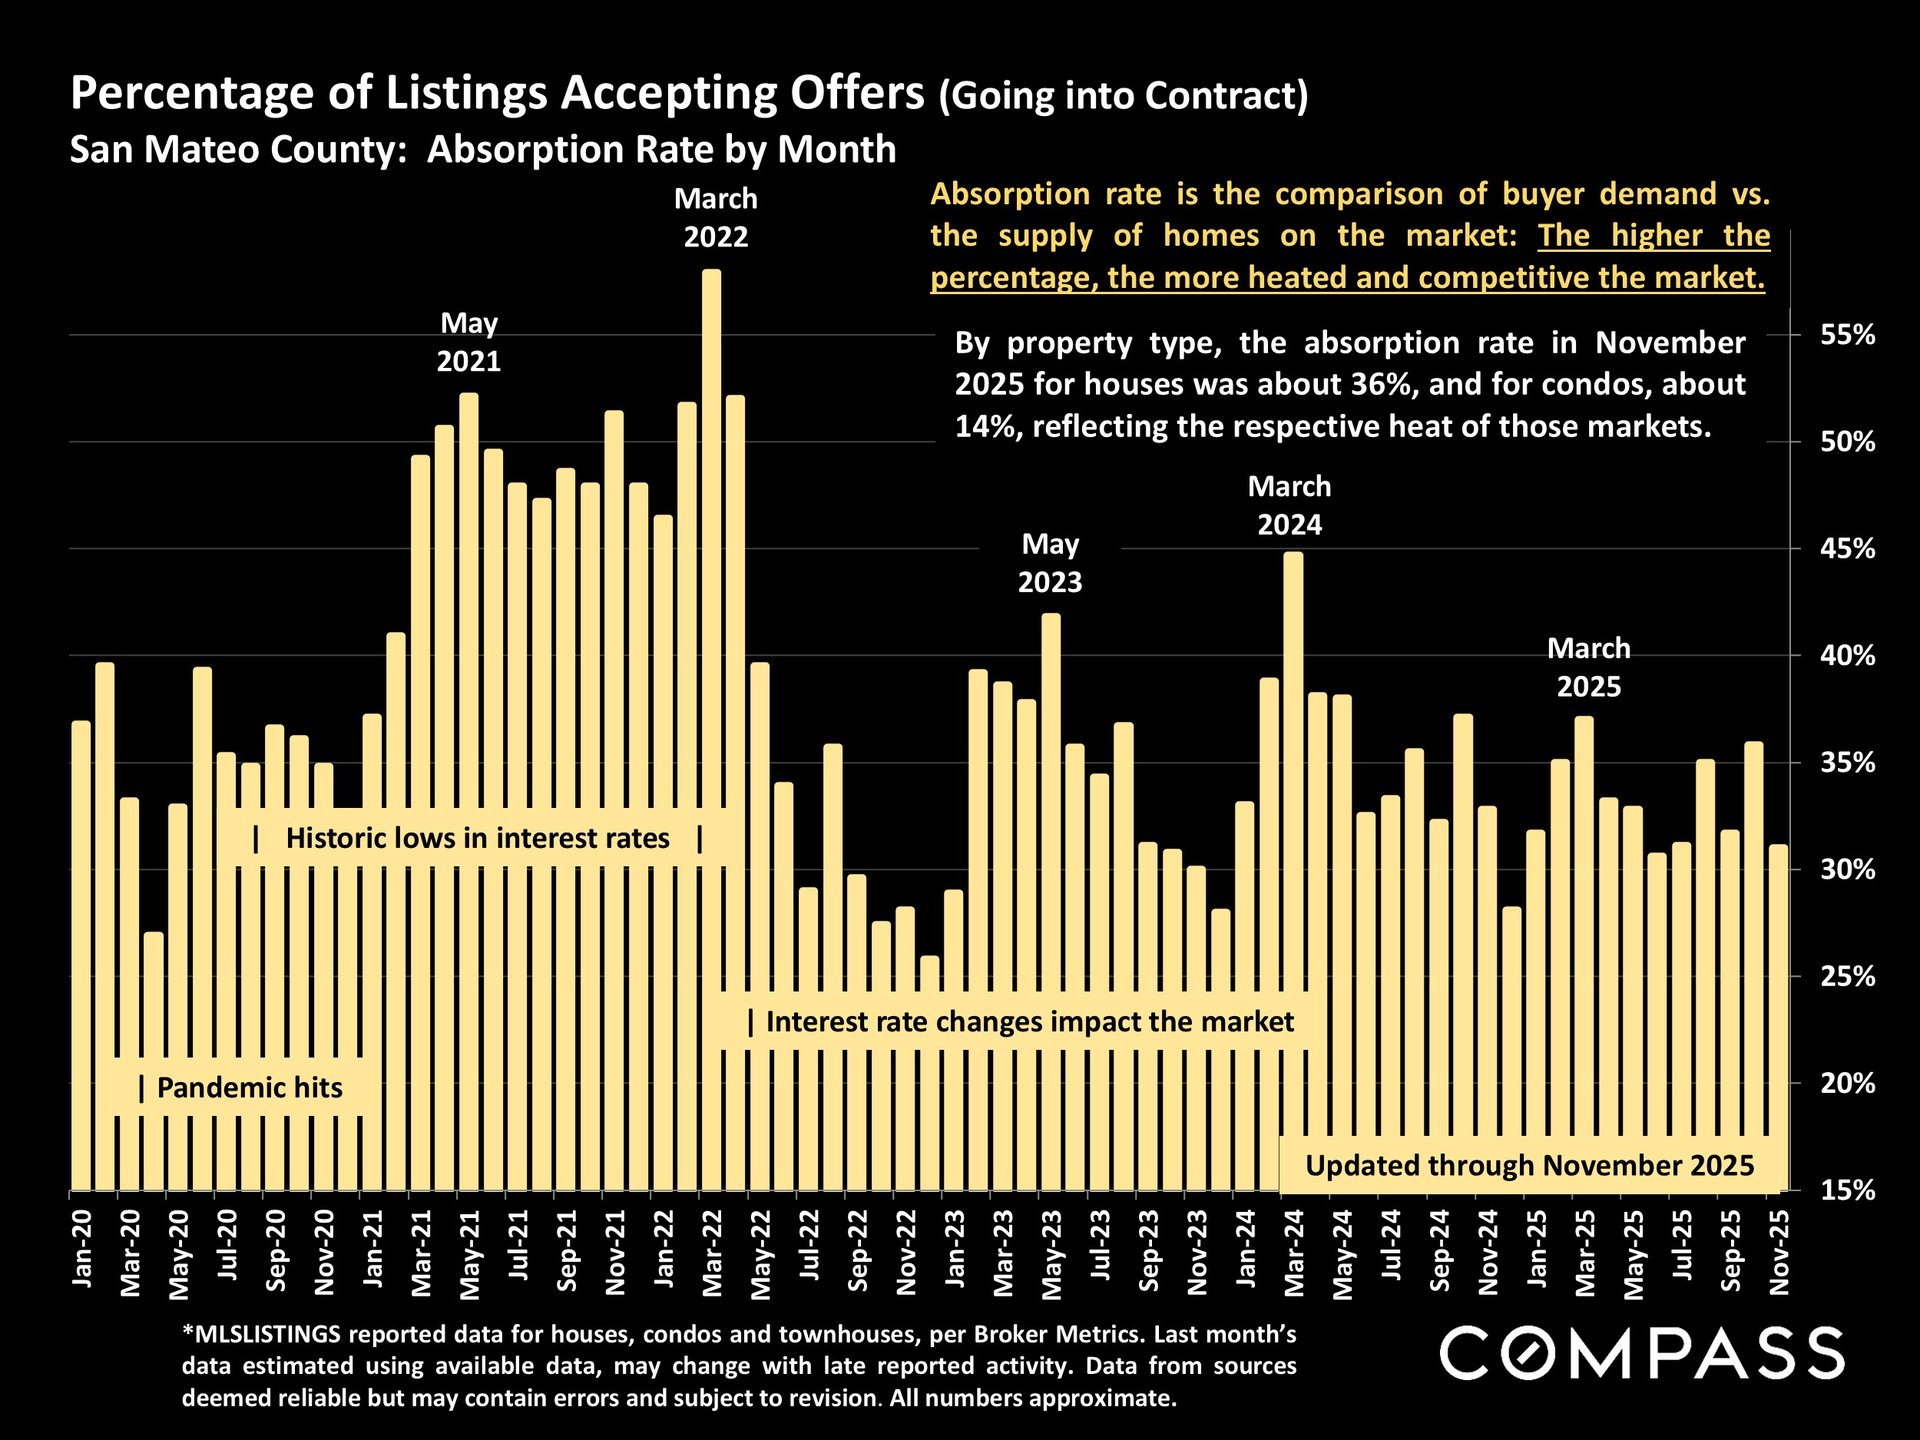
San Mateo County monthly absorption-rate bar chart, January 2020–November 2025, with market annotations.


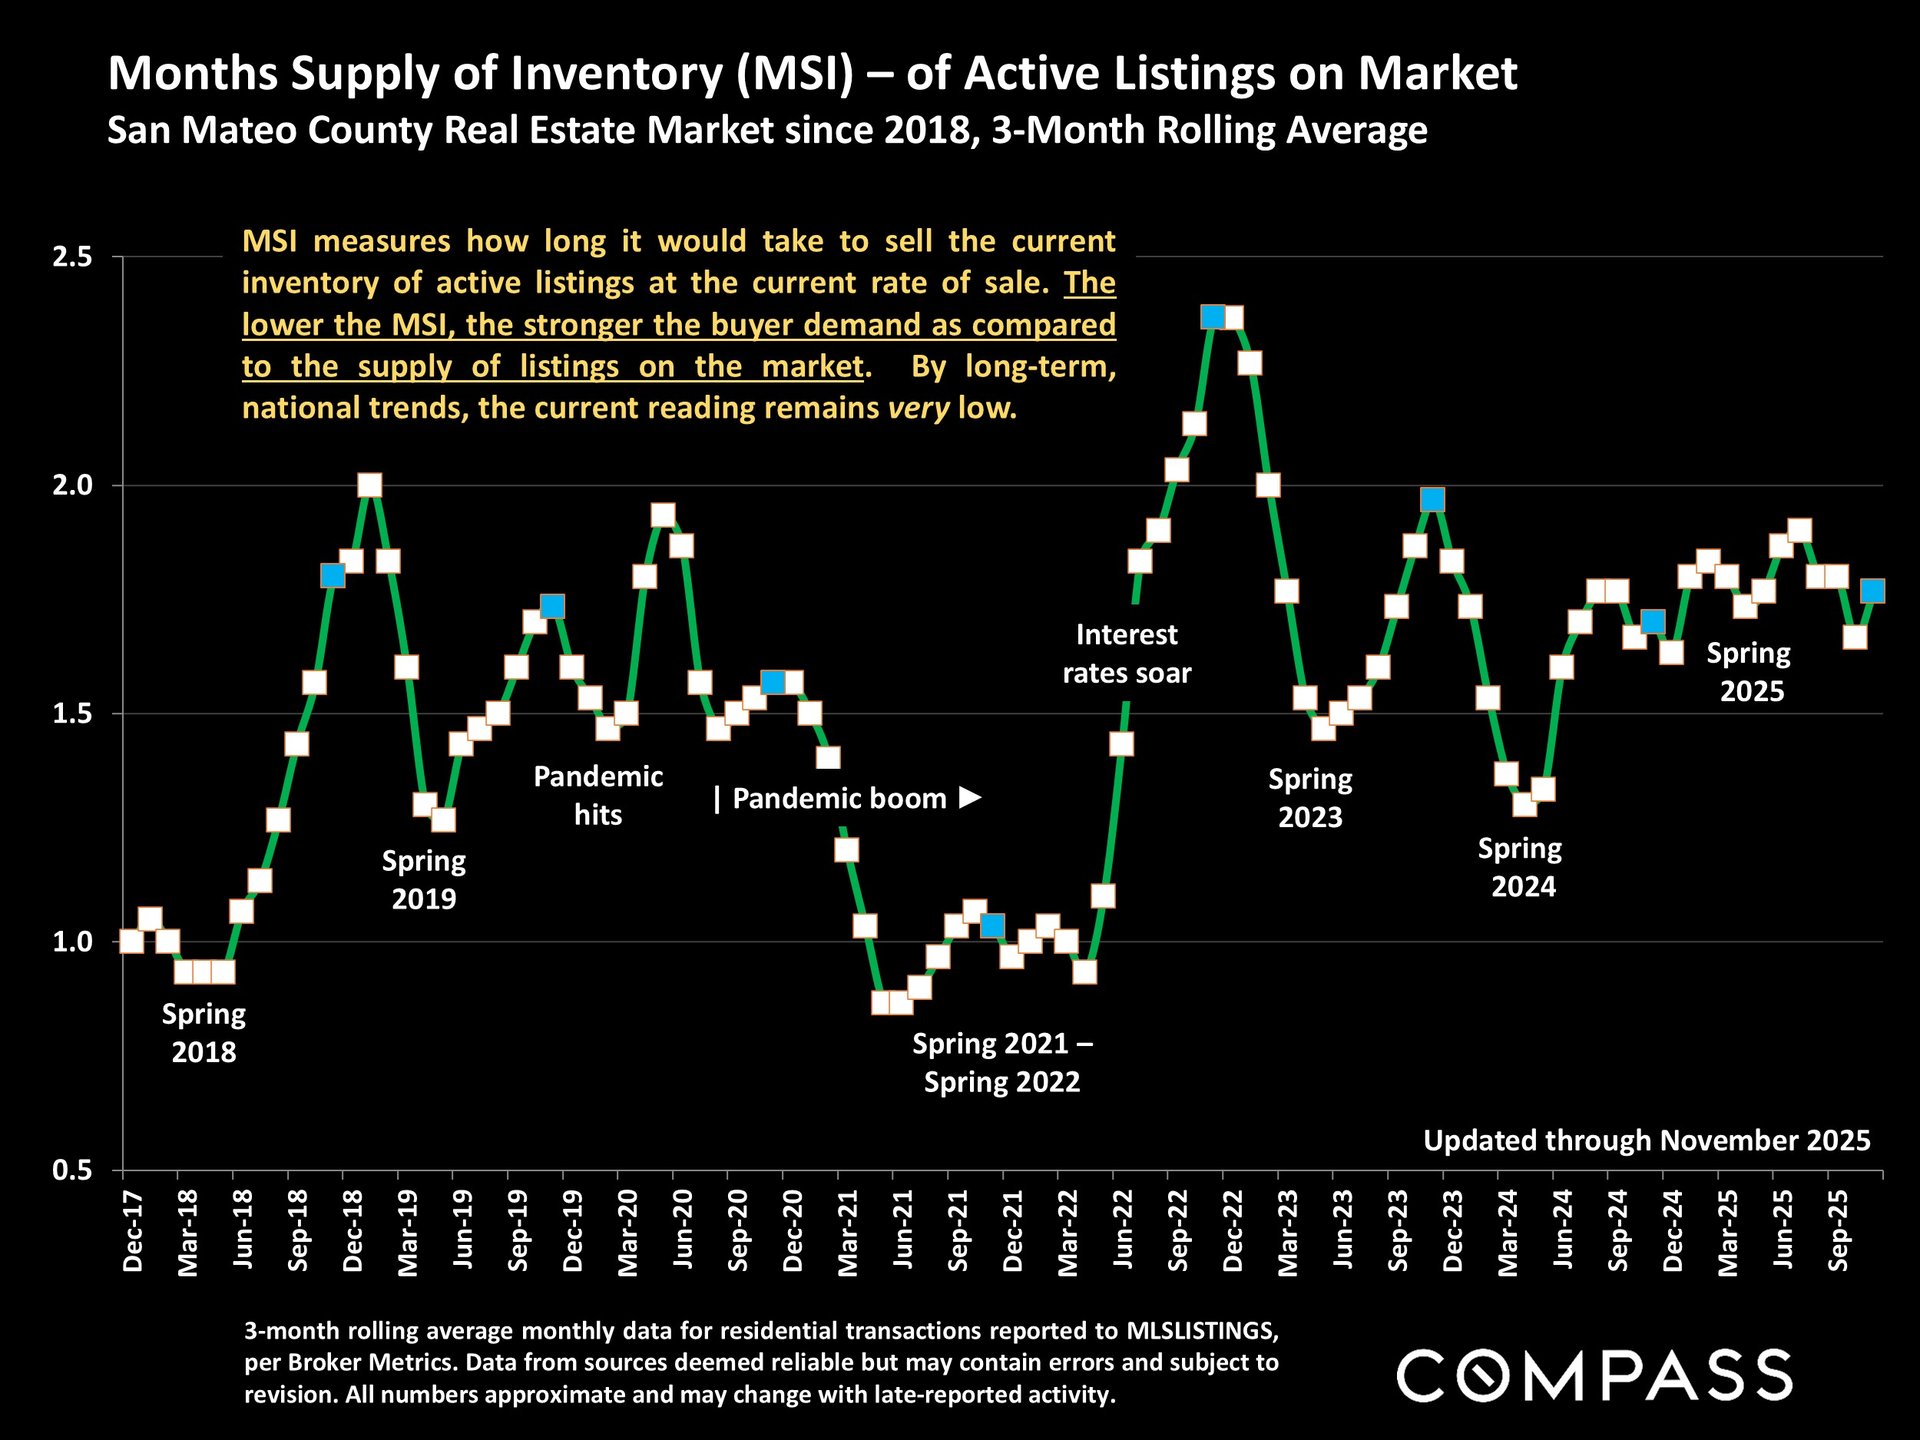
Chart of San Mateo County months of inventory, showing a low reading through November 2025.


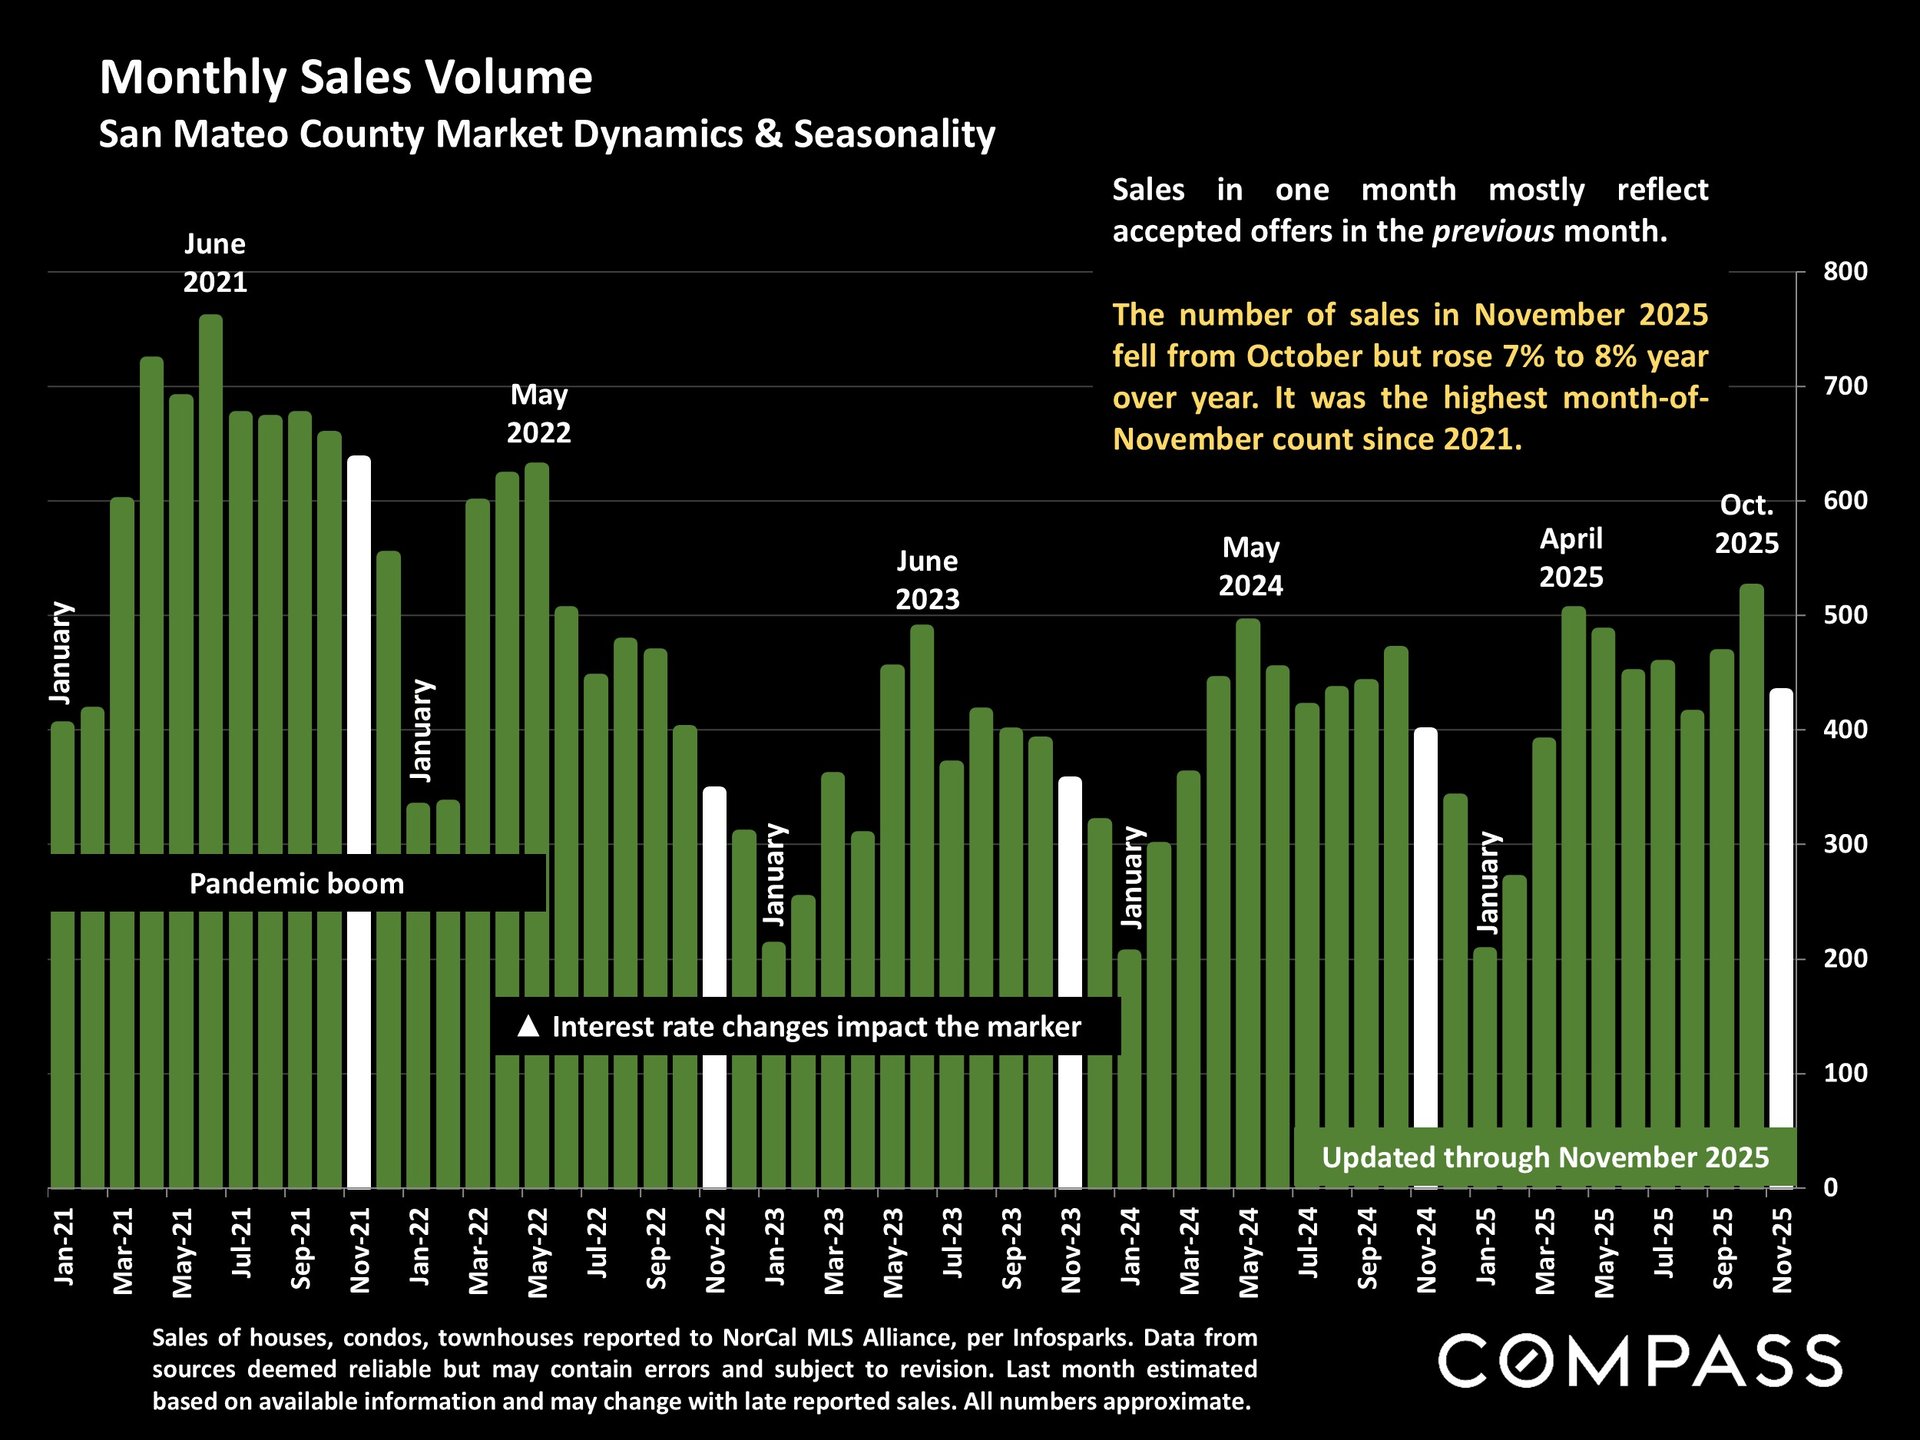
San Mateo County monthly home sales chart, January 2021–November 2025, with November 2025 market commentary.


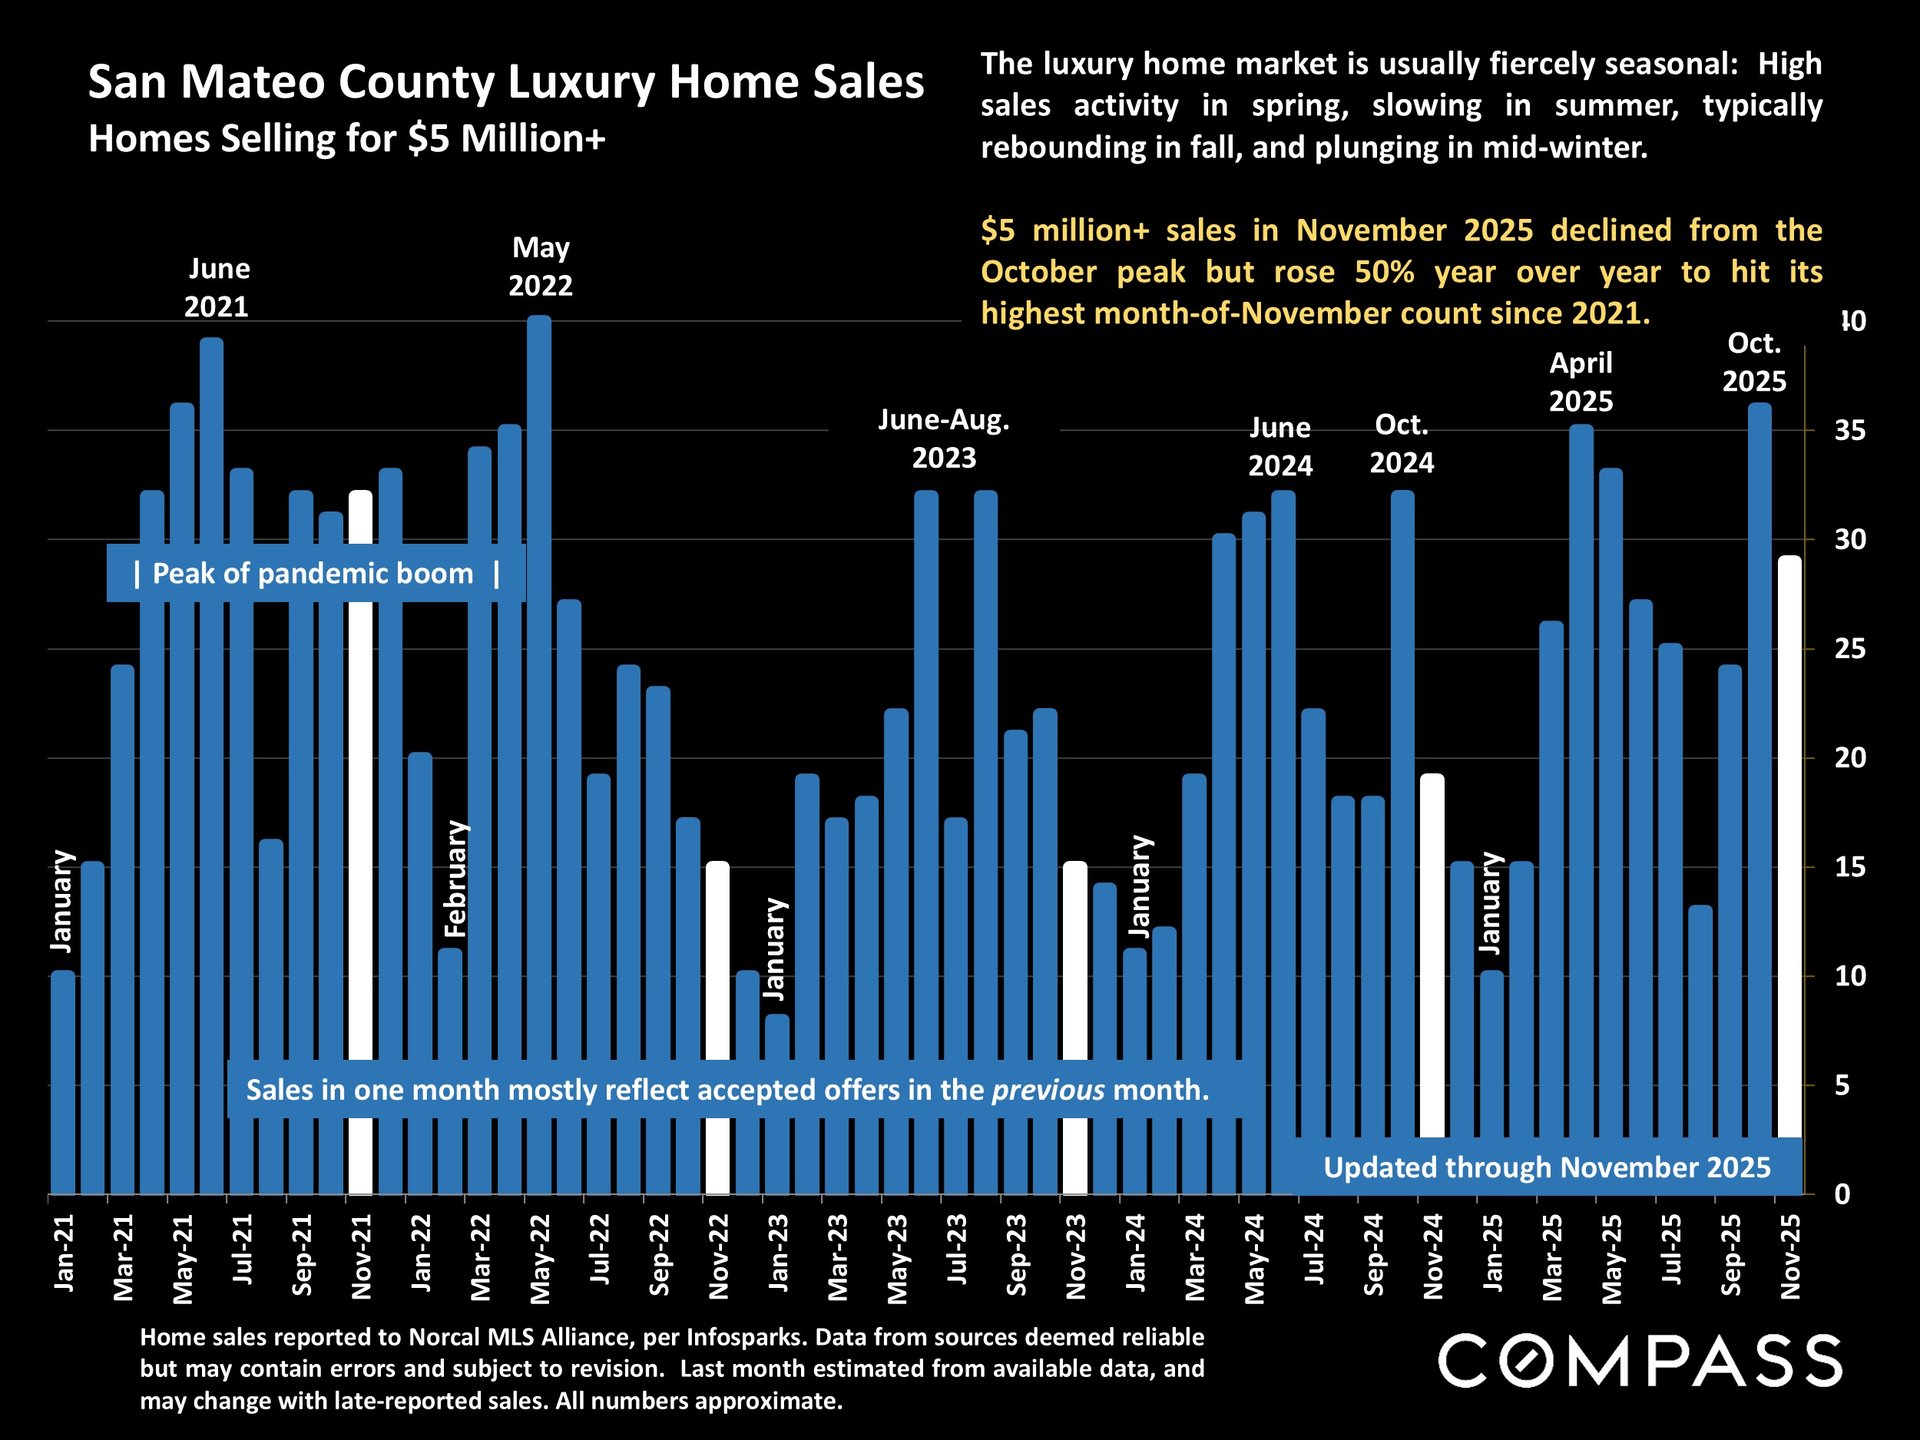
Bar chart of San Mateo County home sales over $5 million, January 2021–November 2025, highlighting seasonal trends.


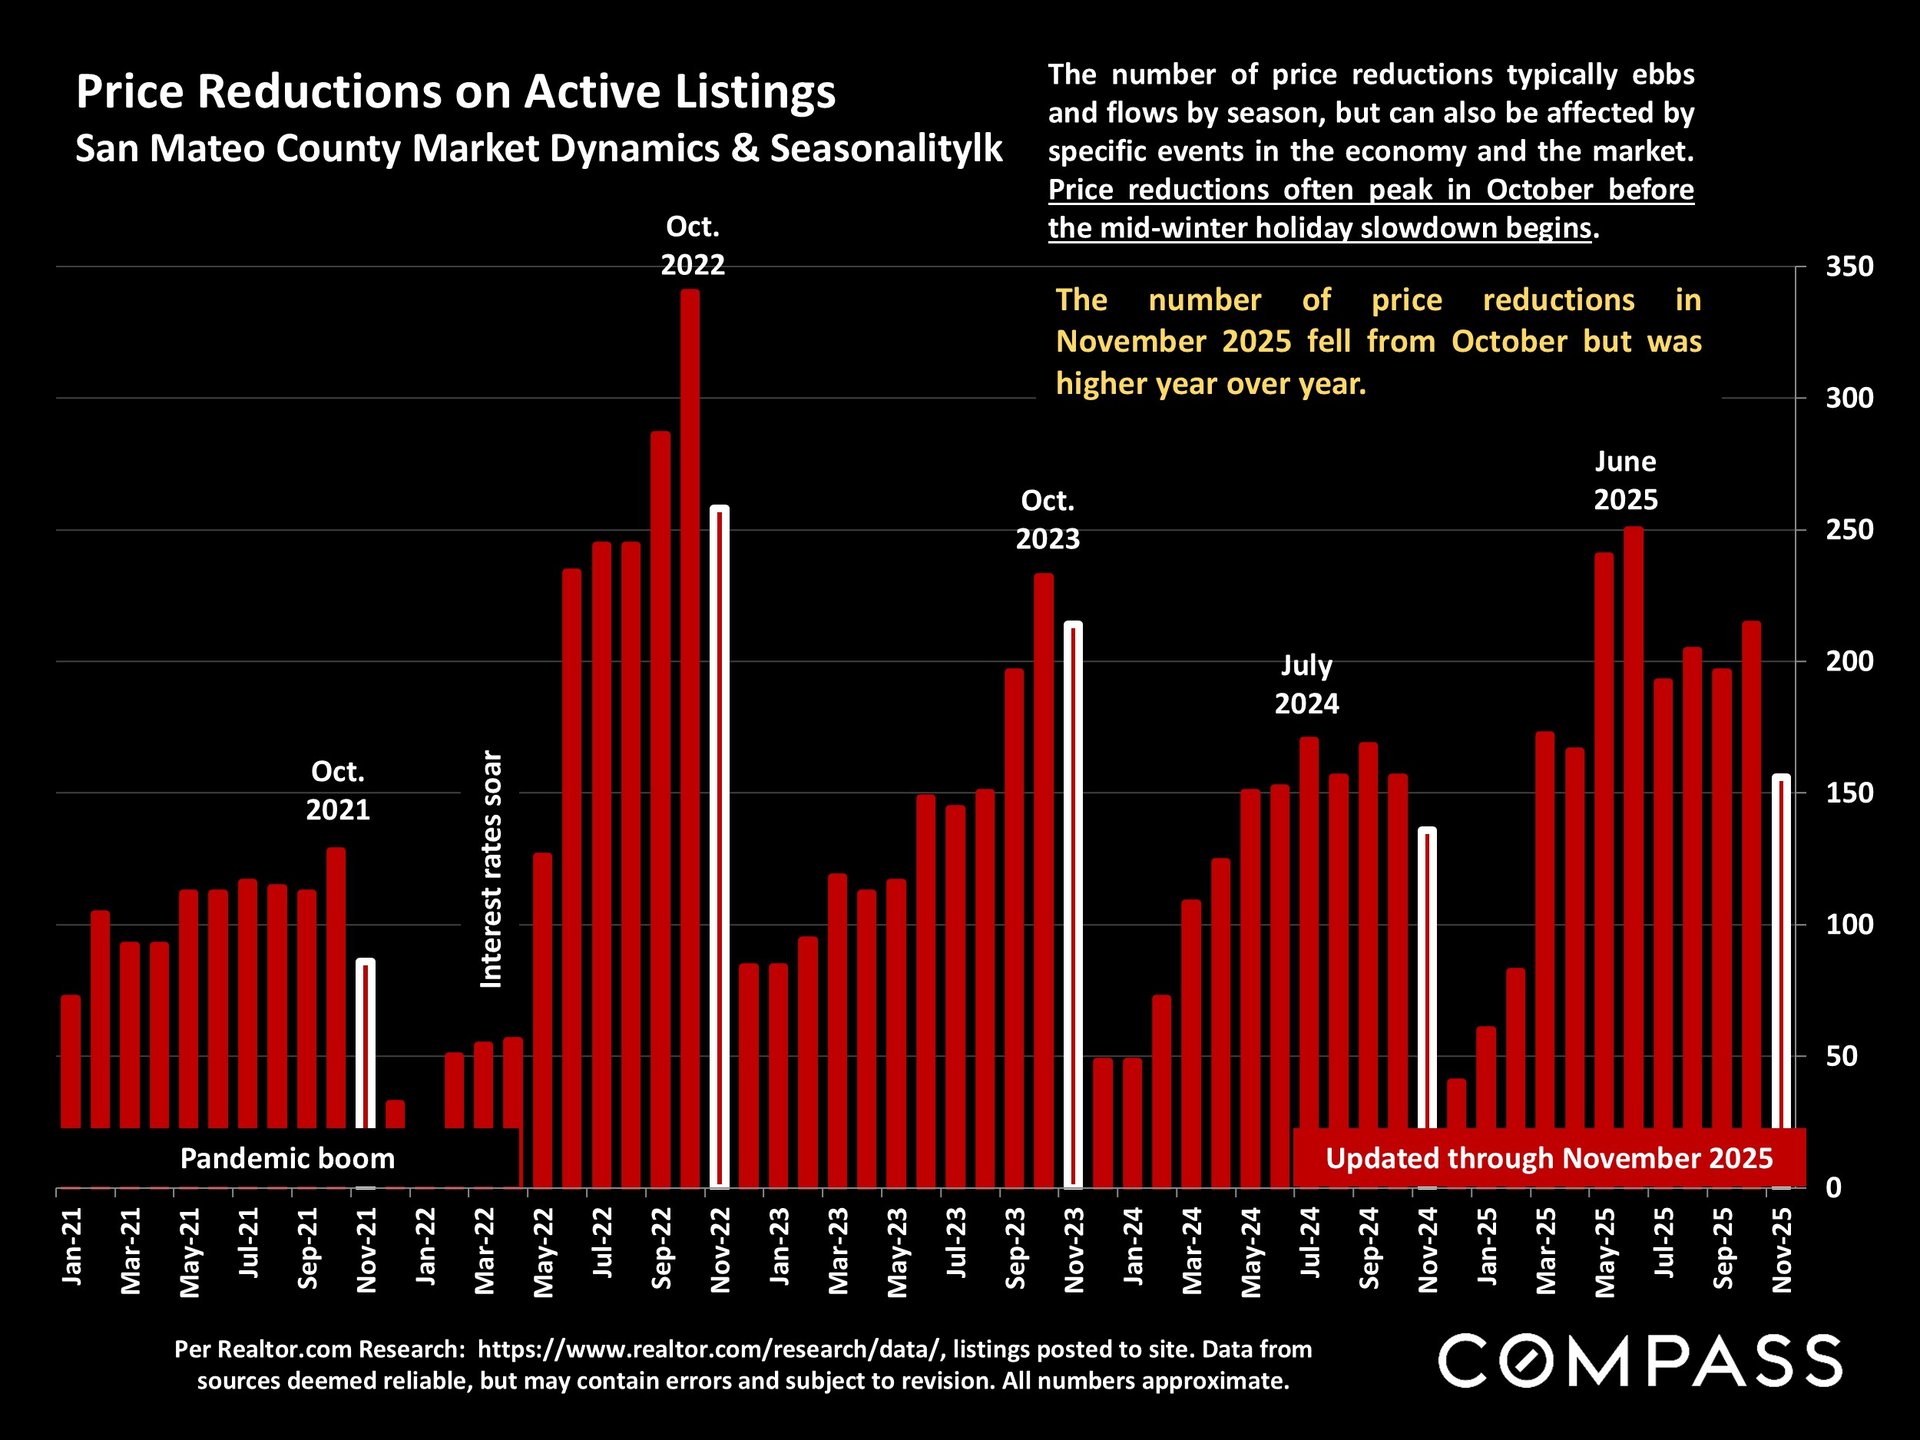
Chart of monthly San Mateo County active-listing price reductions, January 2021–November 2025, with seasonal callouts.


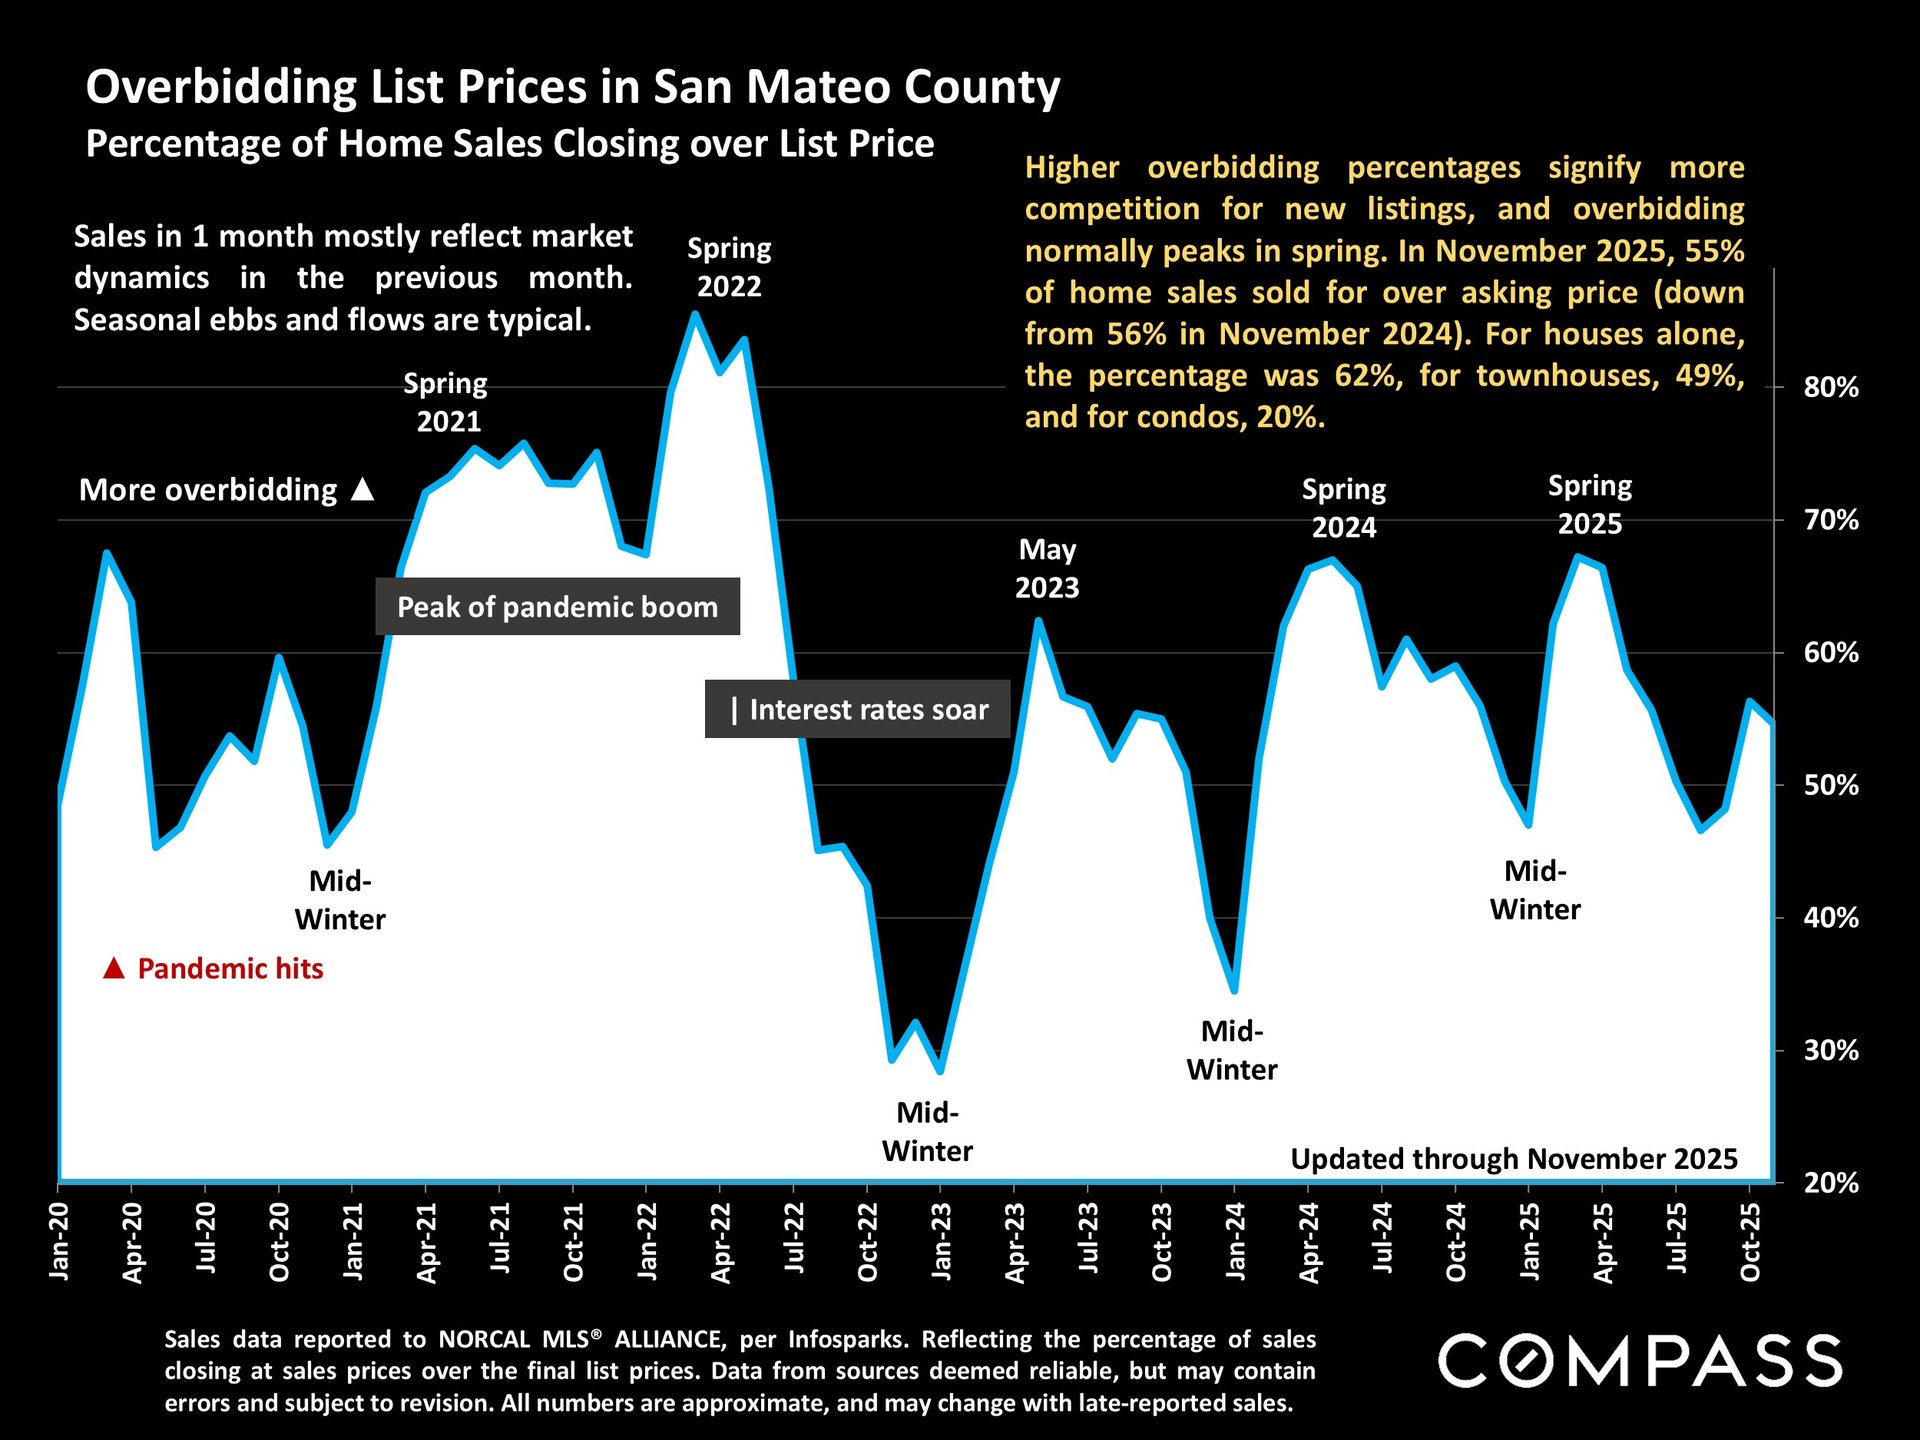
San Mateo County chart of home sales over list price, showing monthly trends from 2020 through November 2025.


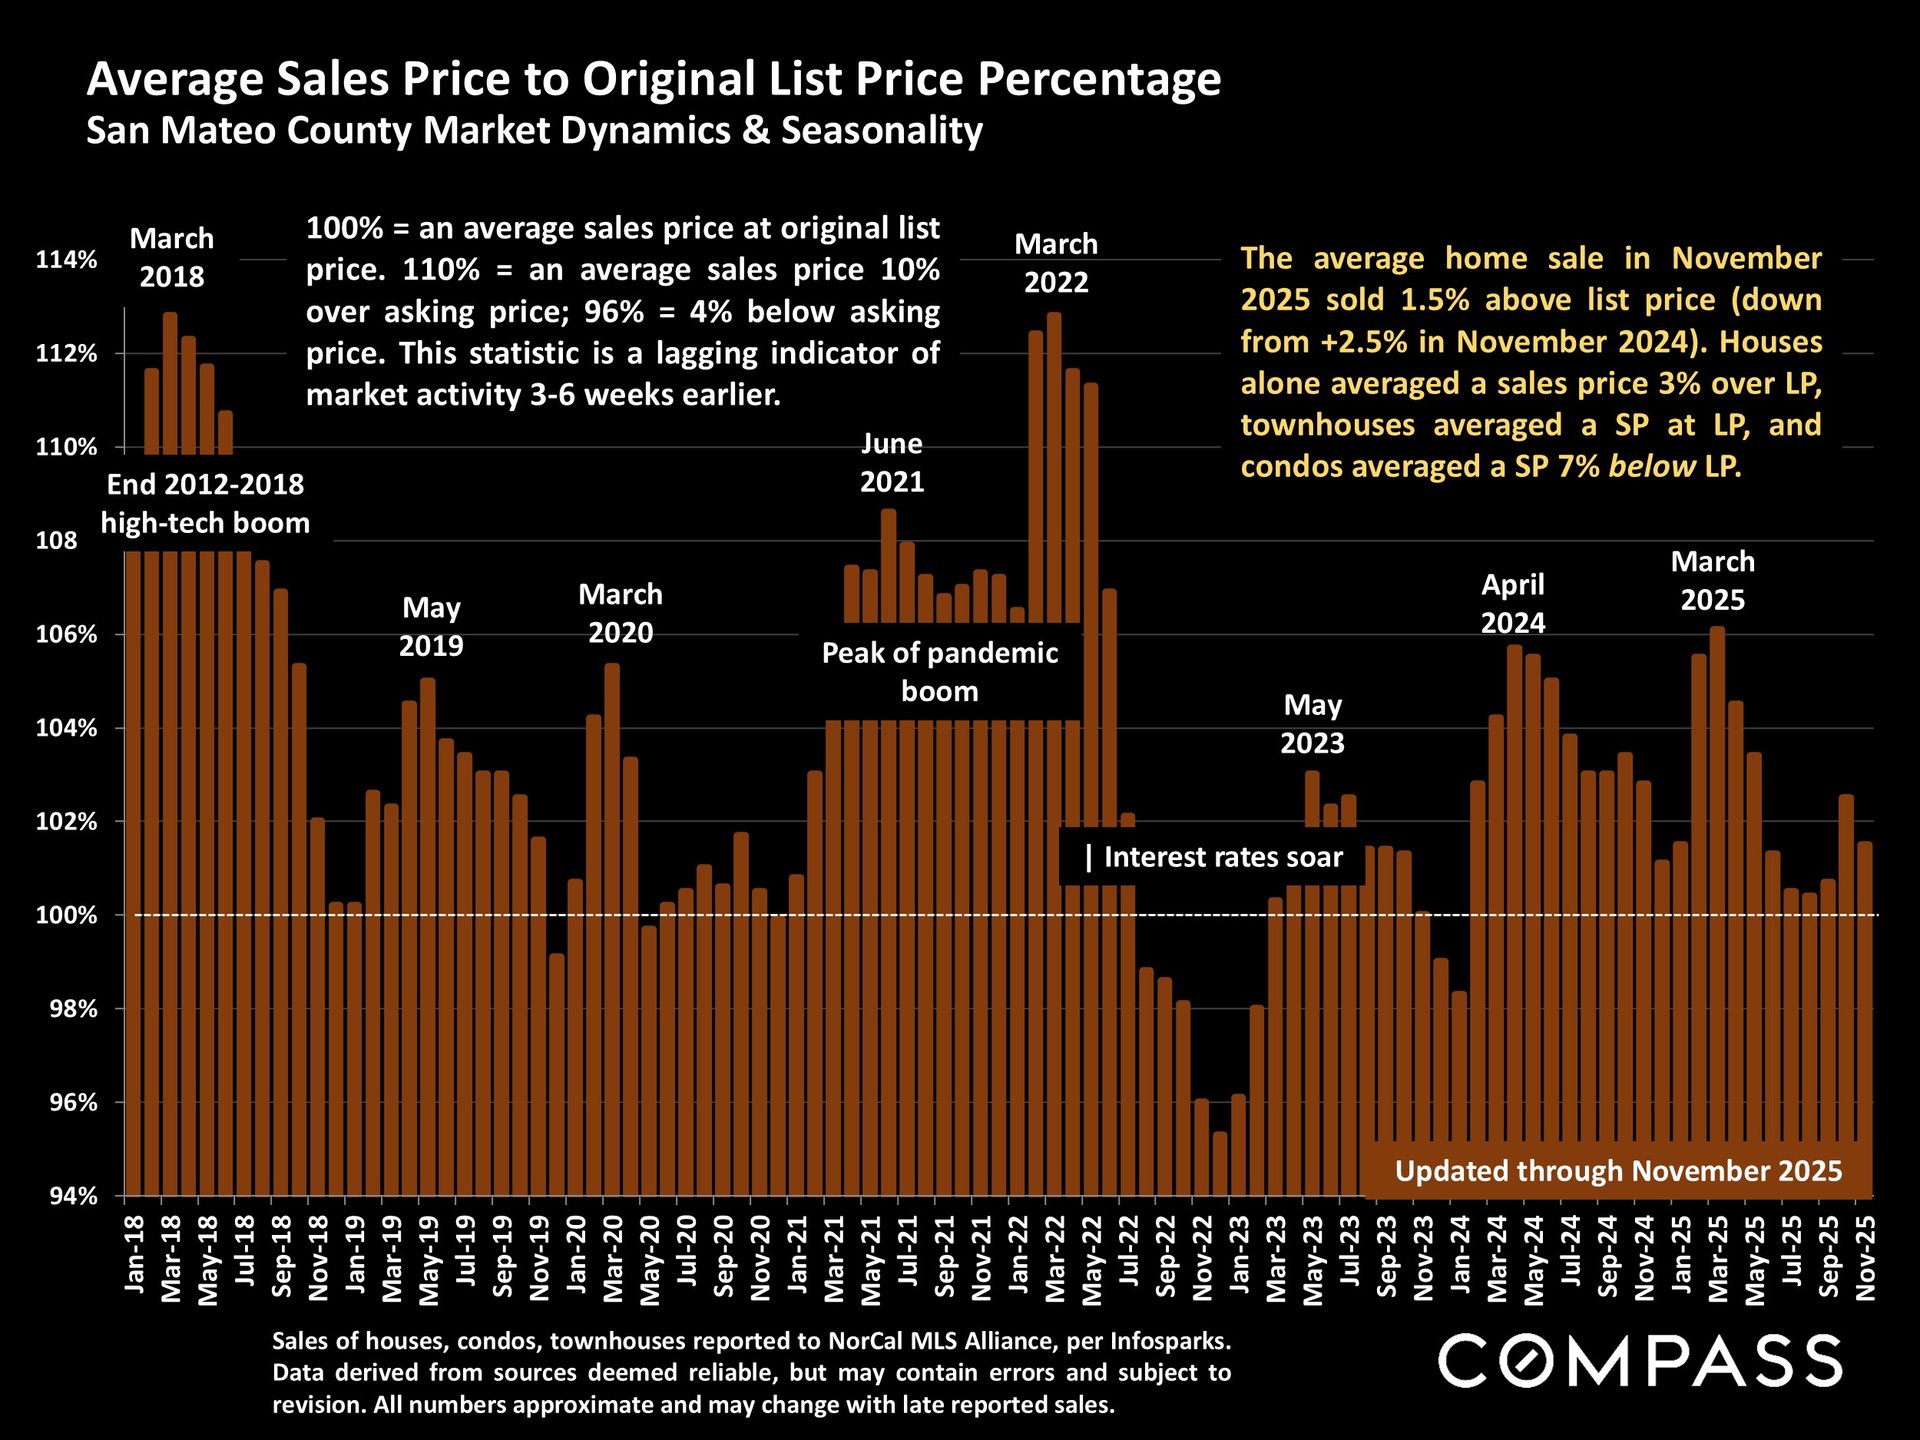
Chart of San Mateo County home sale prices versus original list prices, January 2018 to November 2025.


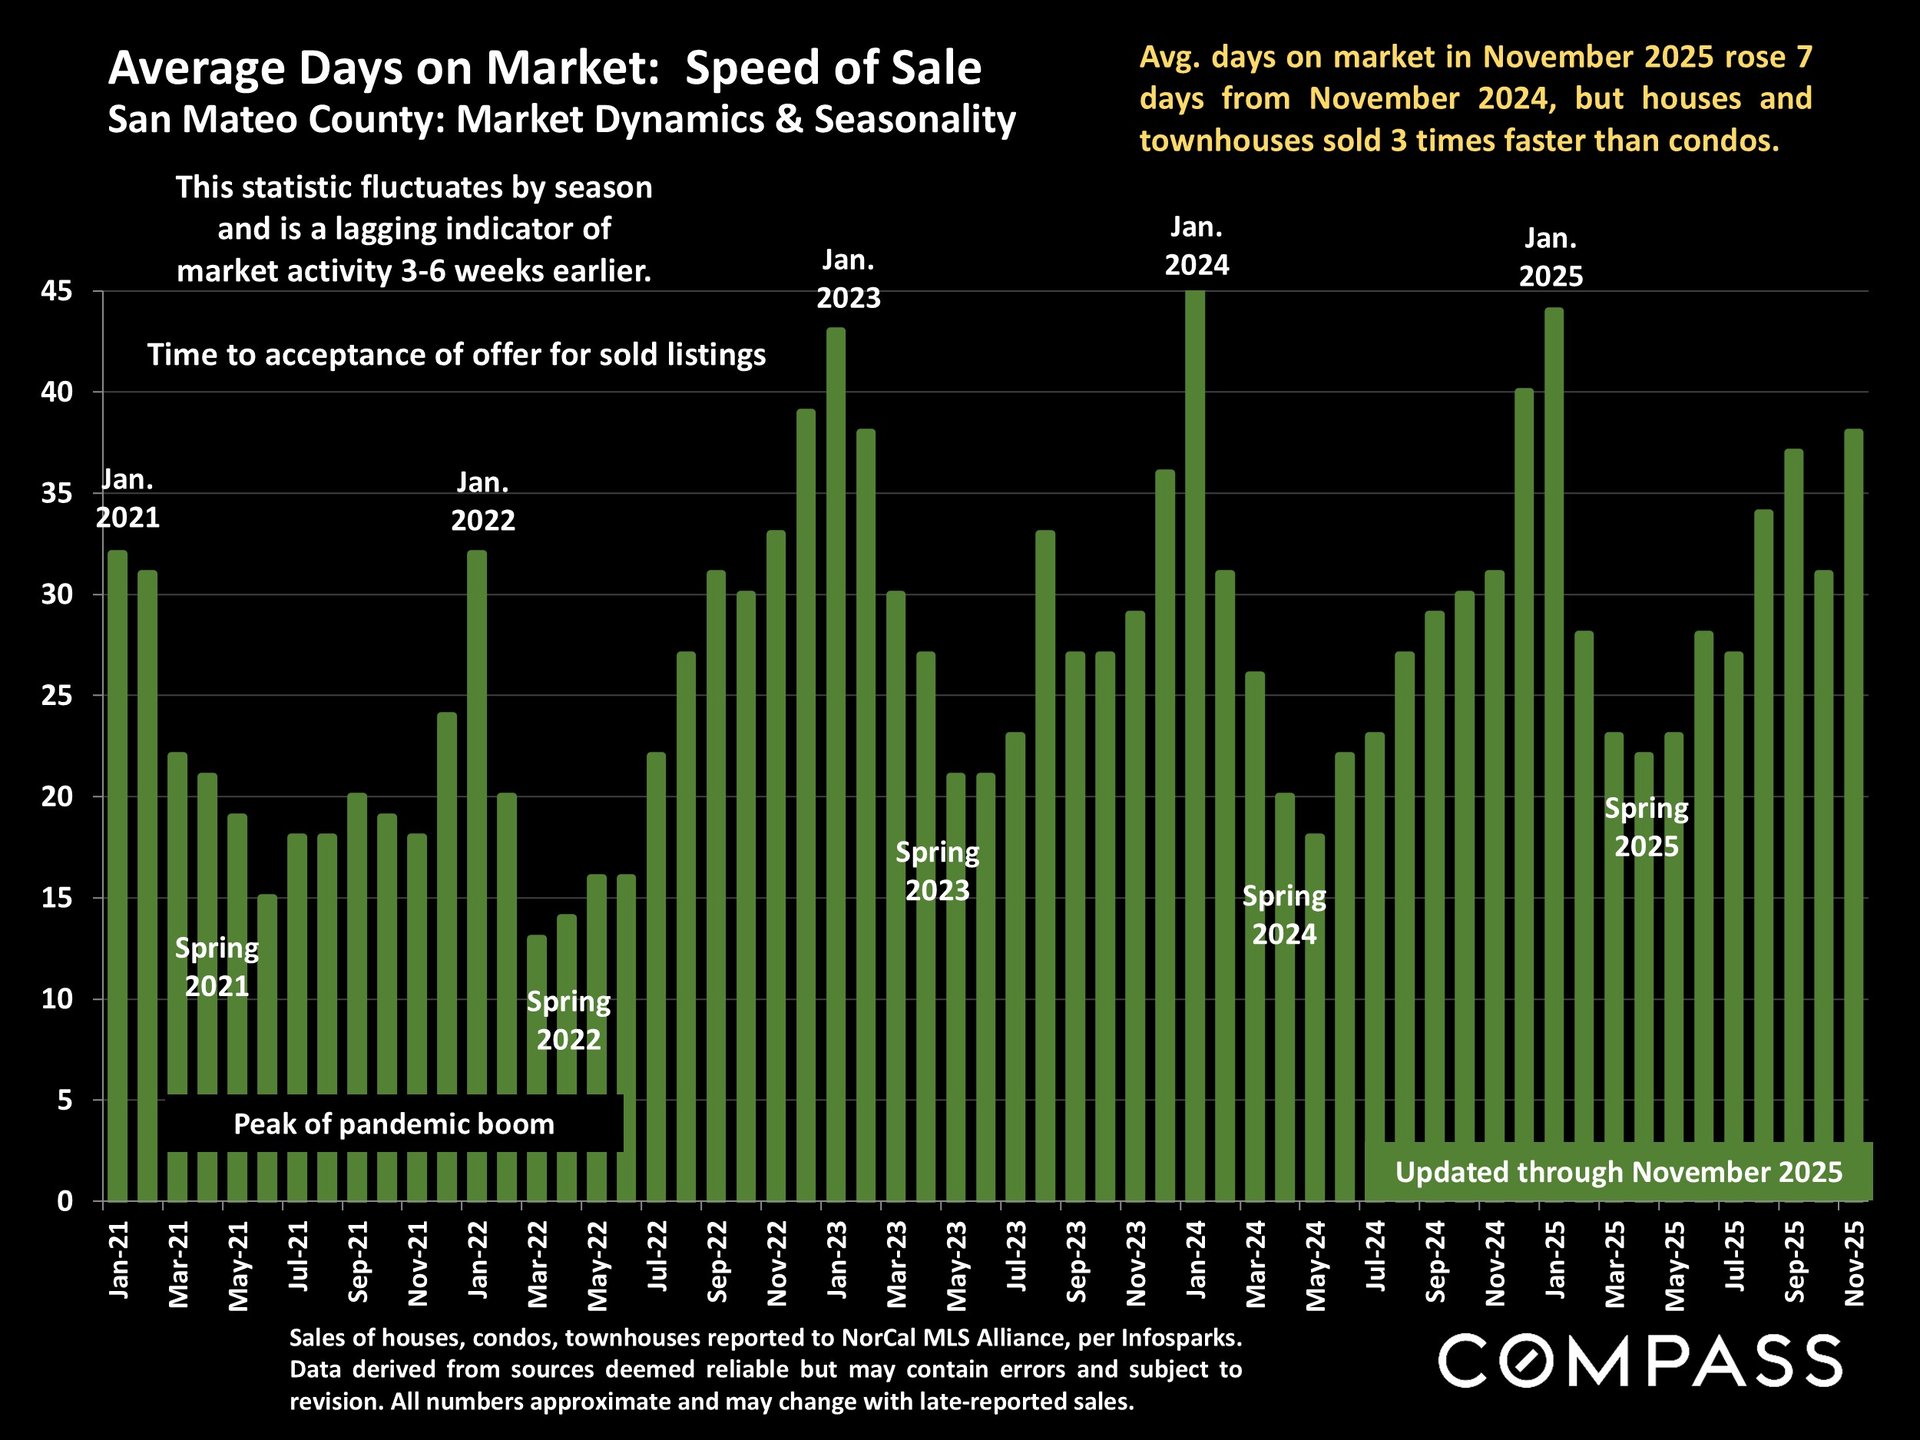
San Mateo County average days on market chart, with monthly green bars from January 2021 through November 2025.


Graphic linking to the 2025 Profile of Home Buyers and Sellers, with a dotted U.S. map and Compass wordmark.


Selected Economic Indicators


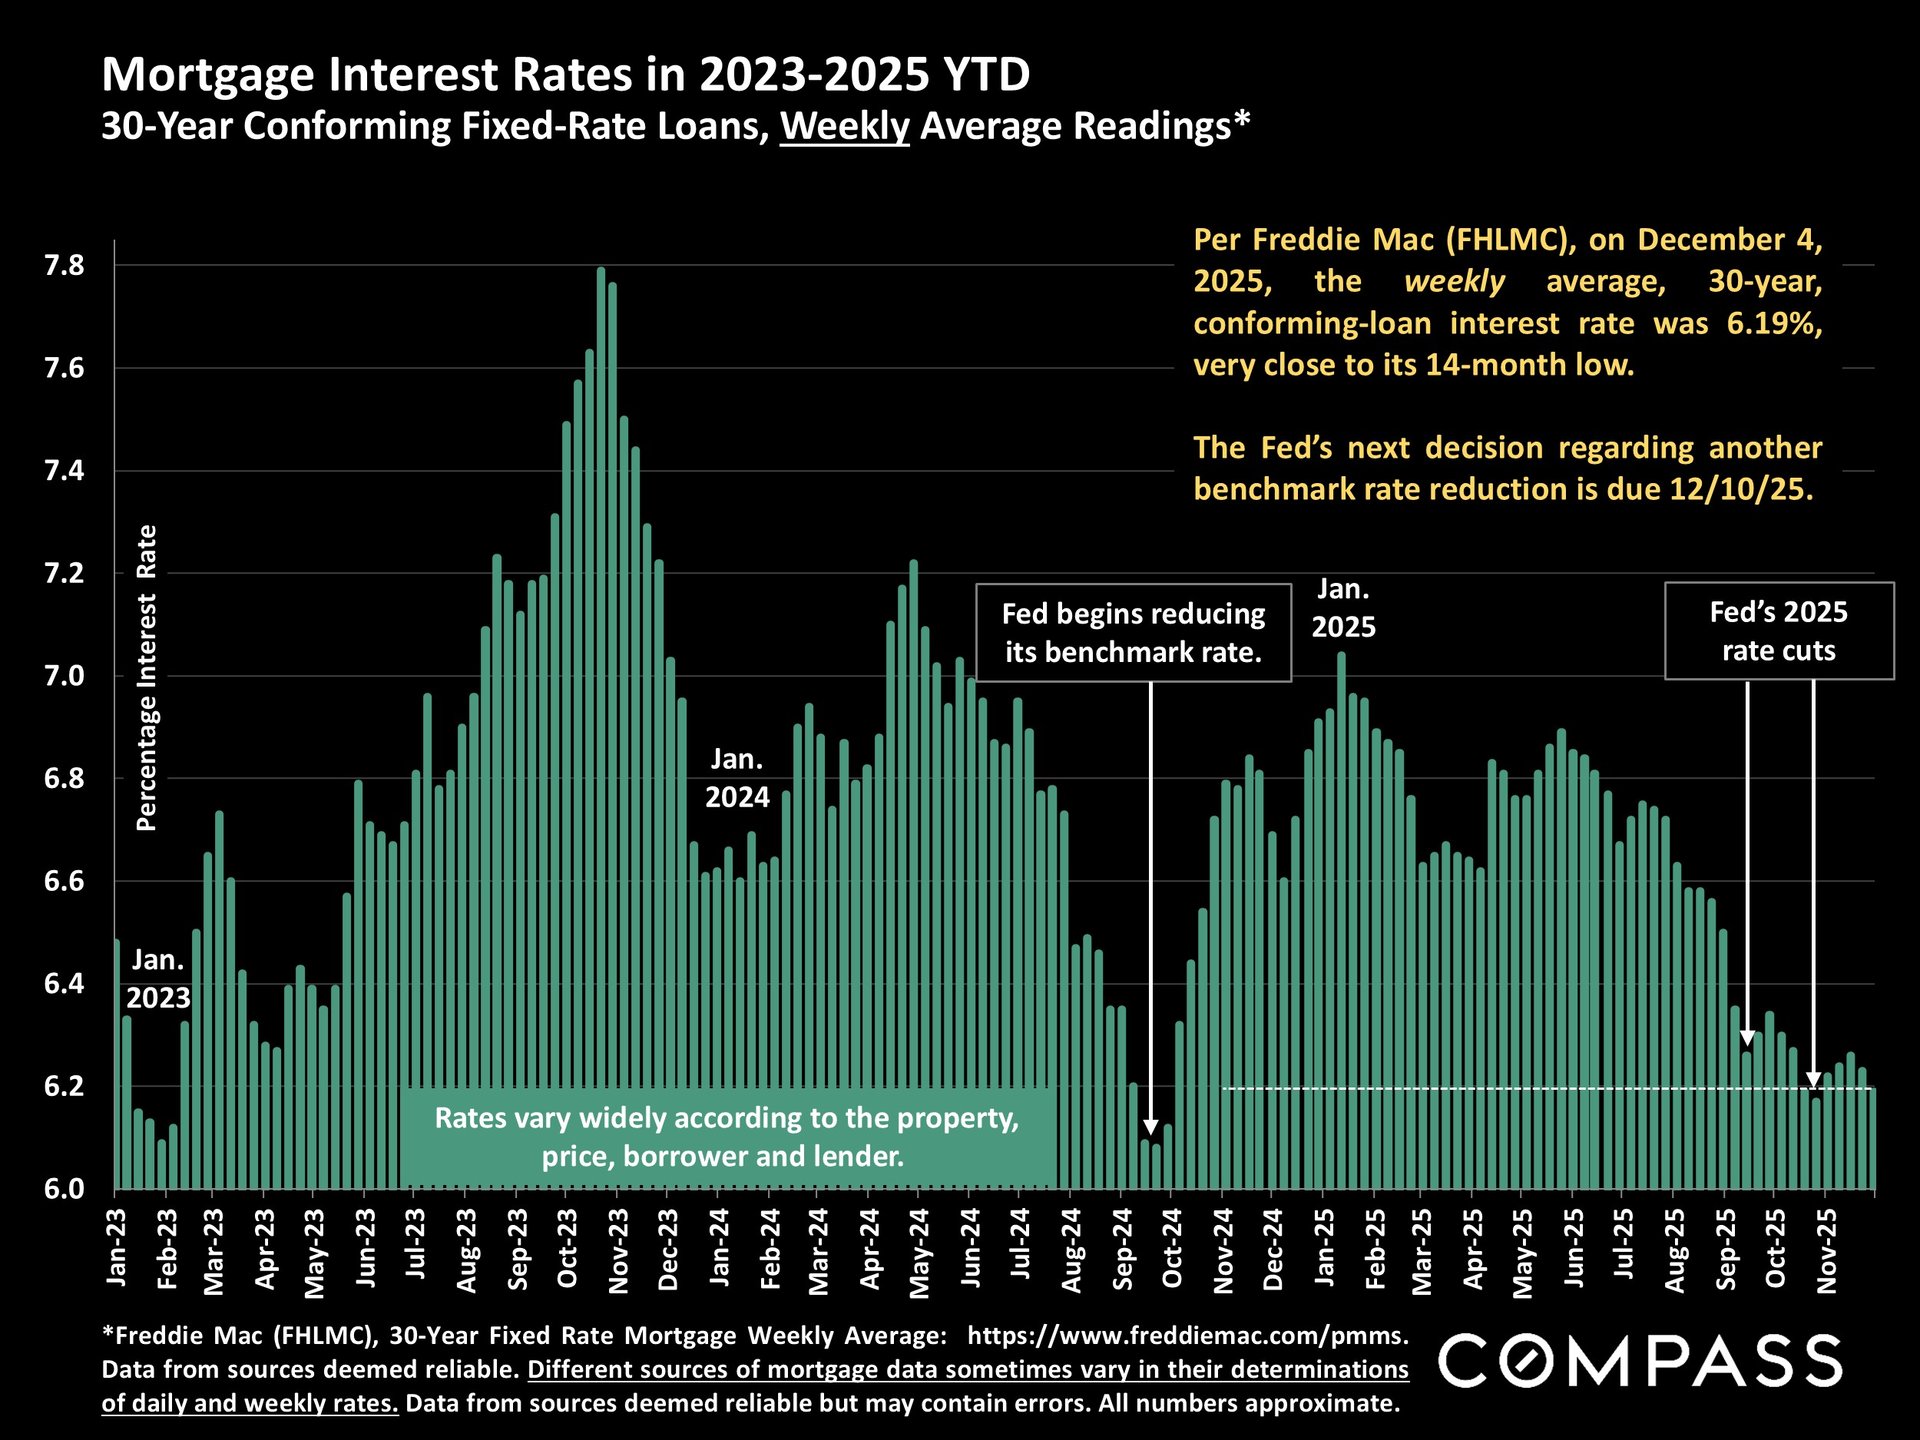
Chart of weekly 30-year mortgage rates from 2023 to 2025, with rates declining to about 6.2%.


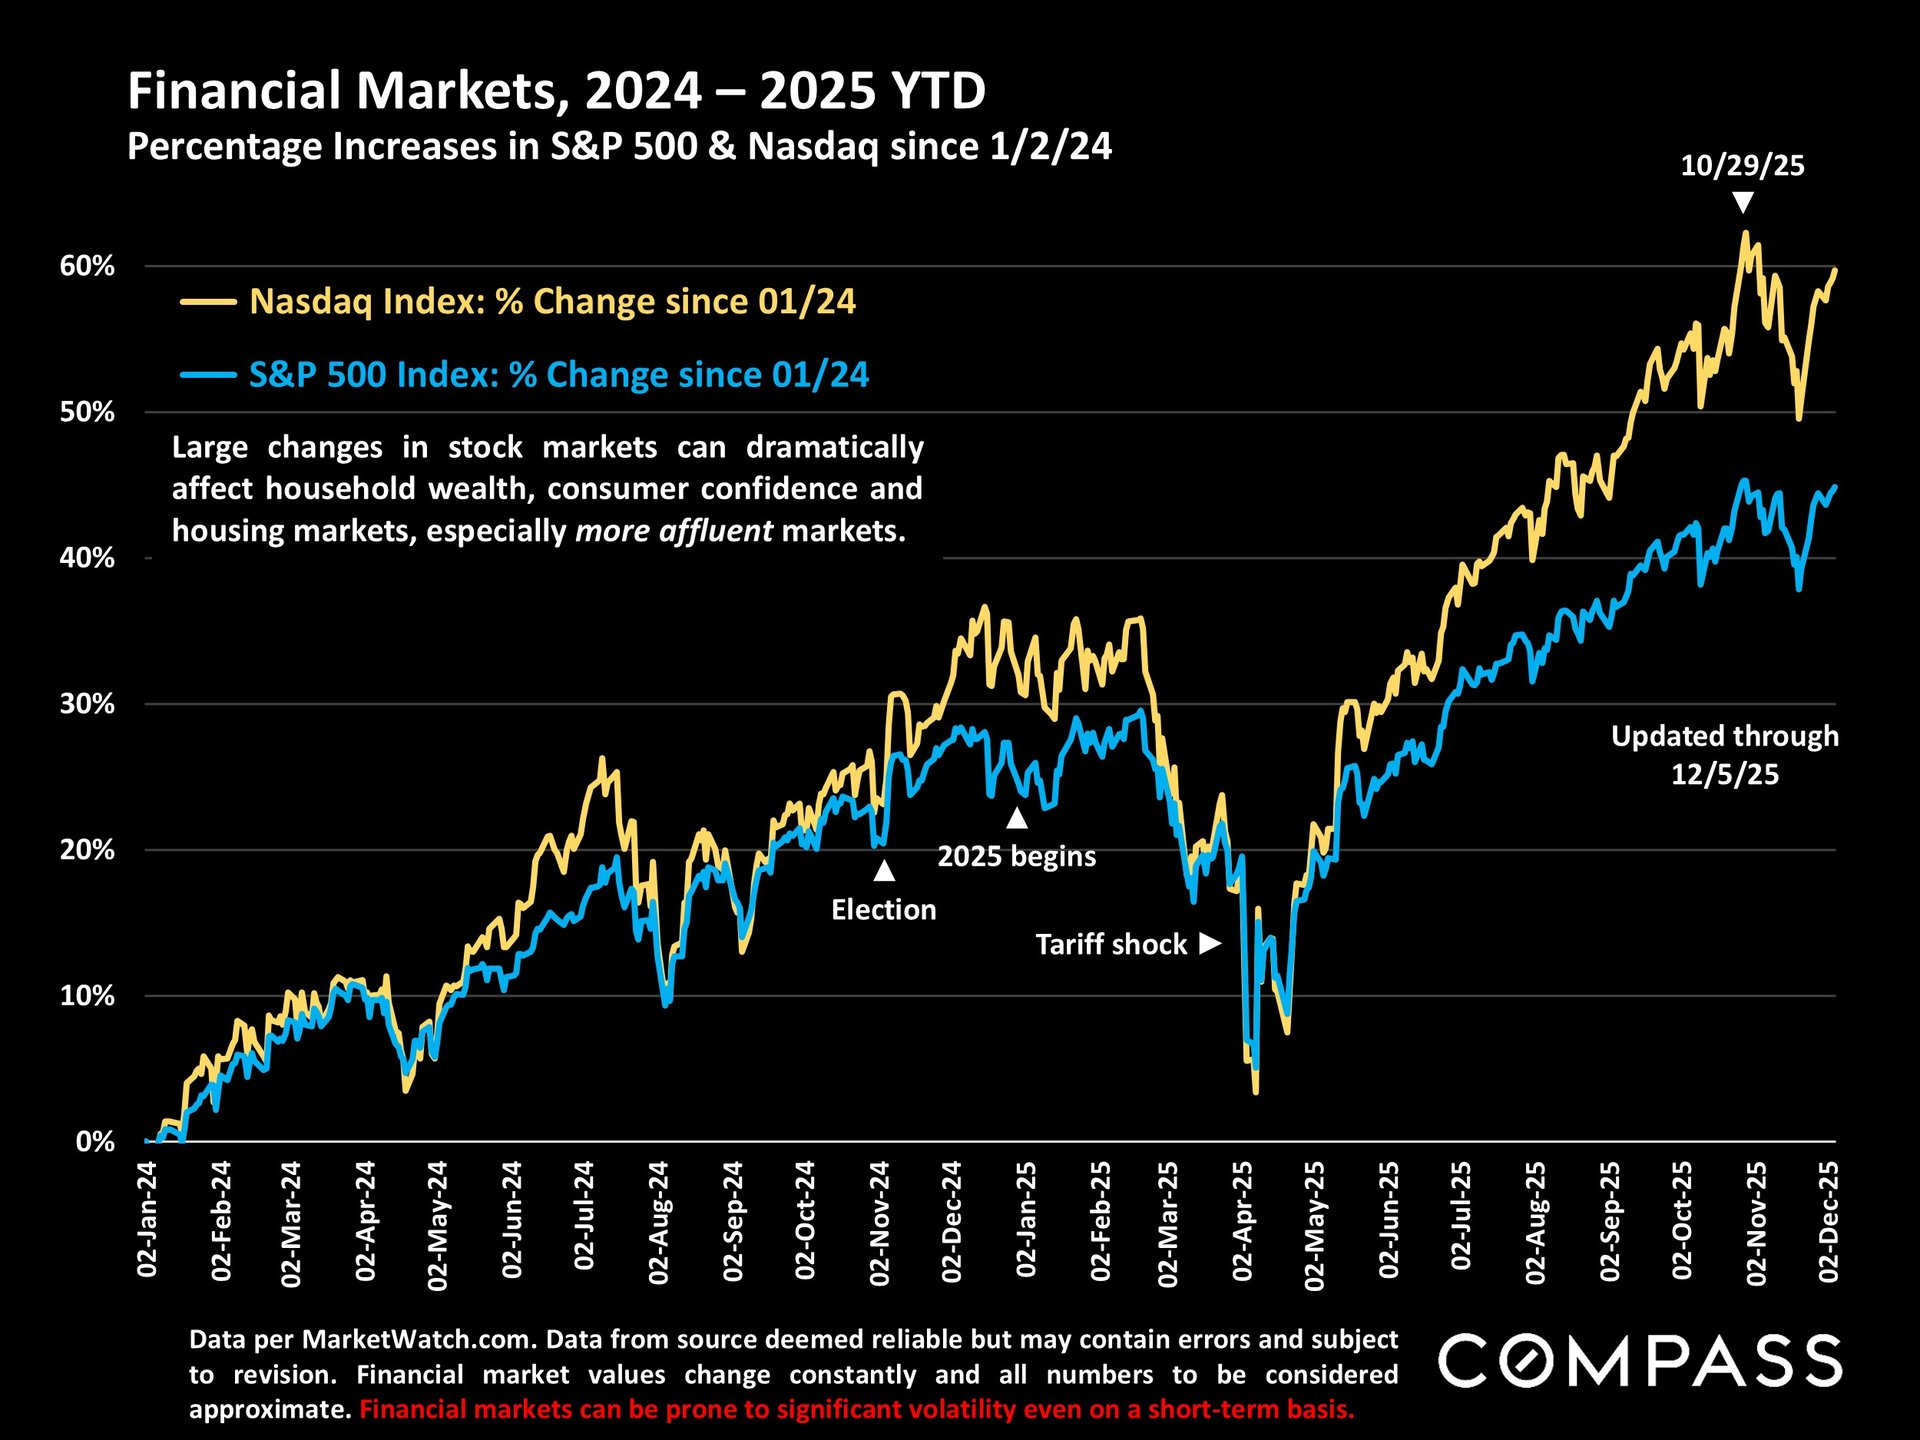
Chart comparing Nasdaq and S&P 500 gains from January 2024 through December 2025; Nasdaq ends higher.


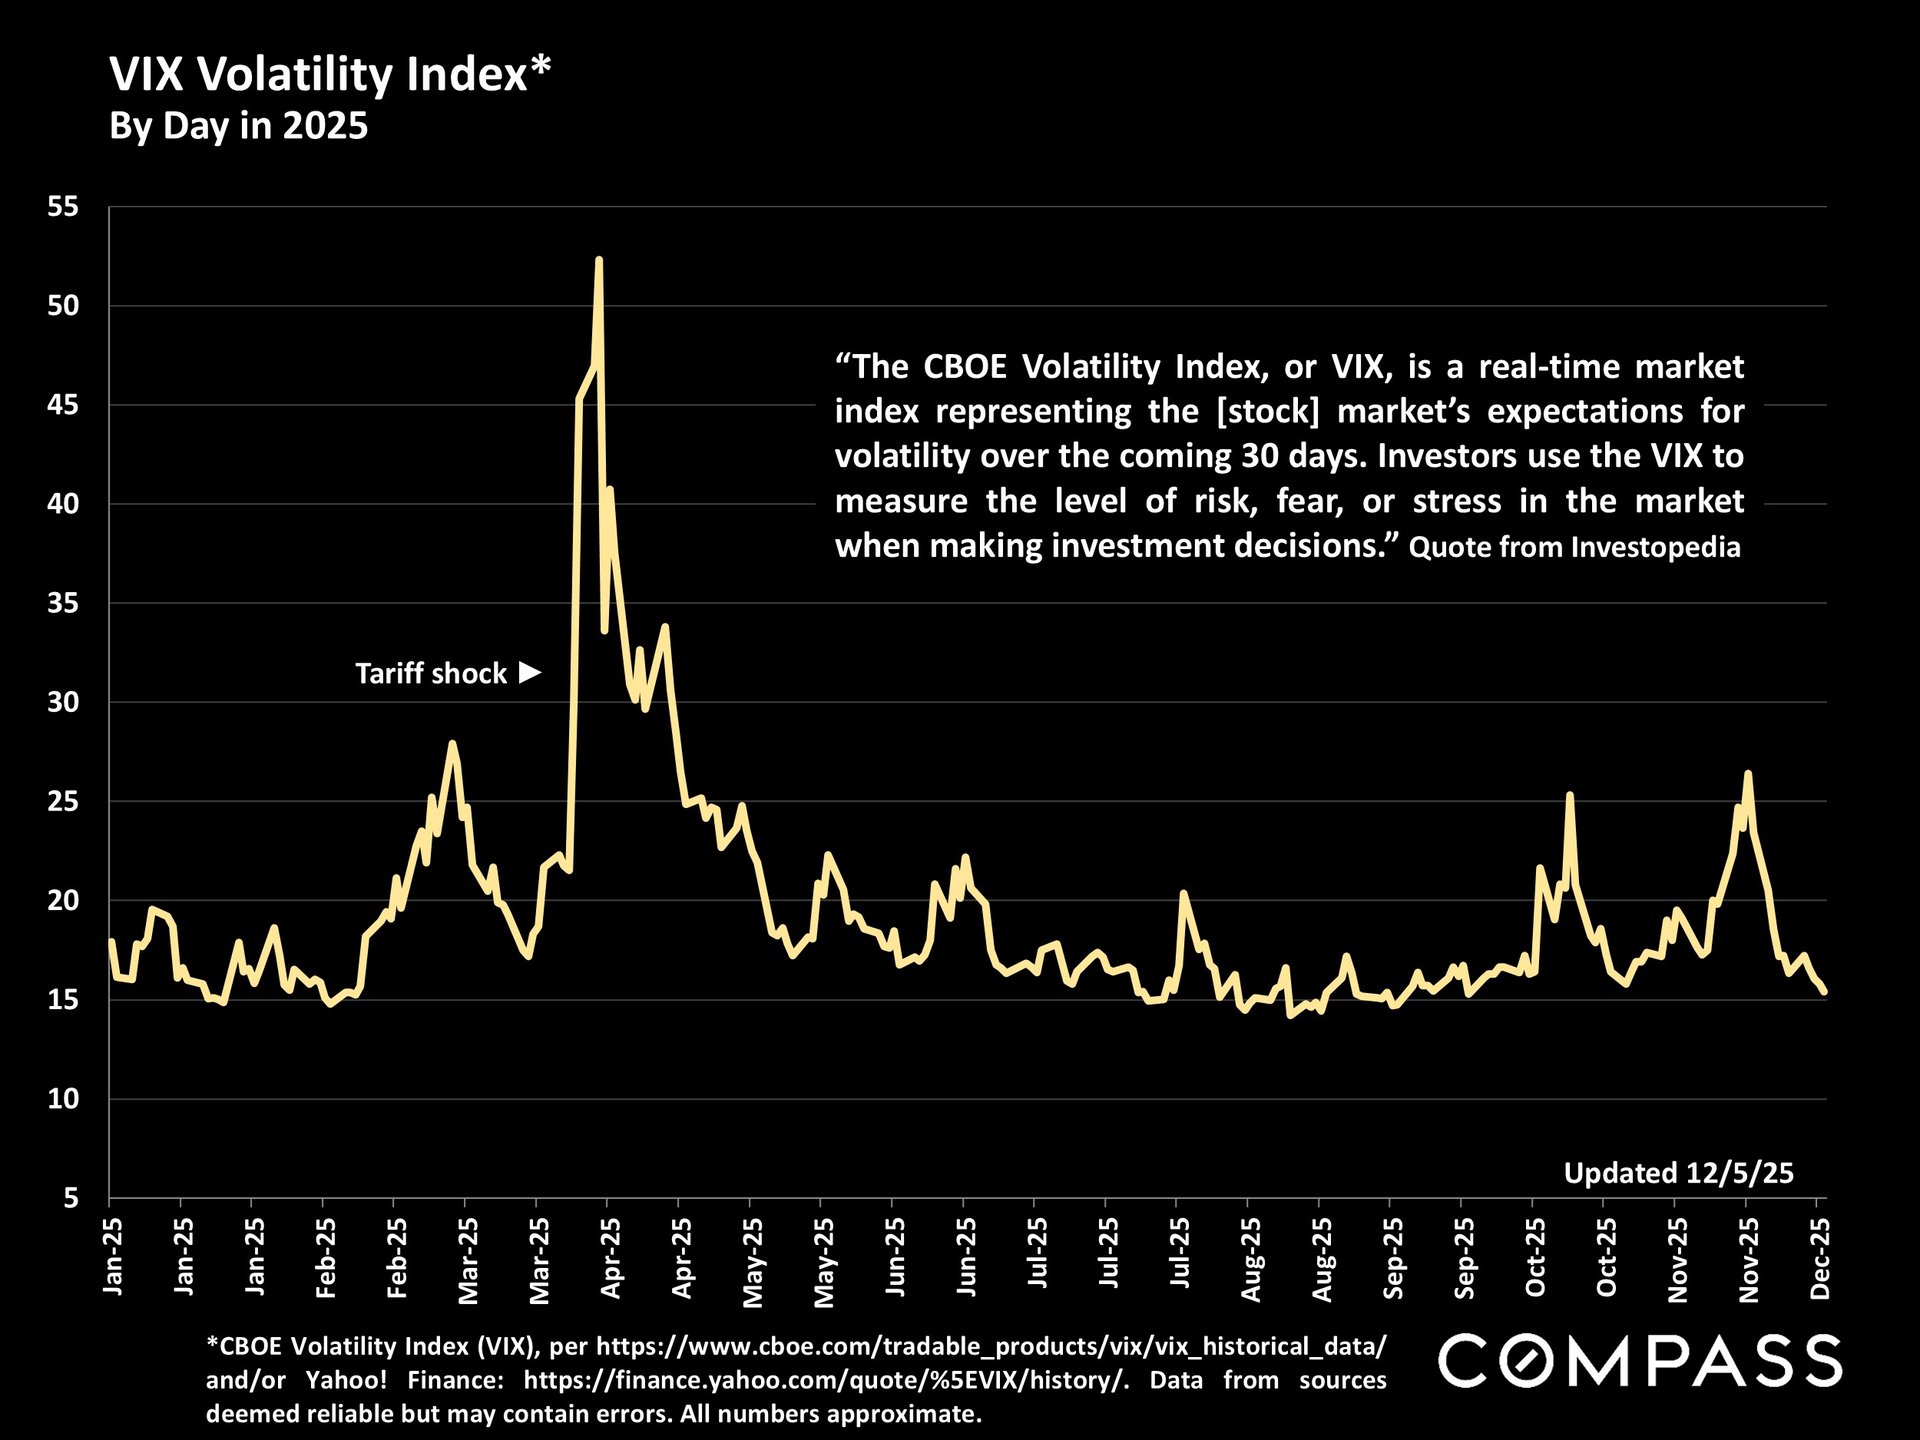
2025 VIX chart with a sharp April spike labeled “Tariff shock” and mostly lower values through summer.


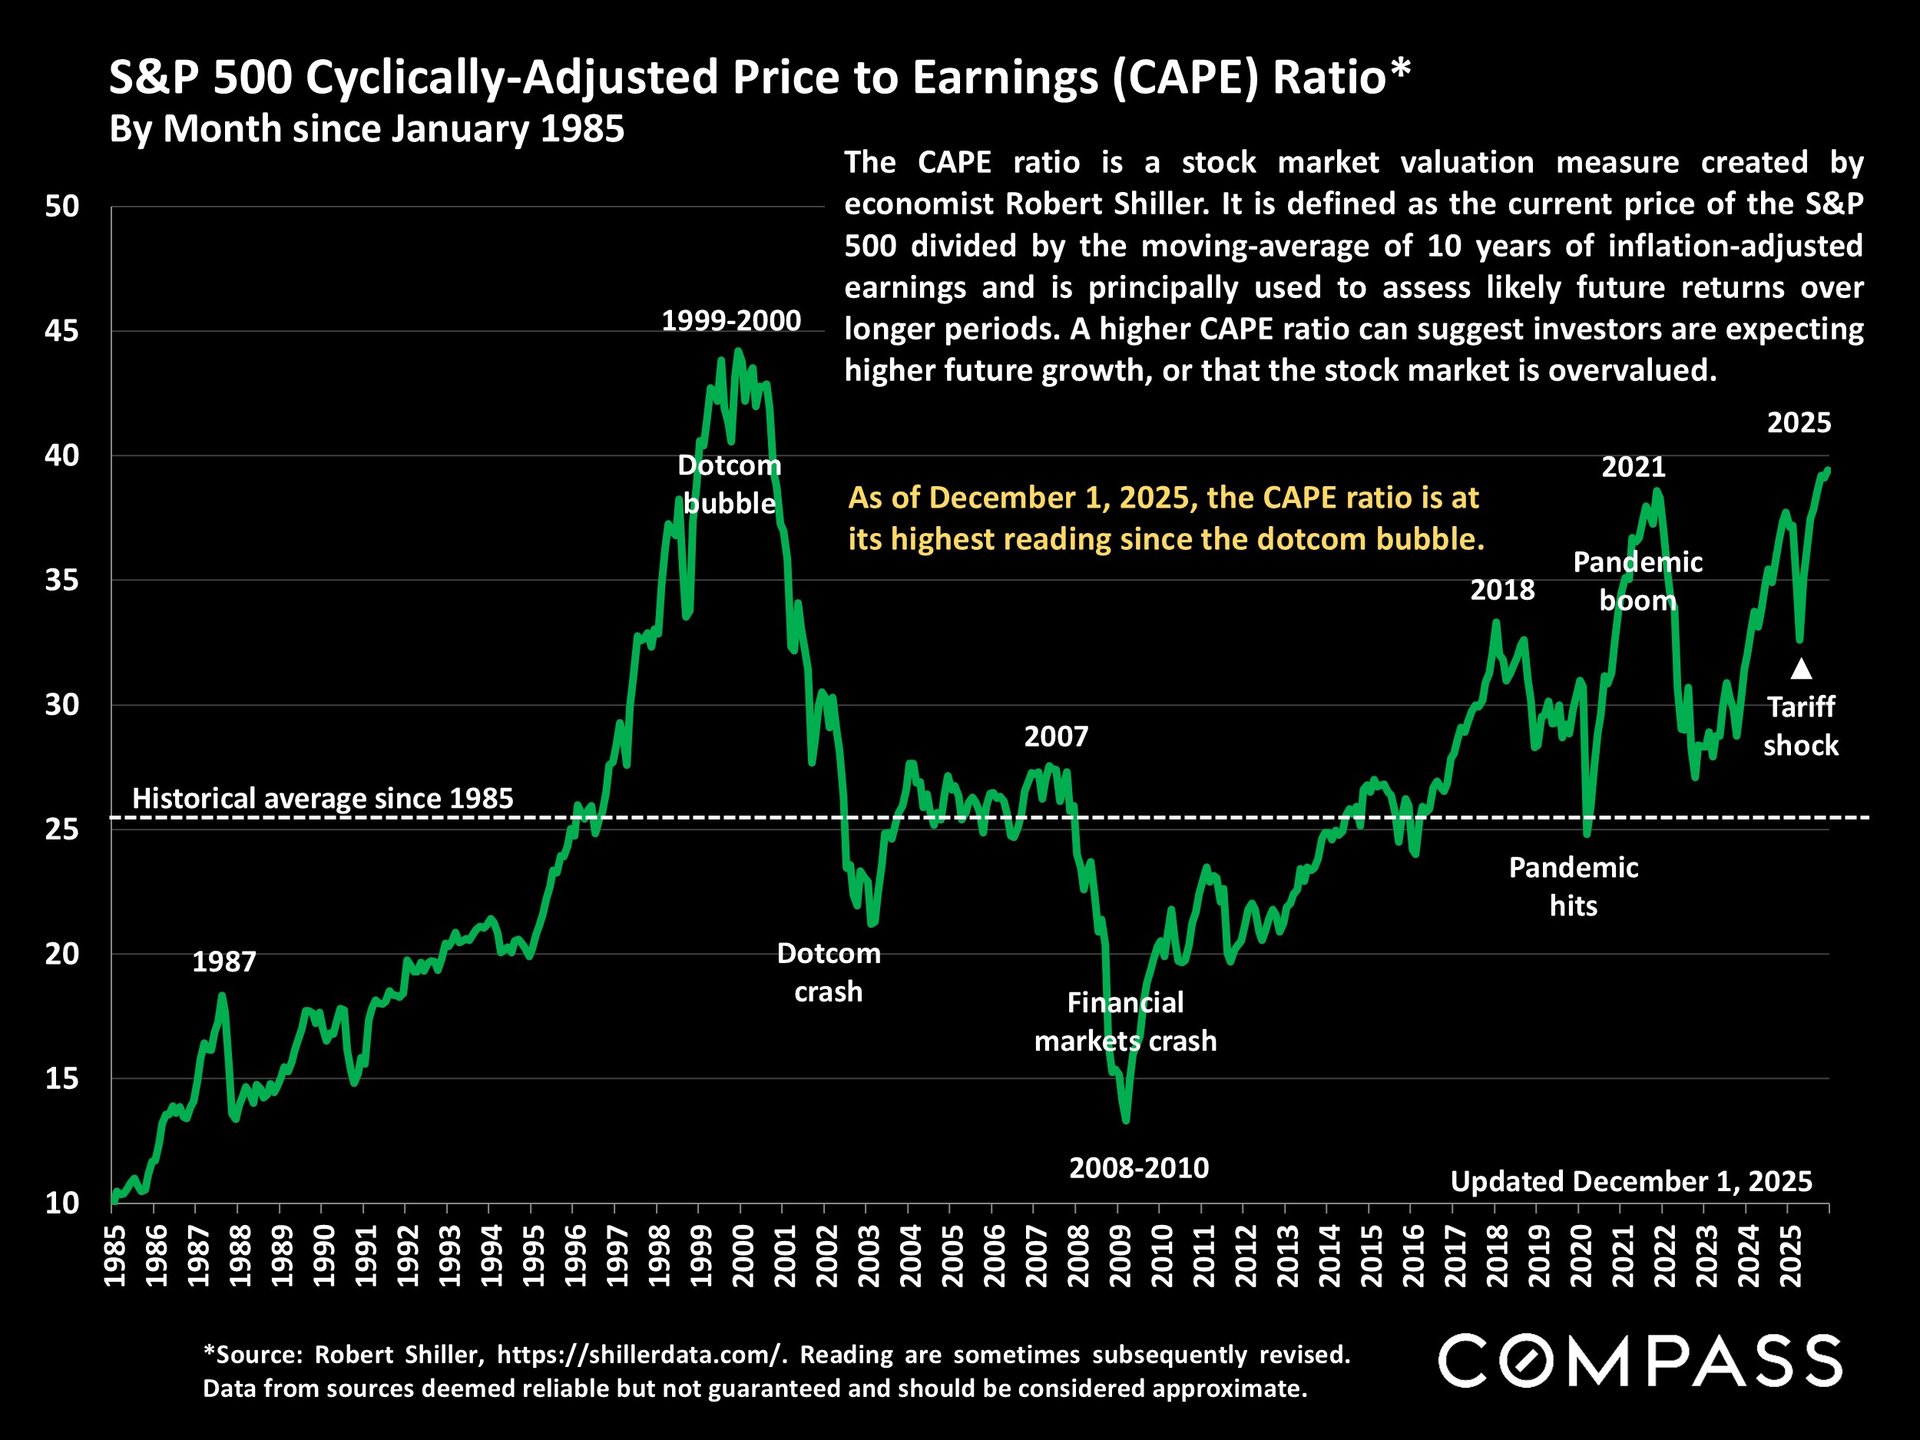
Chart of the S&P 500 CAPE ratio from 1985 to 2025, highlighting its 2025 high and historical market events.


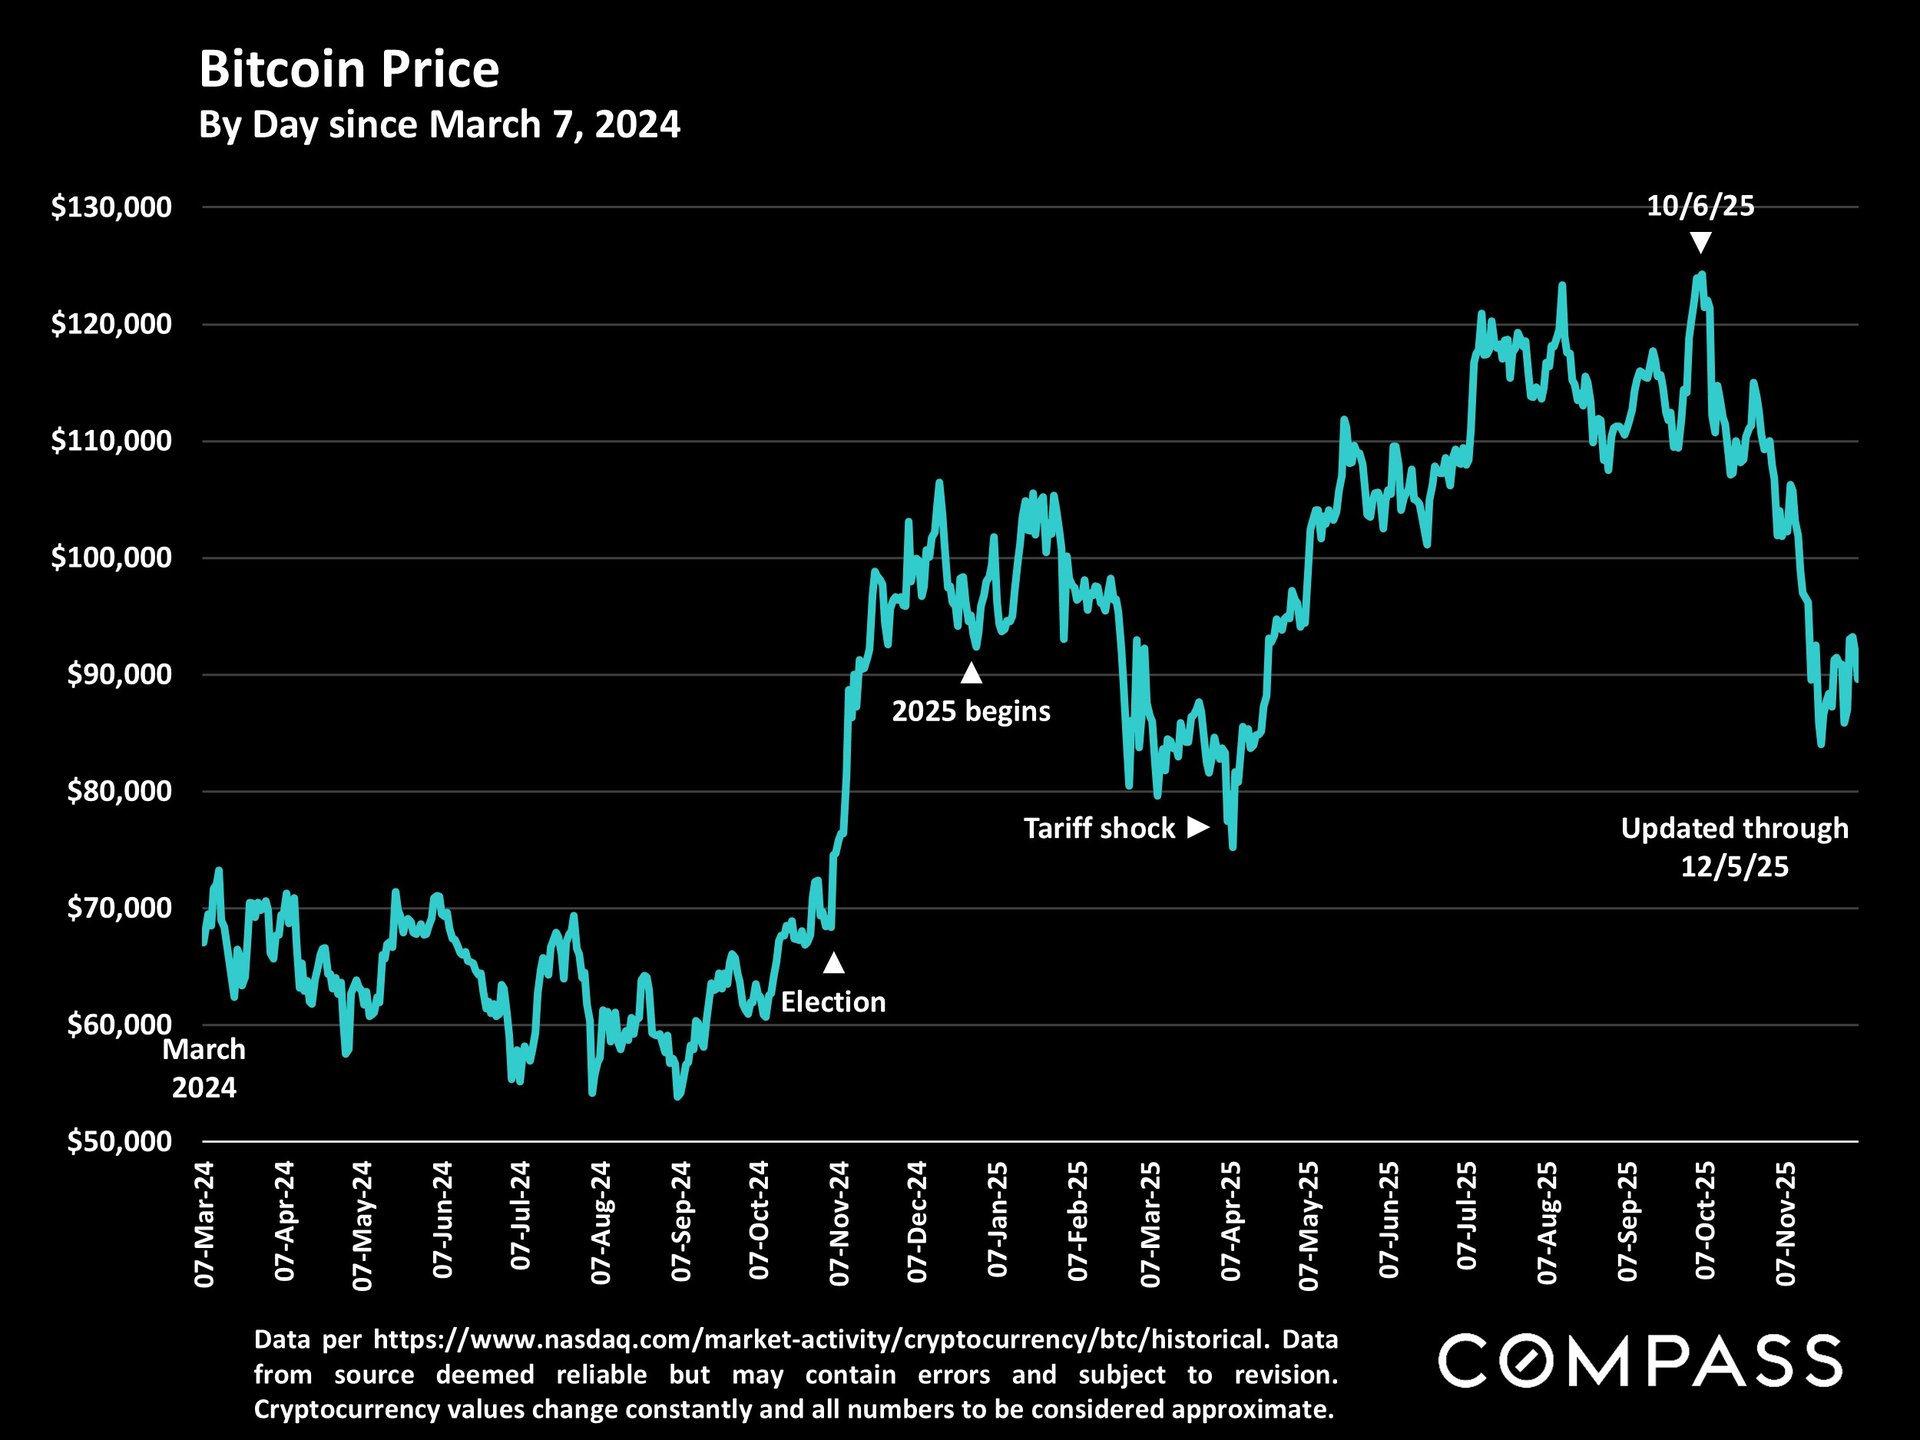
Bitcoin price chart from March 2024 to December 2025, with annotations for the election, tariff shock, and October 2025 peak.


Market report notes explain statistical limitations, sales-price and square-foot measures, licensing, and legal disclaimers.

Work With Us

We pride ourselves in providing personalized solutions that bring our clients closer to their dream properties and enhance their long-term wealth.
Contact Us

Follow Us On Instagram