
Blog

San Mateo 2025 July Market Update

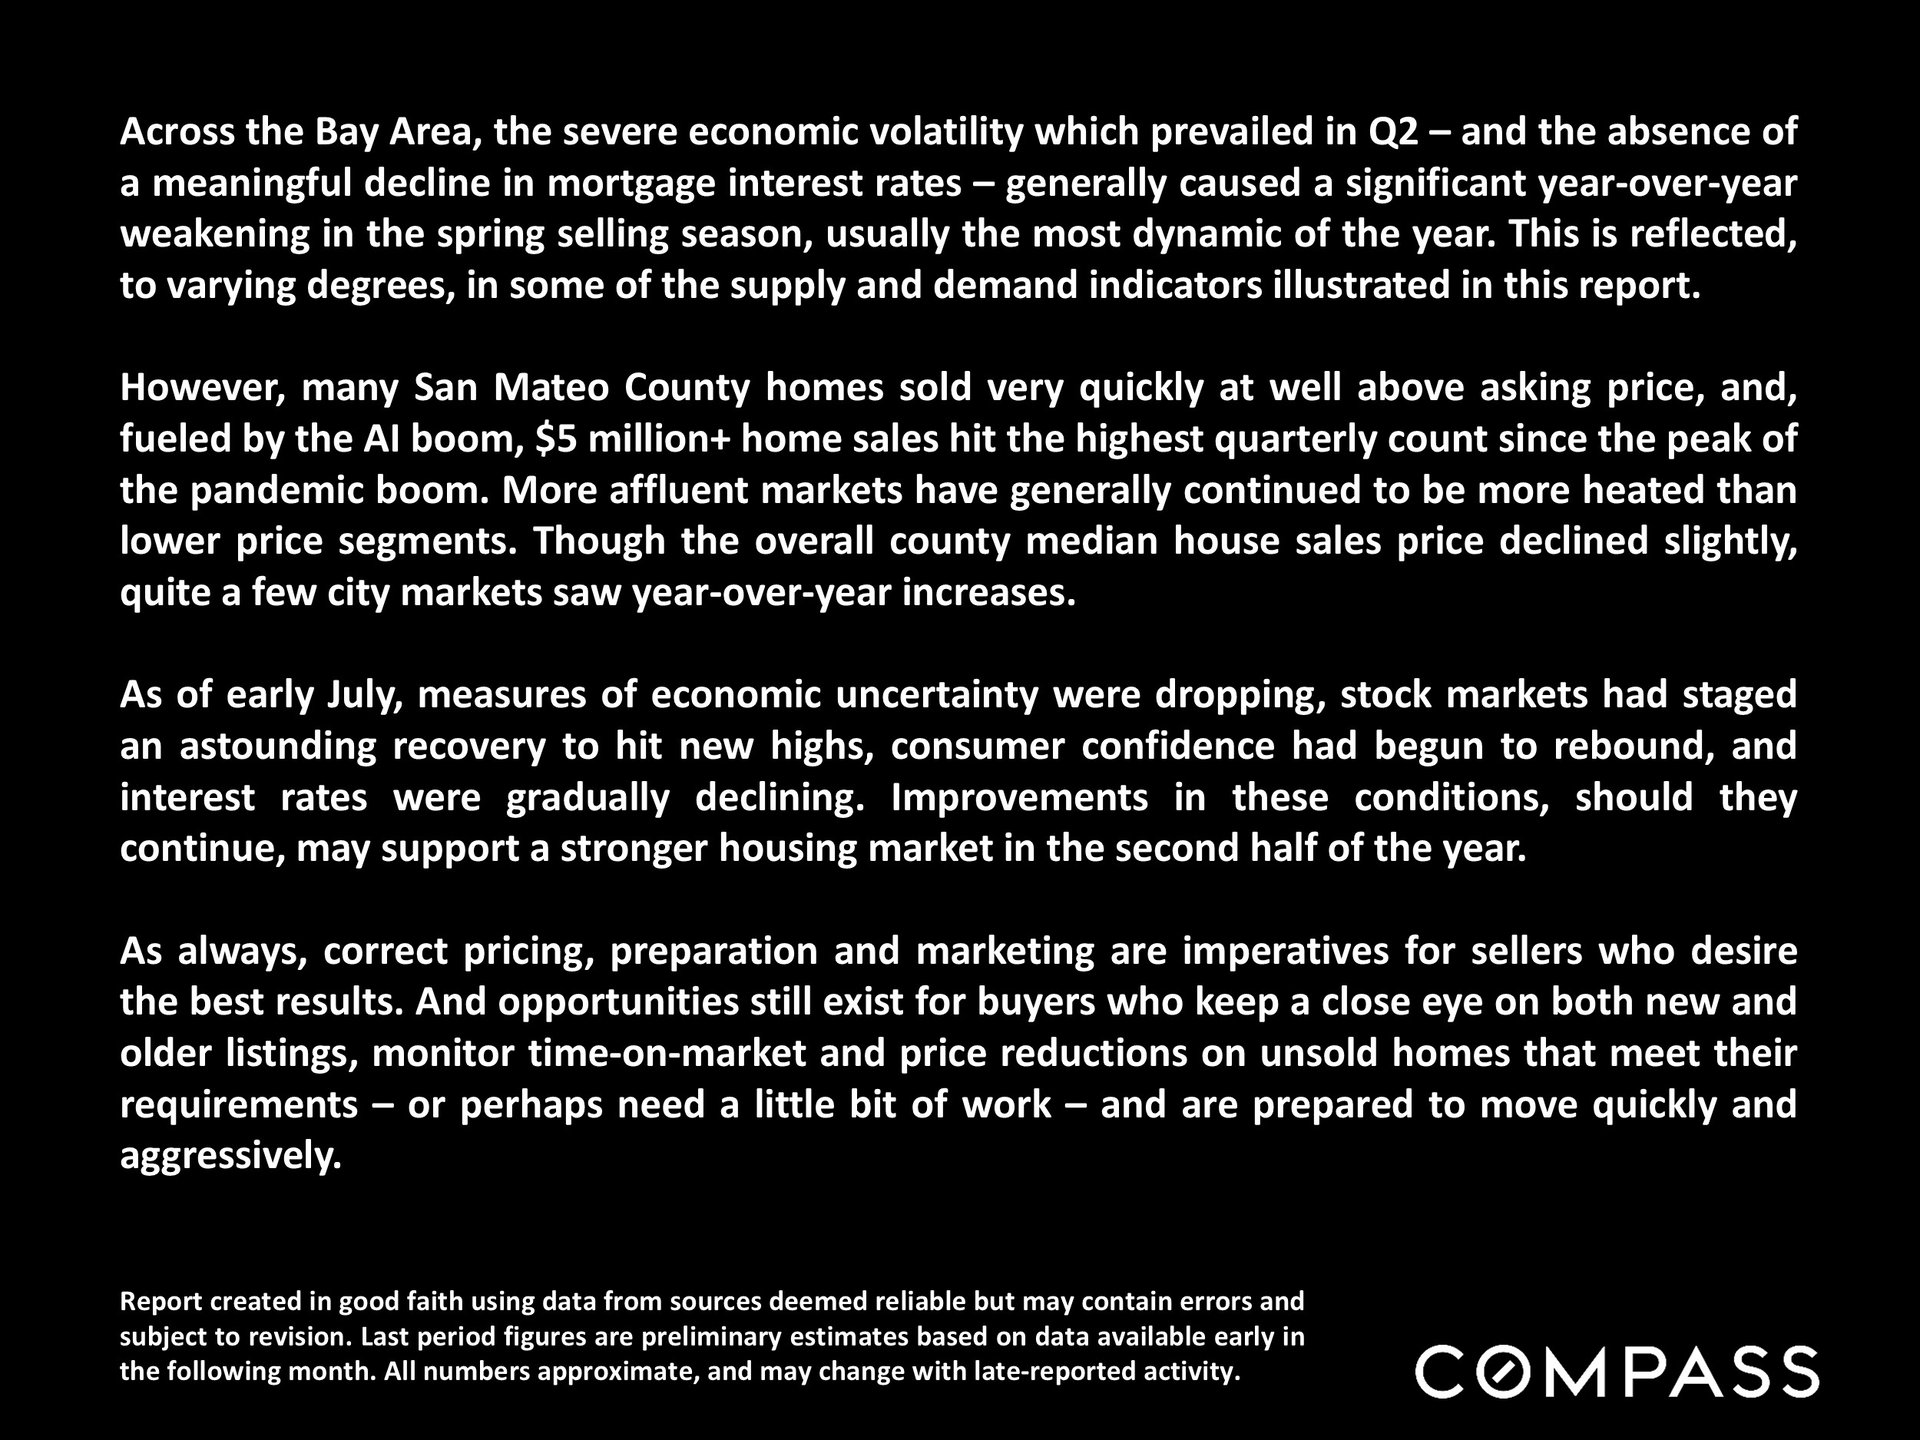
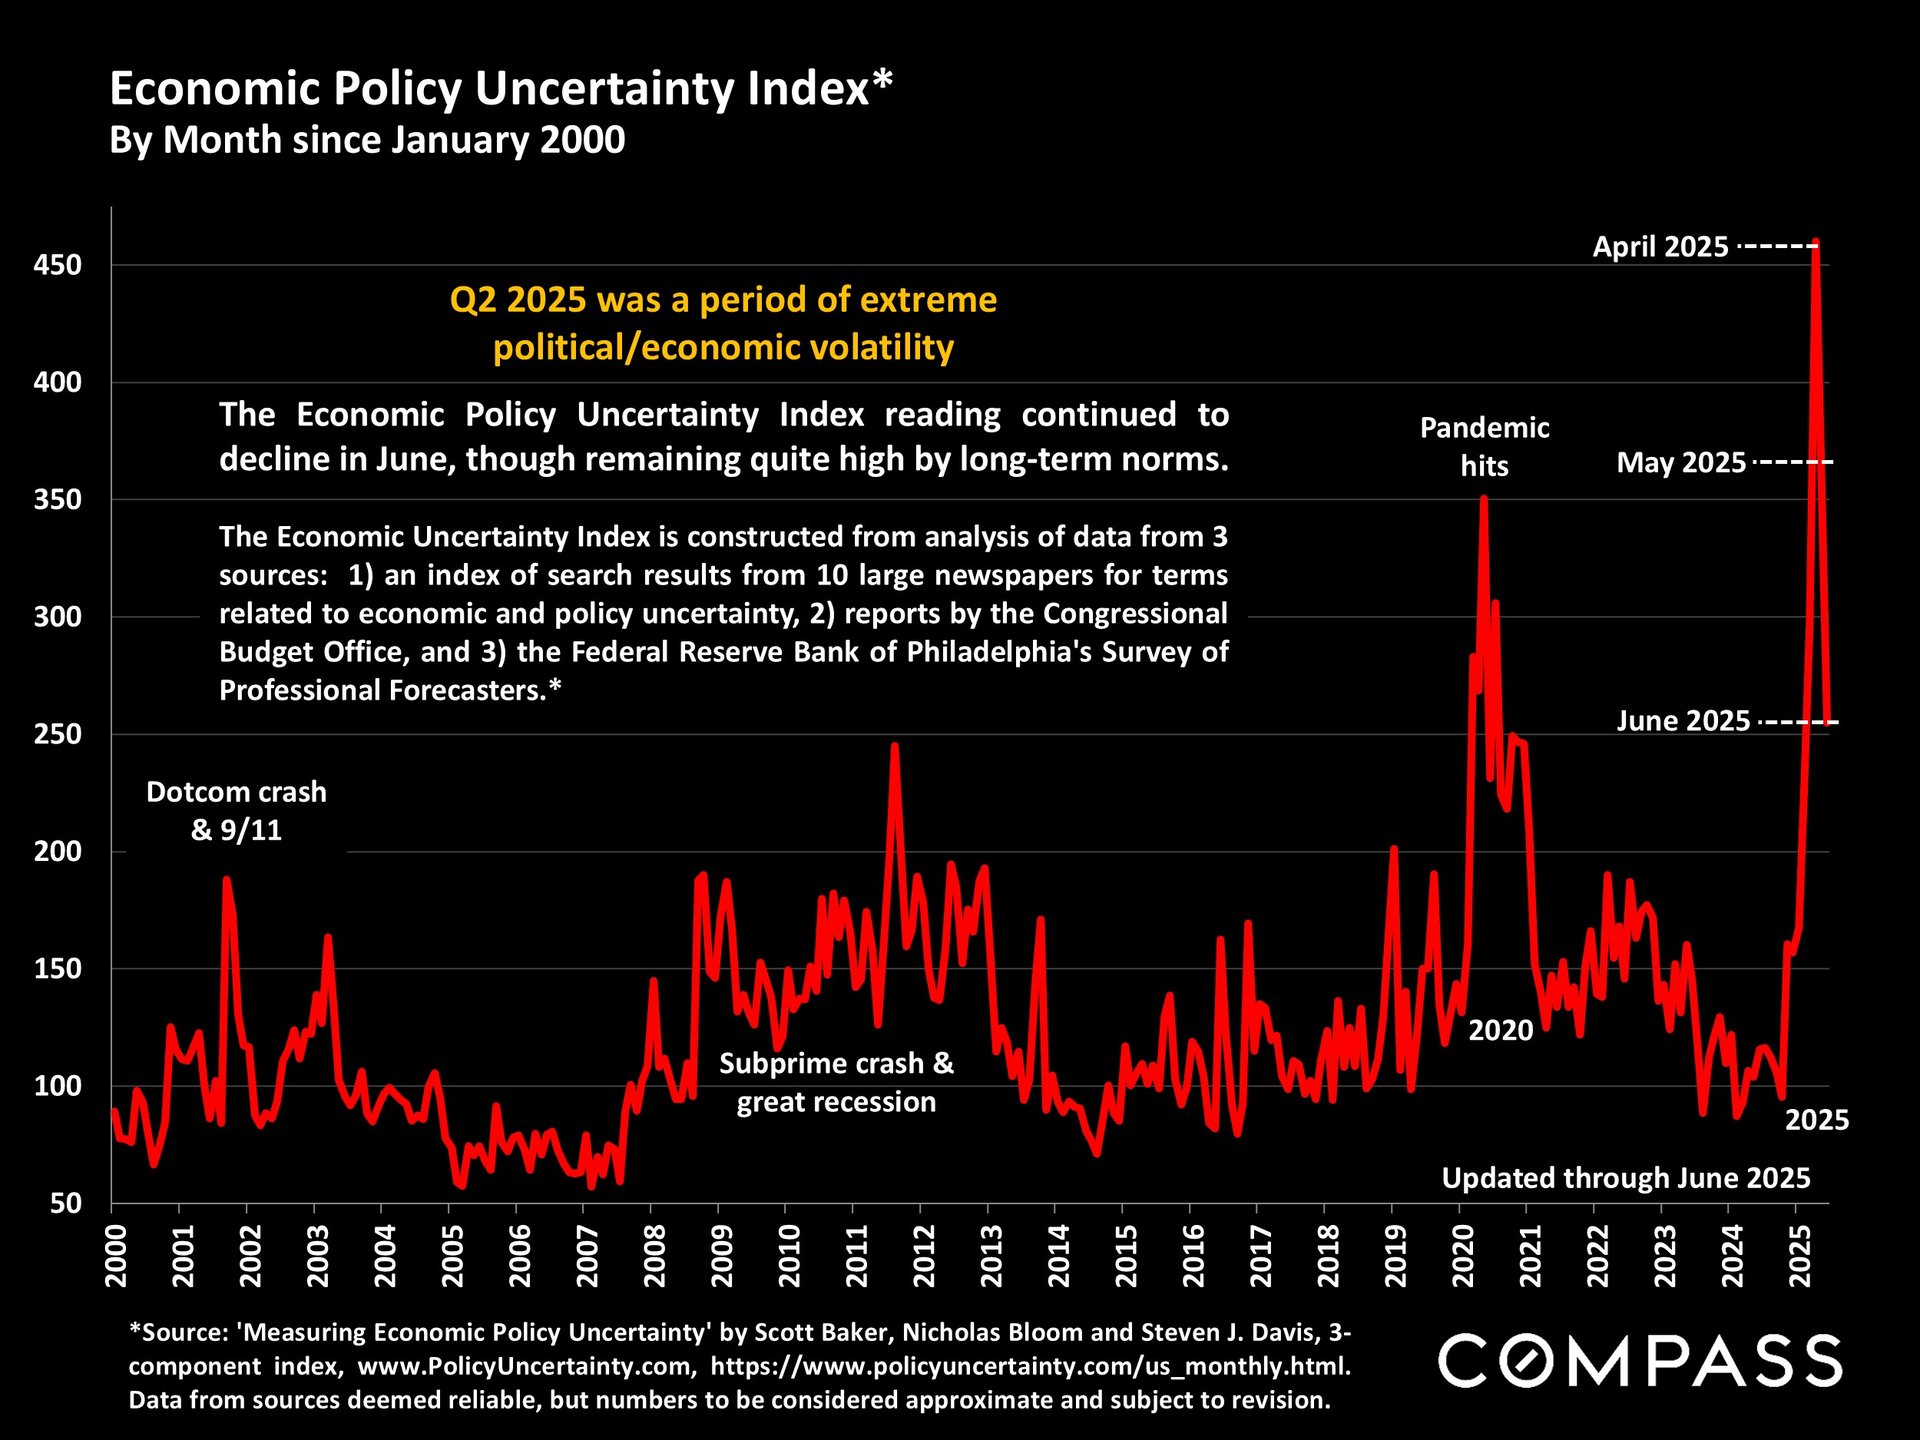
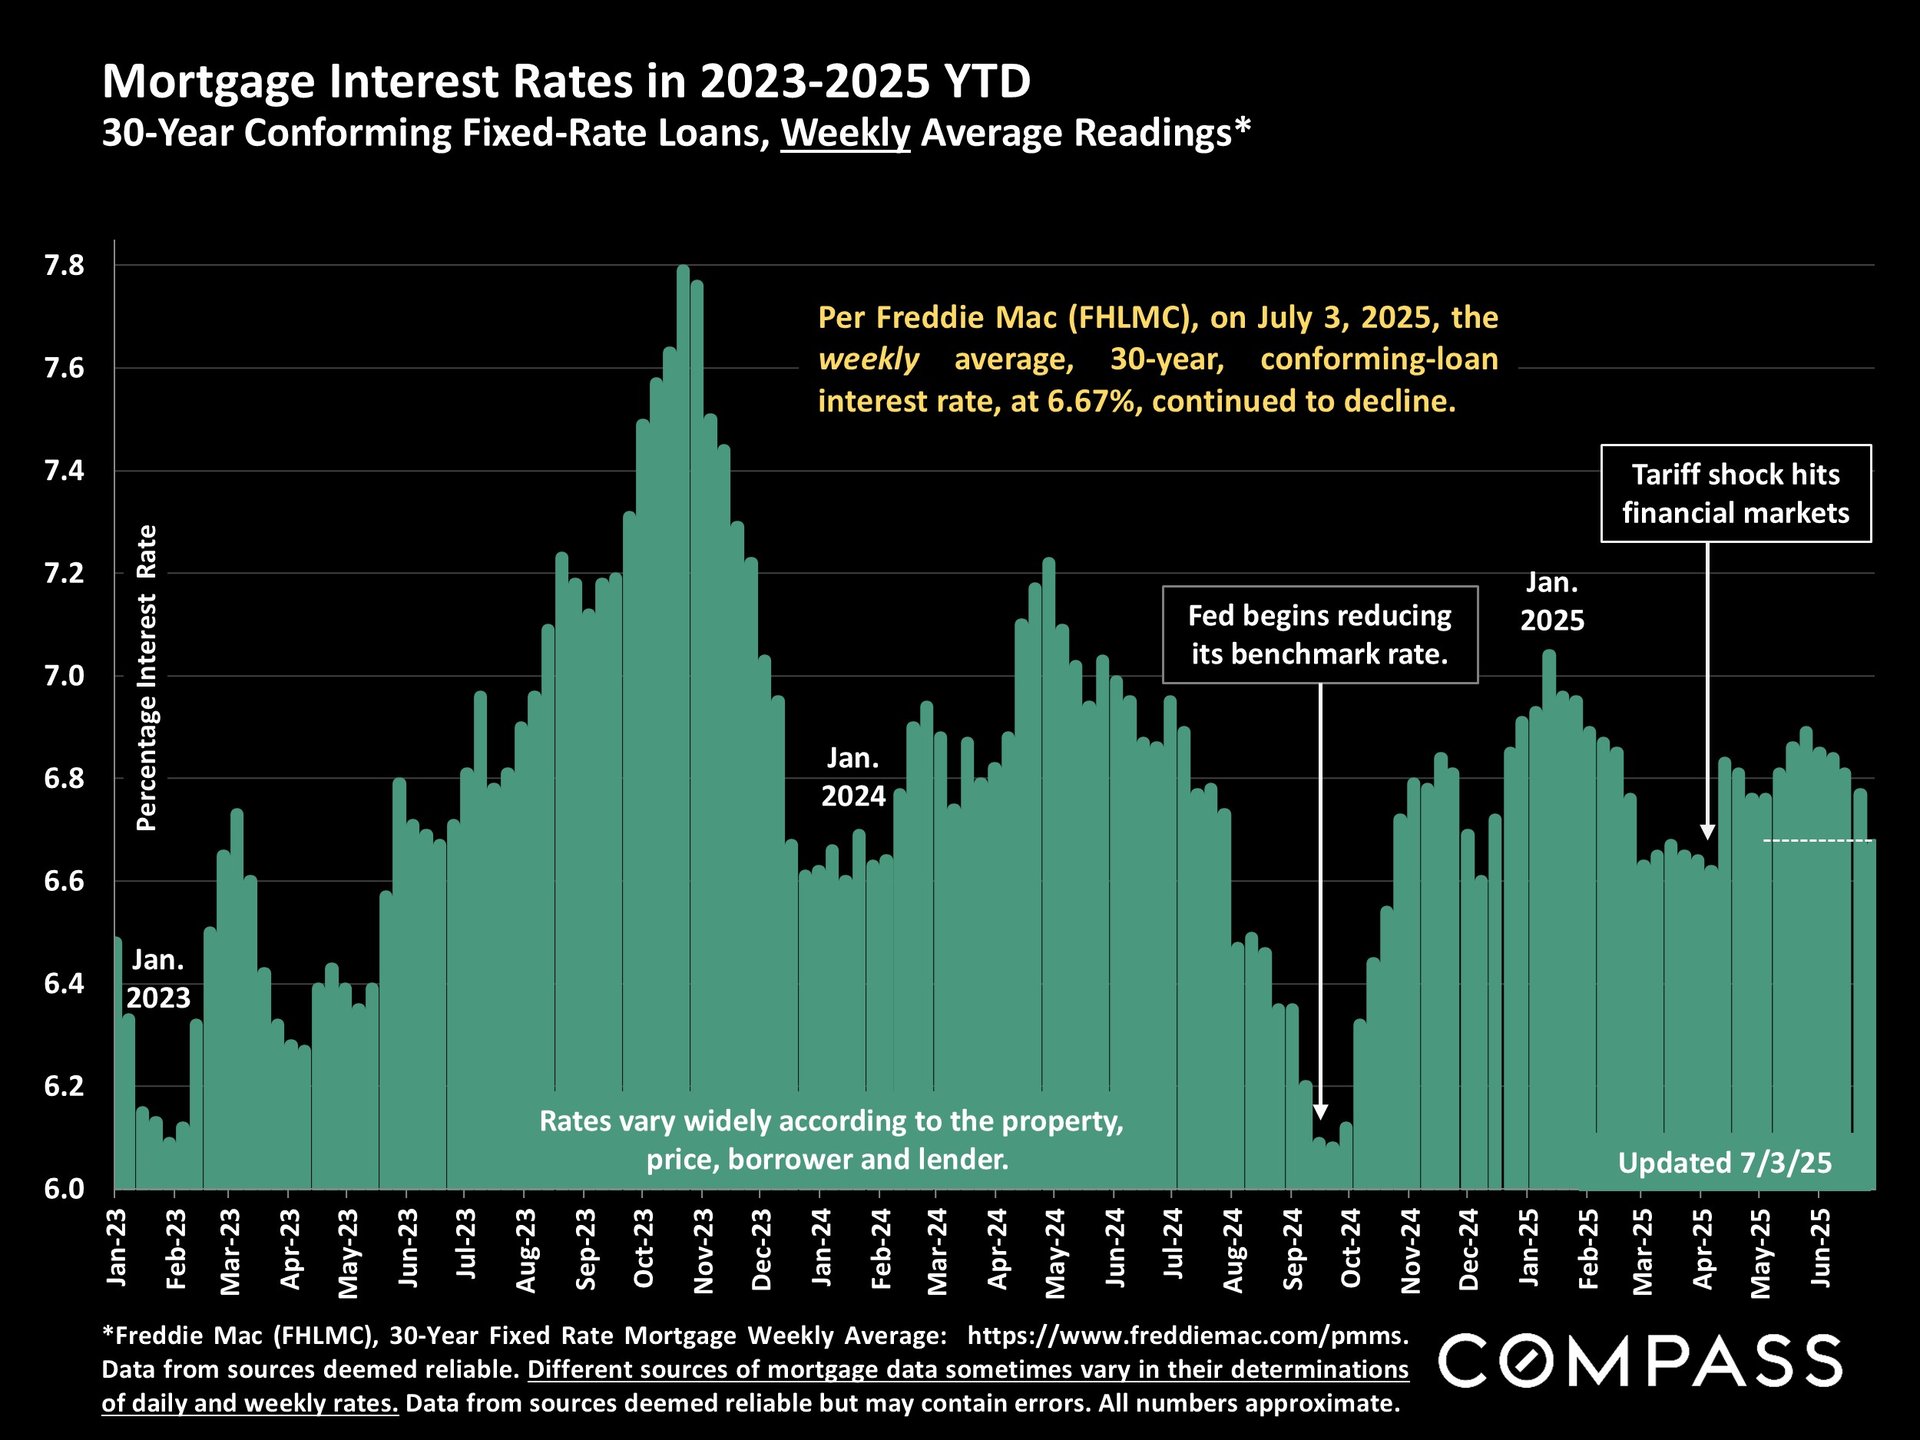
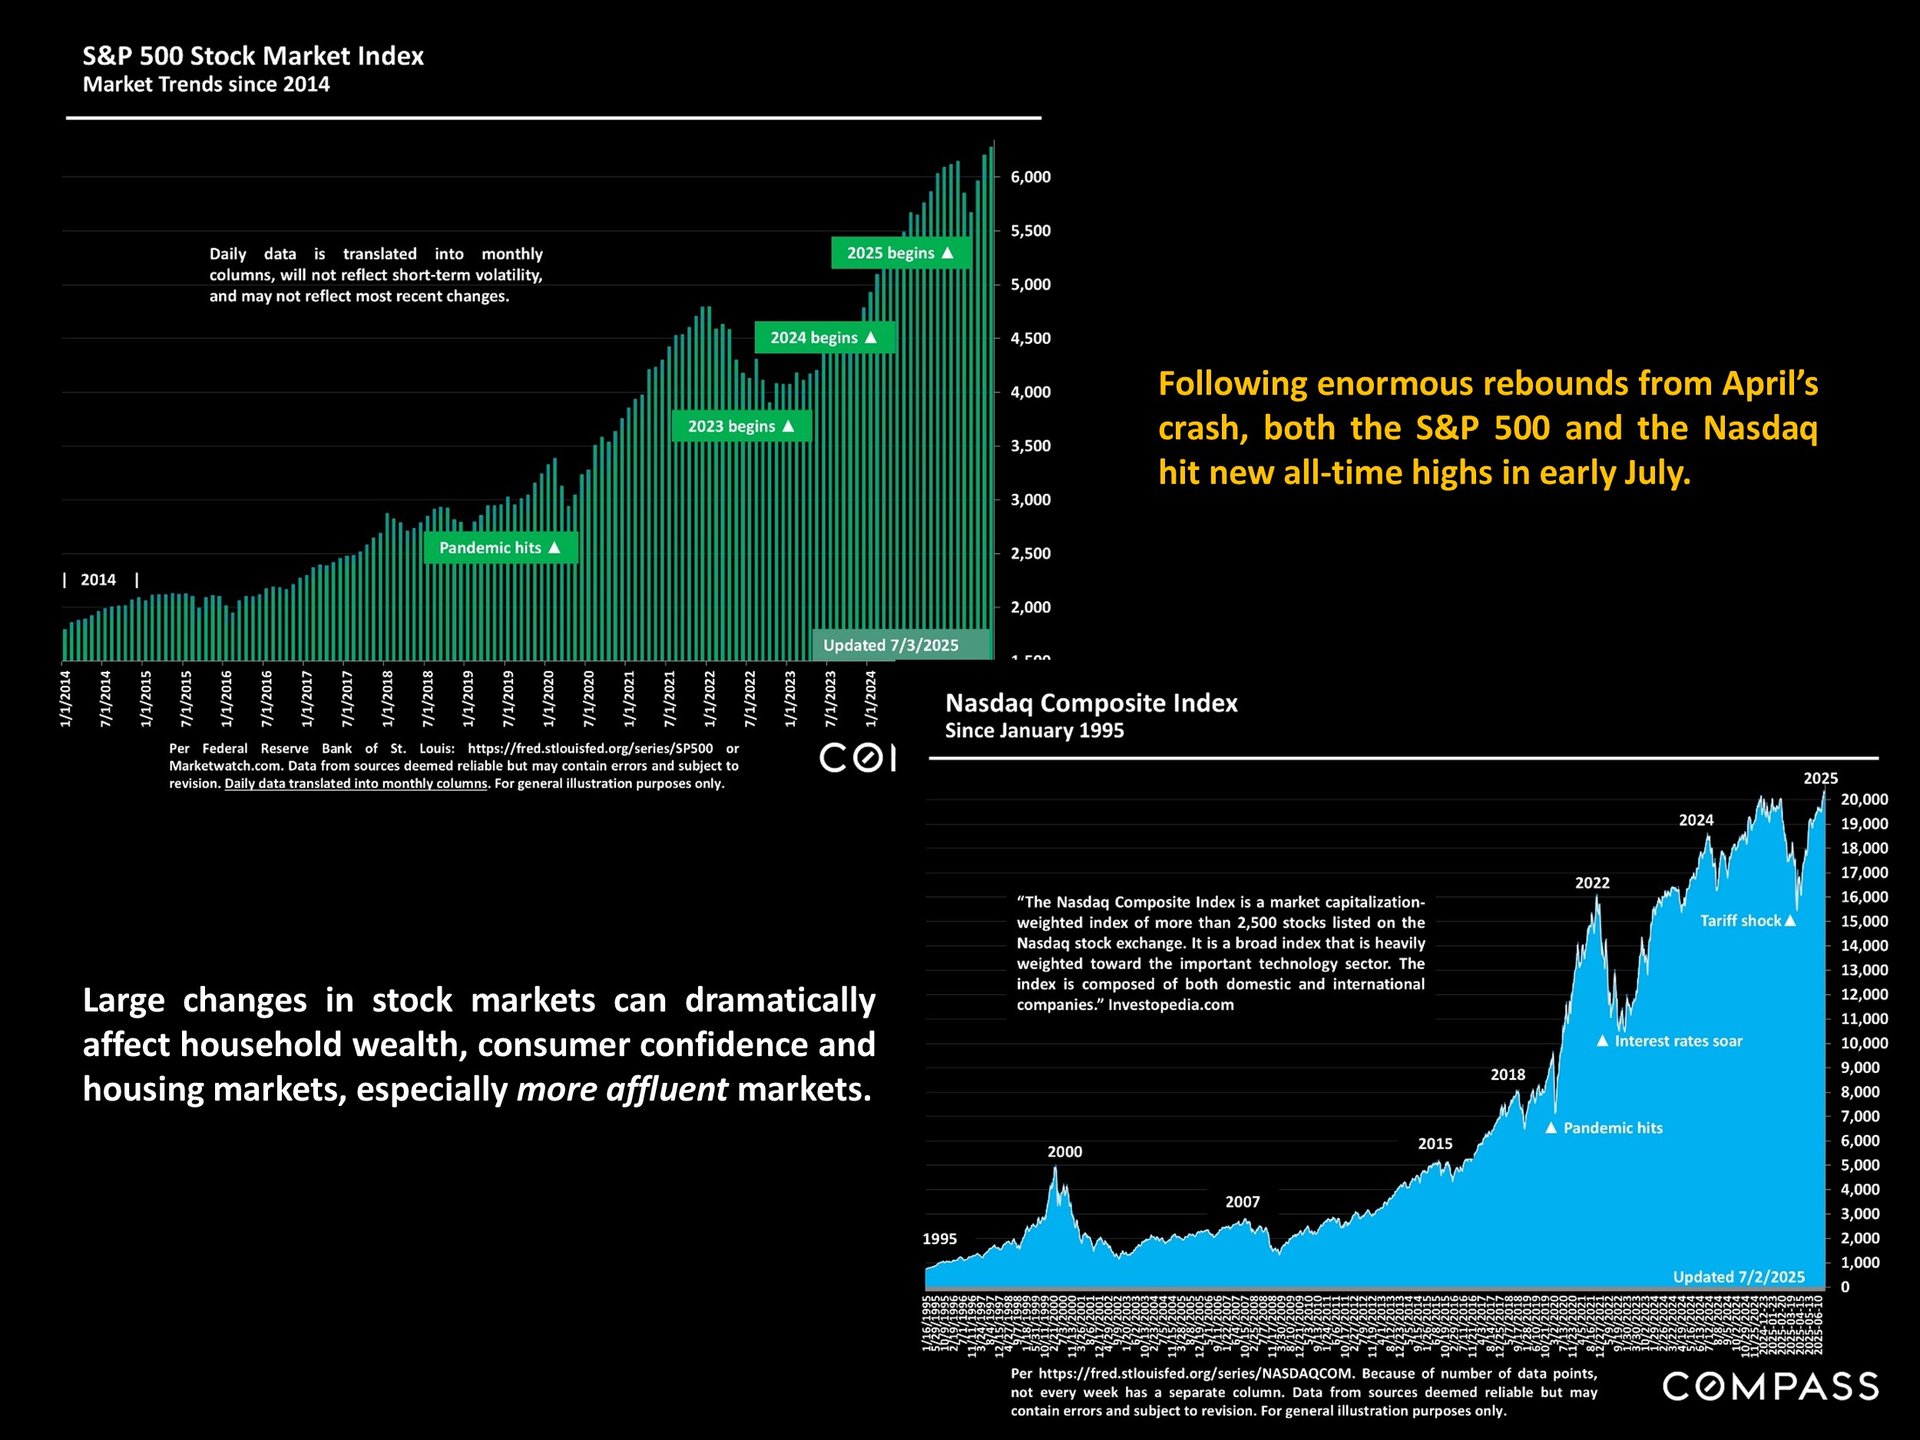
Across the Bay Area, the severe economic volatility which prevailed in Q2 – and the absence of a meaningful decline in mortgage interest rates – generally caused a significant year-over-year weakening in the spring selling season, usually the most dynamic of the year. This is reflected, to varying degrees, in some of the supply and demand indicators illustrated in this report. However, many San Mateo County homes sold very quickly at well above asking price, and, fueled by the AI boom, $5 million+ home sales hit the highest quarterly count since the peak of the pandemic boom. More affluent markets have generally continued to be more heated than lower price segments. Though the overall county median house sales price declined slightly, quite a few city markets saw year-over-year increases. As of early July, measures of economic uncertainty were dropping, stock markets had staged an astounding recovery to hit new highs, consumer confidence had begun to rebound, and interest rates were gradually declining. Improvements in these conditions, should they continue, may support a stronger housing market in the second half of the year. As always, correct pricing, preparation and marketing are imperatives for sellers who desire the best results. And opportunities still exist for buyers who keep a close eye on both new and older listings, monitor time-on-market and price reductions on unsold homes that meet their requirements – or perhaps need a little bit of work – and are prepared to move quickly and aggressively.

 

San Mateo County Real Estate July 2025 report cover with a panoramic coastal beach and hills.


San Mateo County housing market update on sales, prices, and economic conditions in early July.


Chart of the economic policy uncertainty index from 2000 to June 2025, with a sharp spike in April 2025.


Chart of weekly 30-year mortgage rates from 2023 to 2025, with a July 2025 rate of 6.67%.


Infographic charts S&P 500 and Nasdaq growth through July 2025, noting new highs and effects on housing markets.


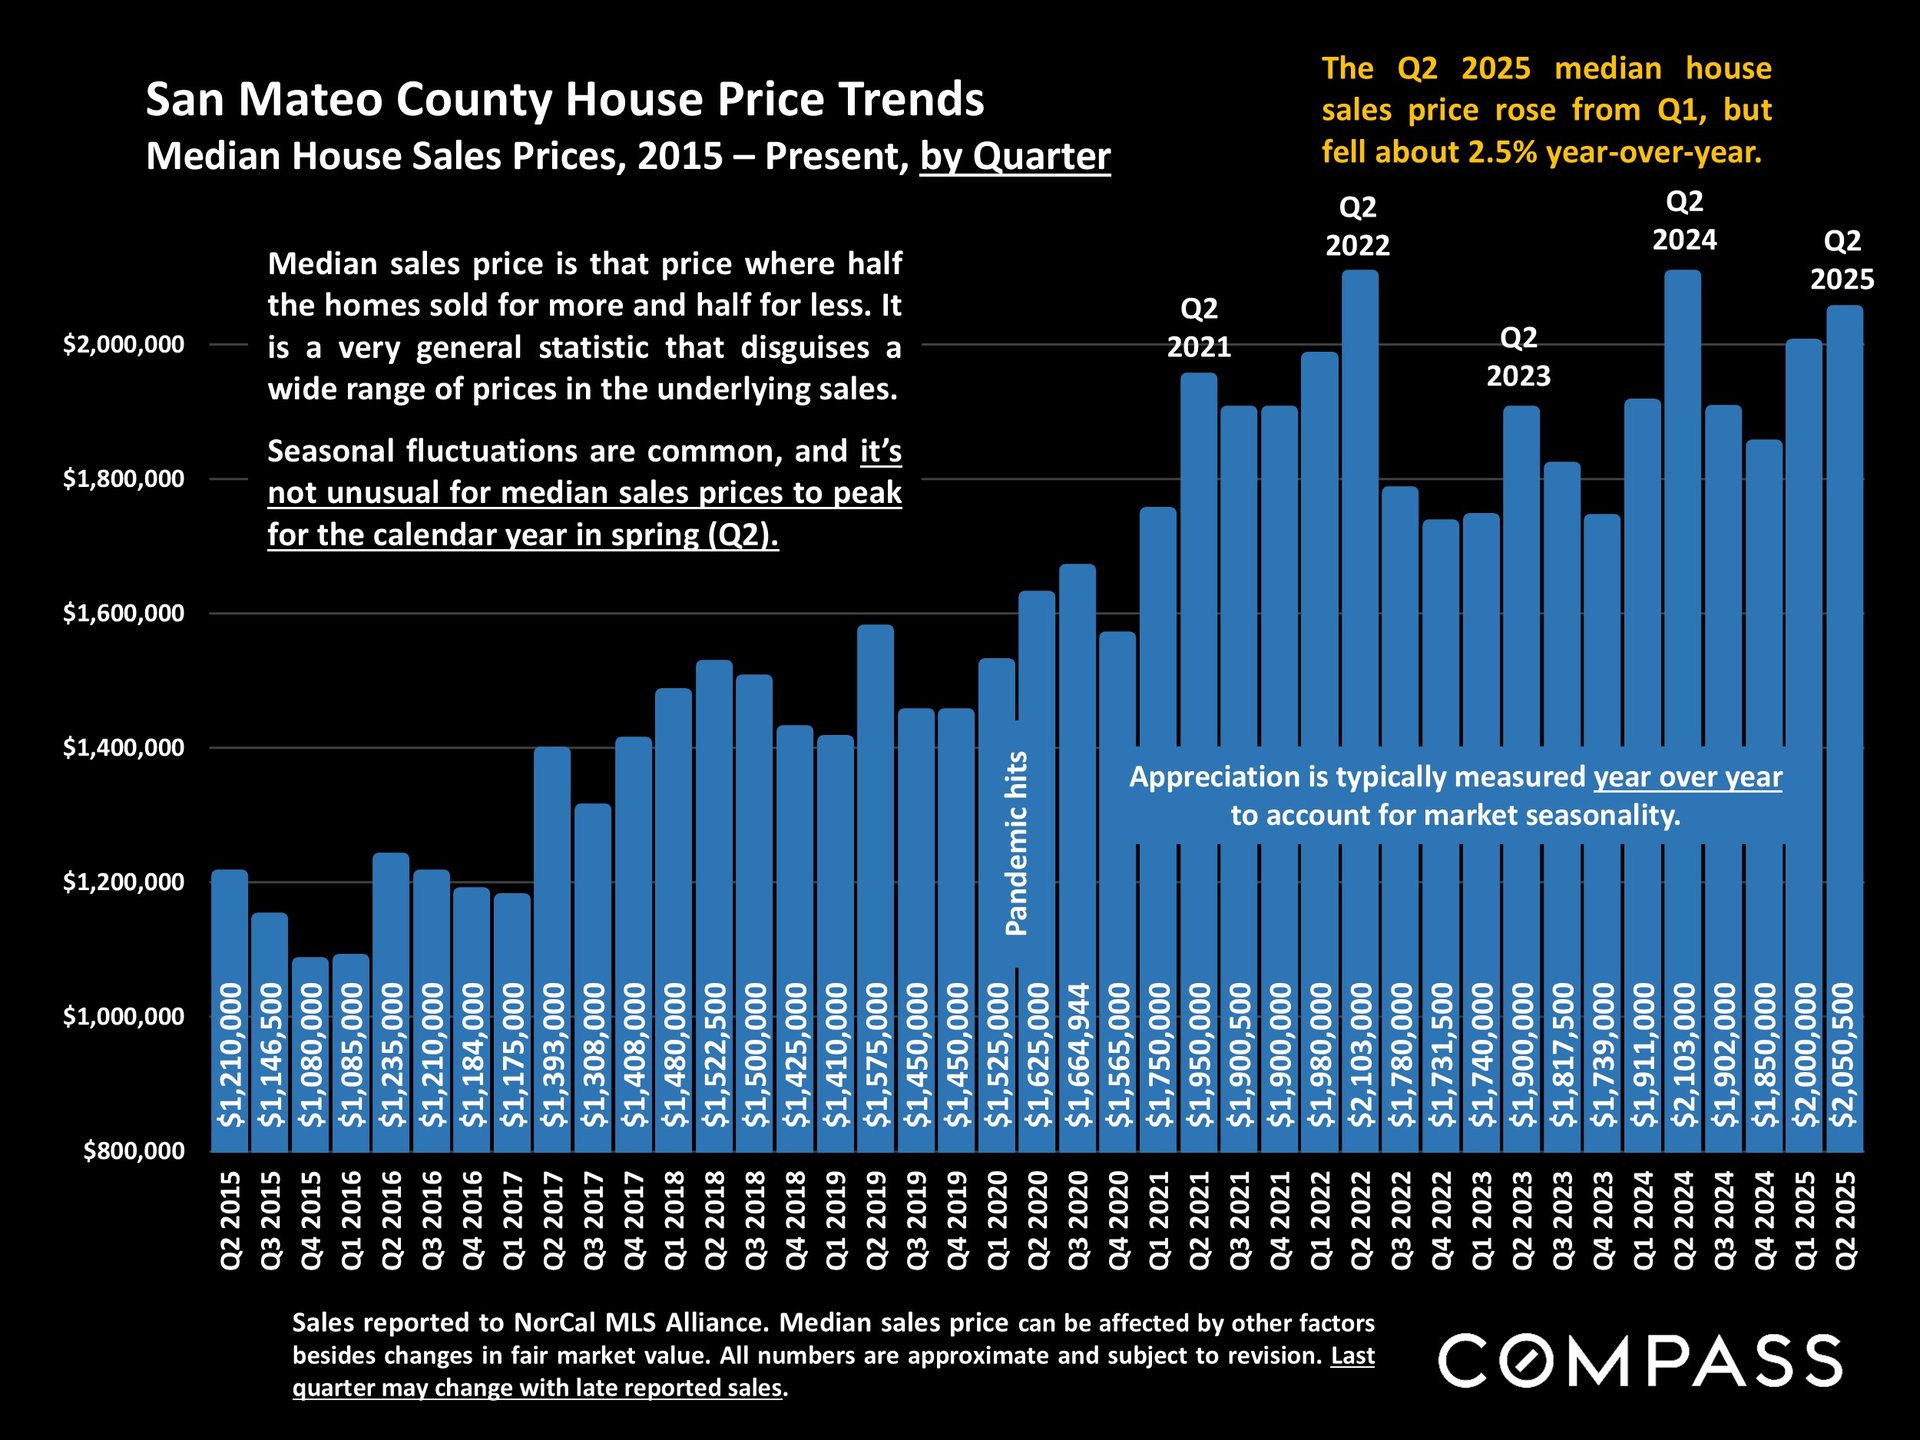
San Mateo County quarterly median house prices, 2015–2025; Q2 2025 reached $2.05 million, down about 2.5% year over year.


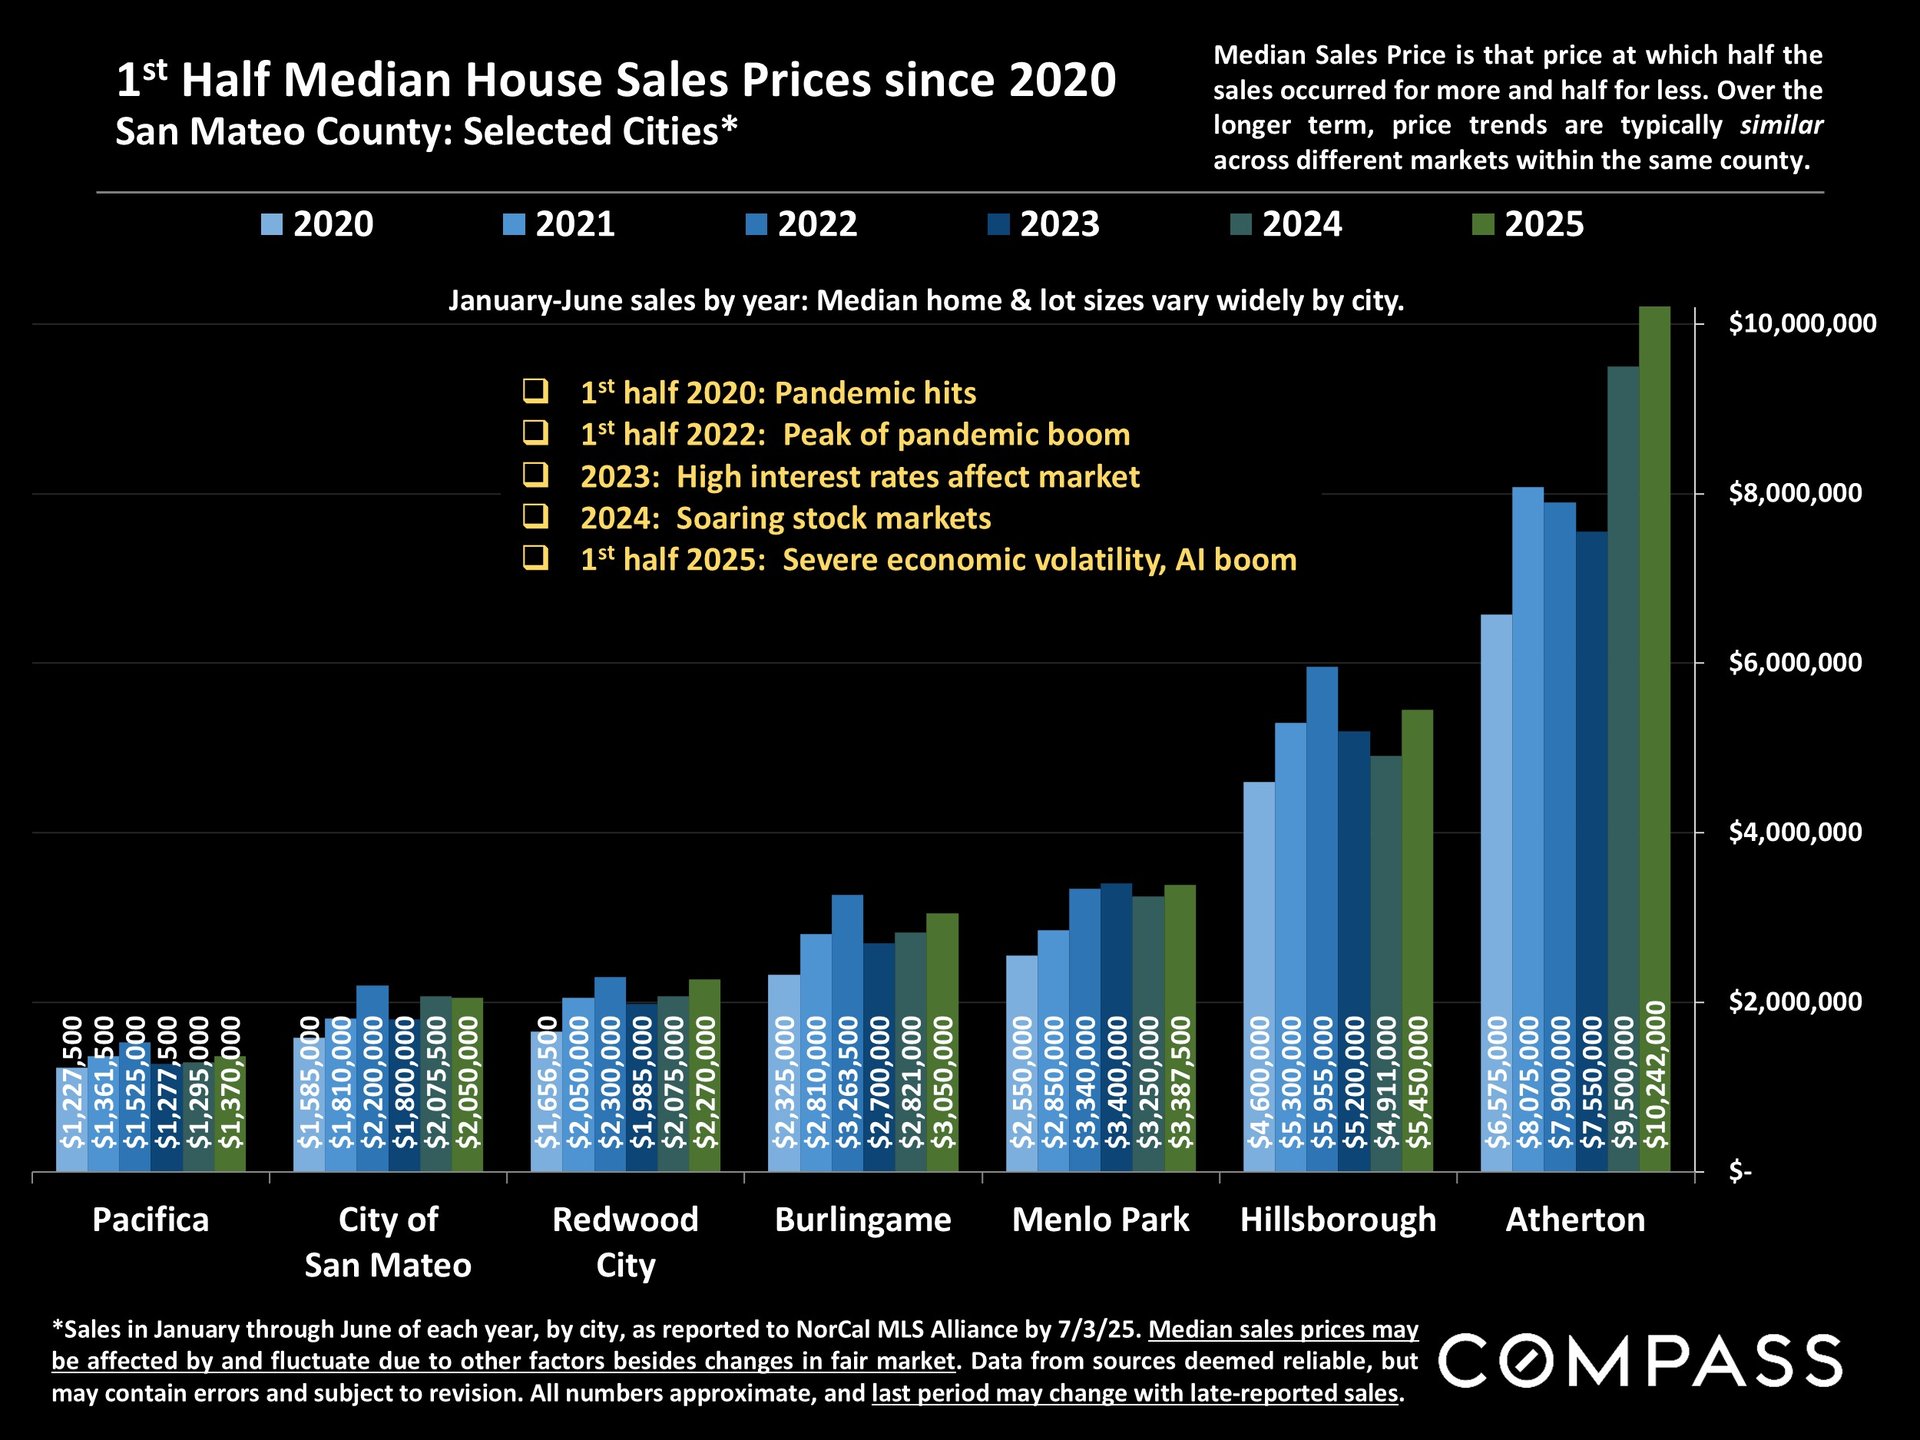
Chart of first-half median home sale prices from 2020–2025 across seven San Mateo County cities.


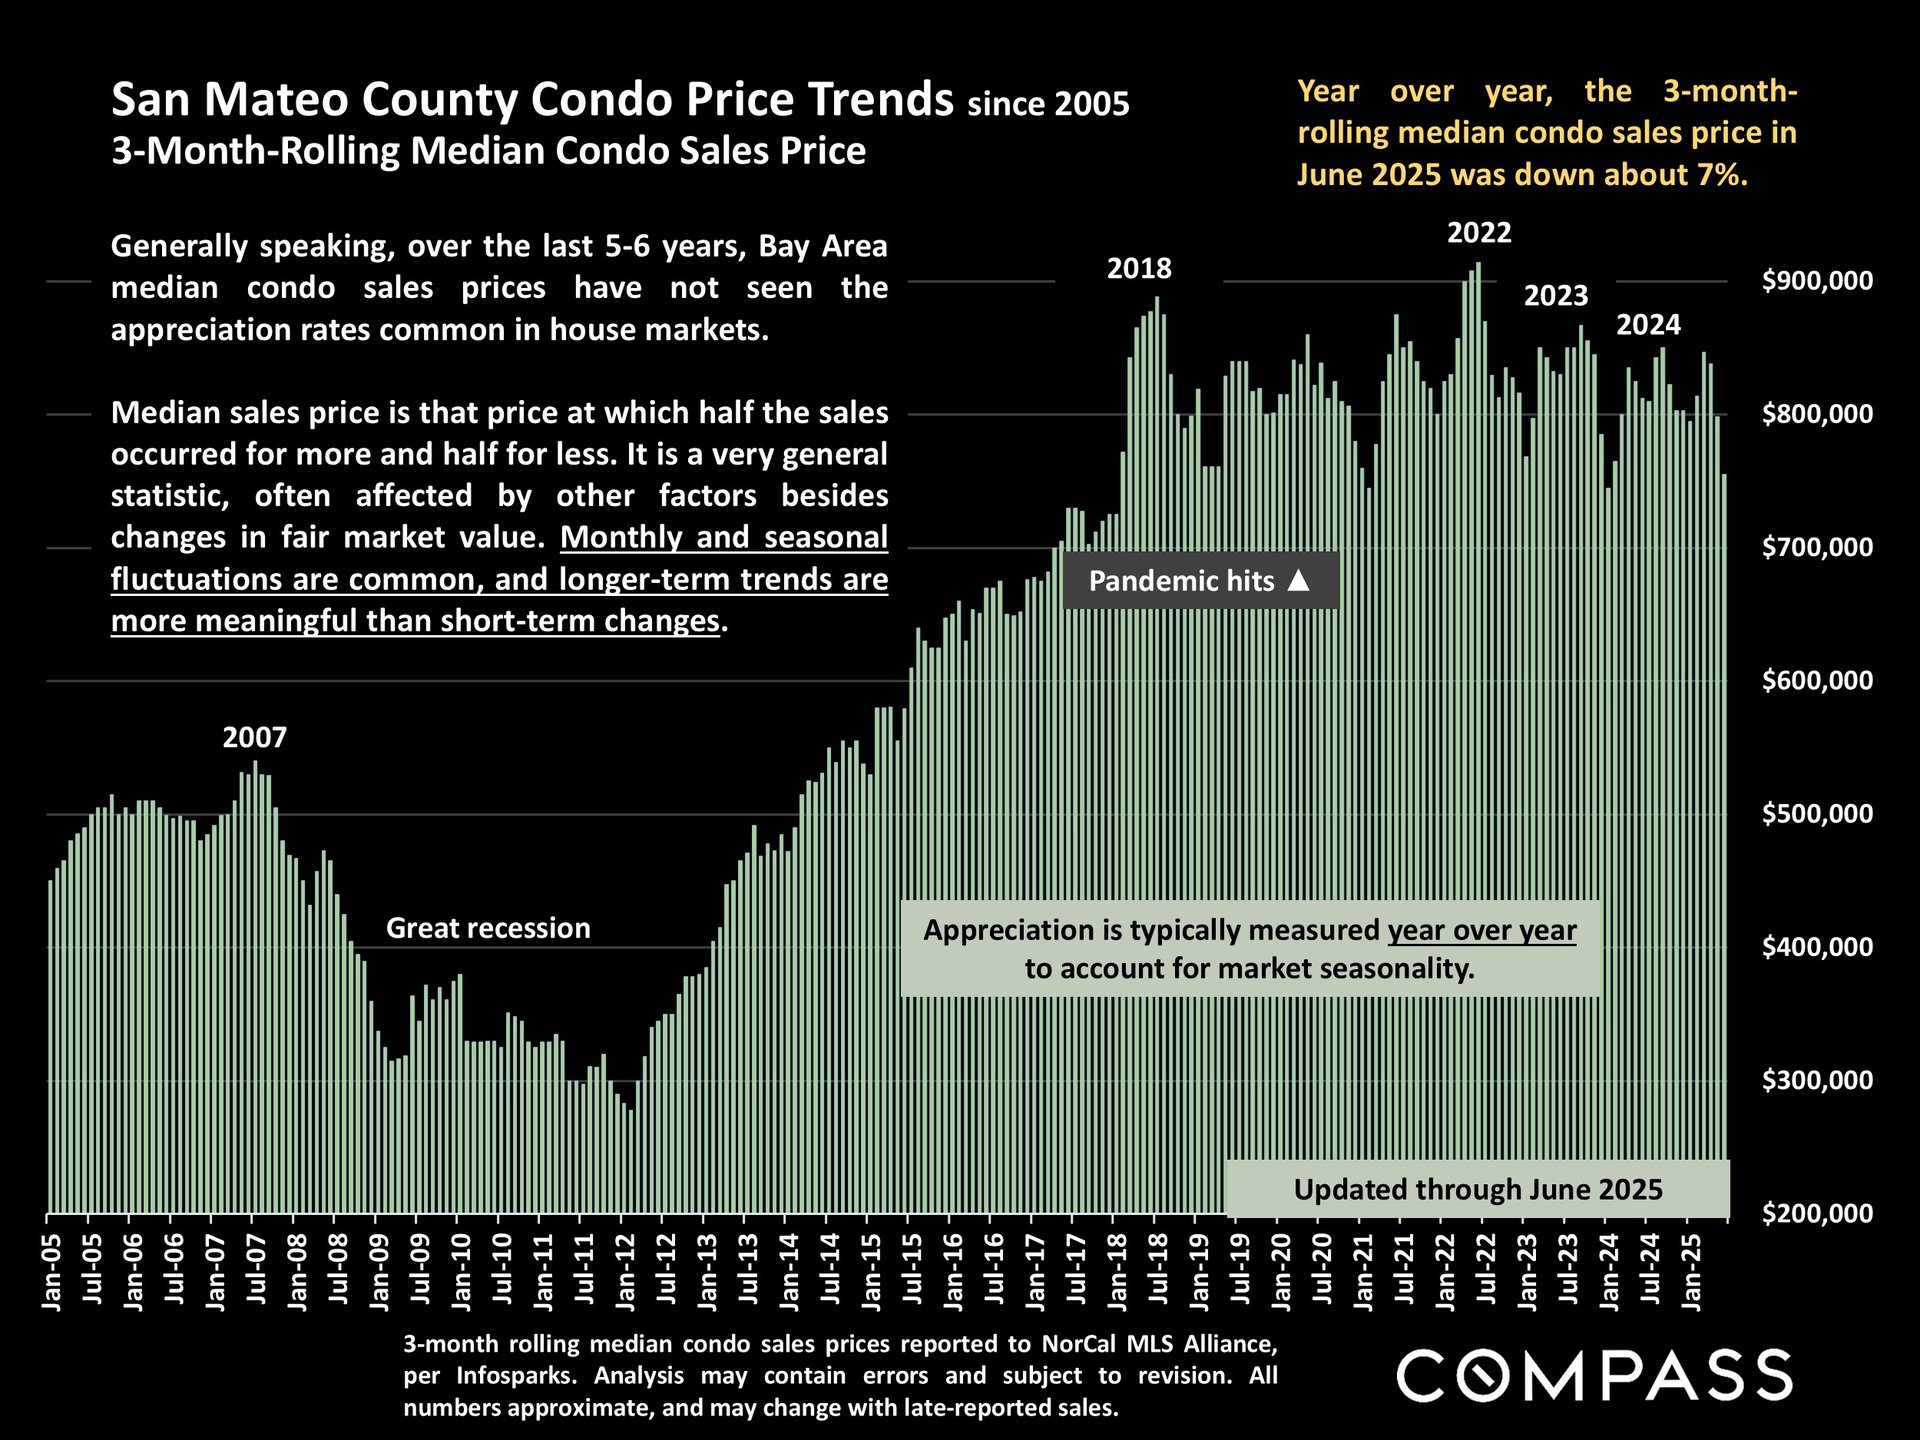
San Mateo County condo price trend chart, 2005–June 2025, showing June prices down about 7% year over year.


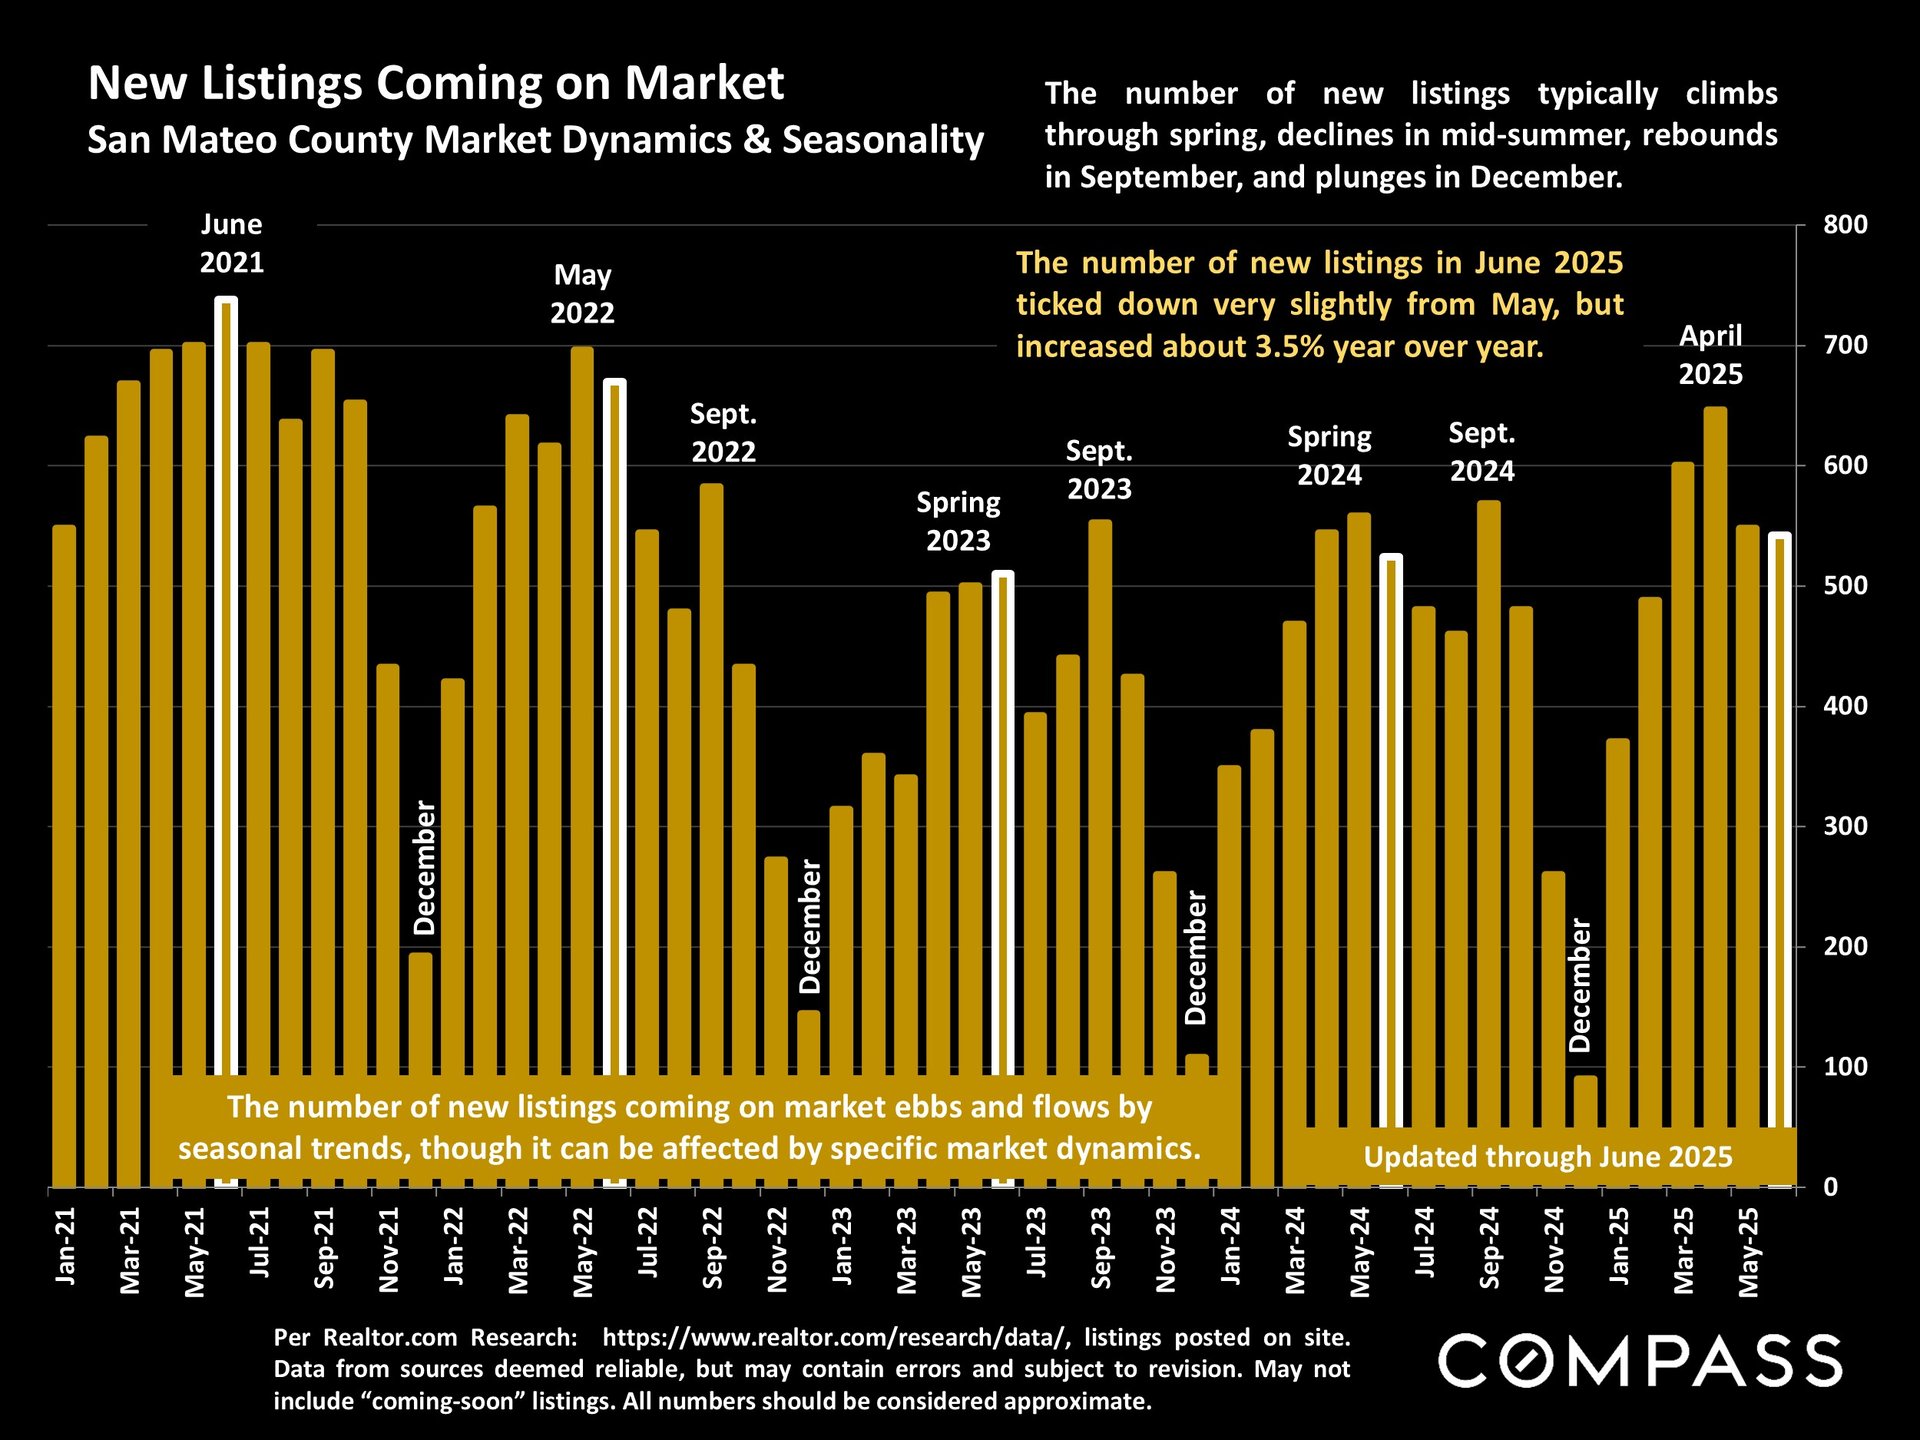
San Mateo County new listings chart showing monthly seasonality from January 2021 through June 2025.


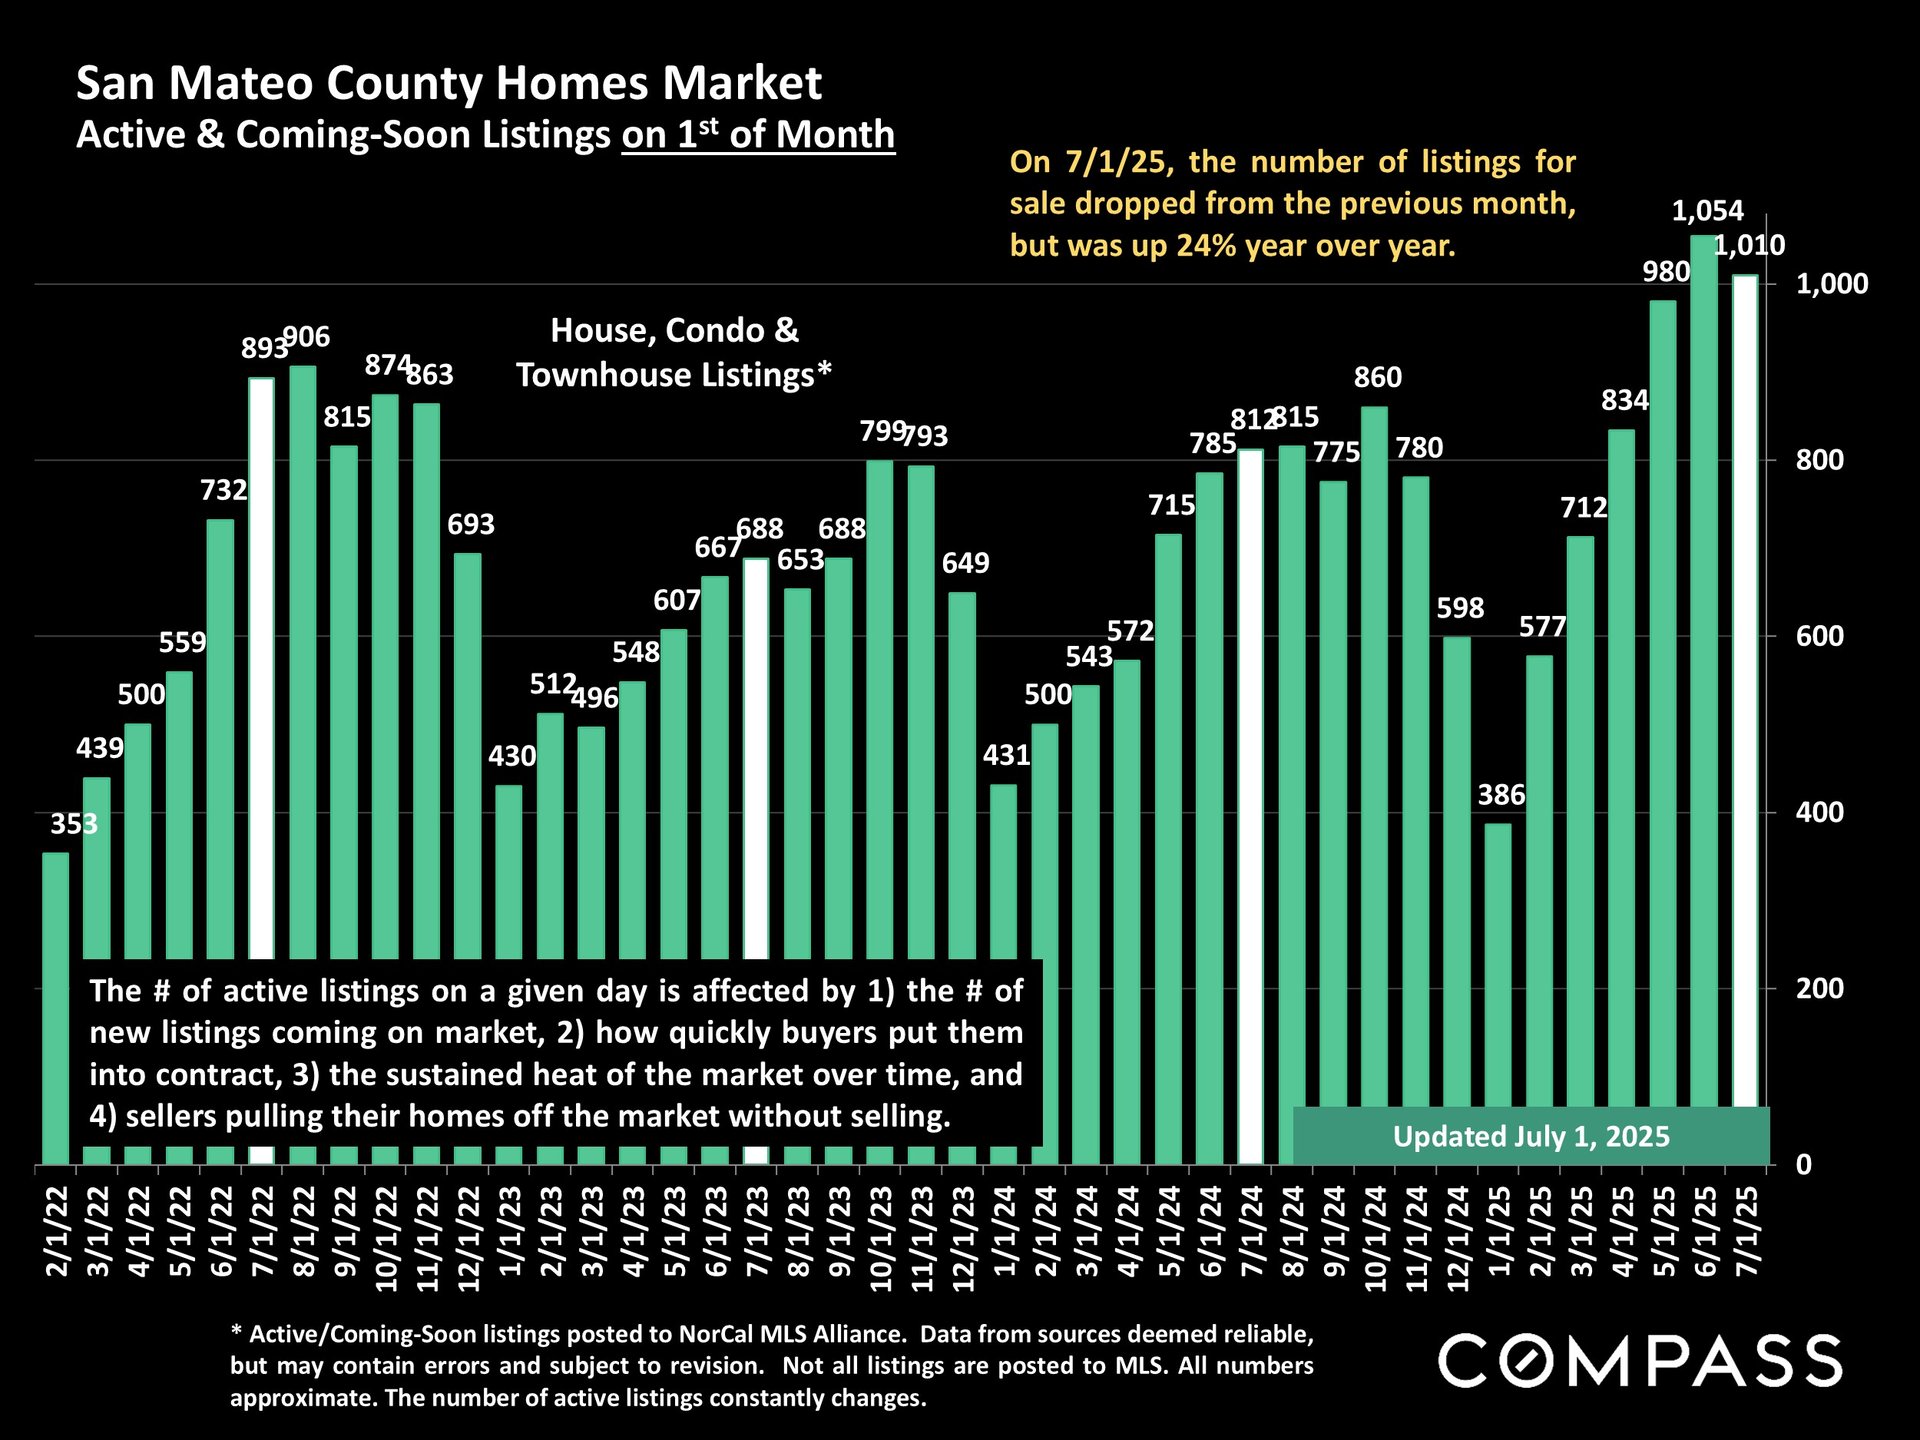
Bar chart of San Mateo County home listings from 2022 to July 2025; July 2025 shows 1,010 listings.


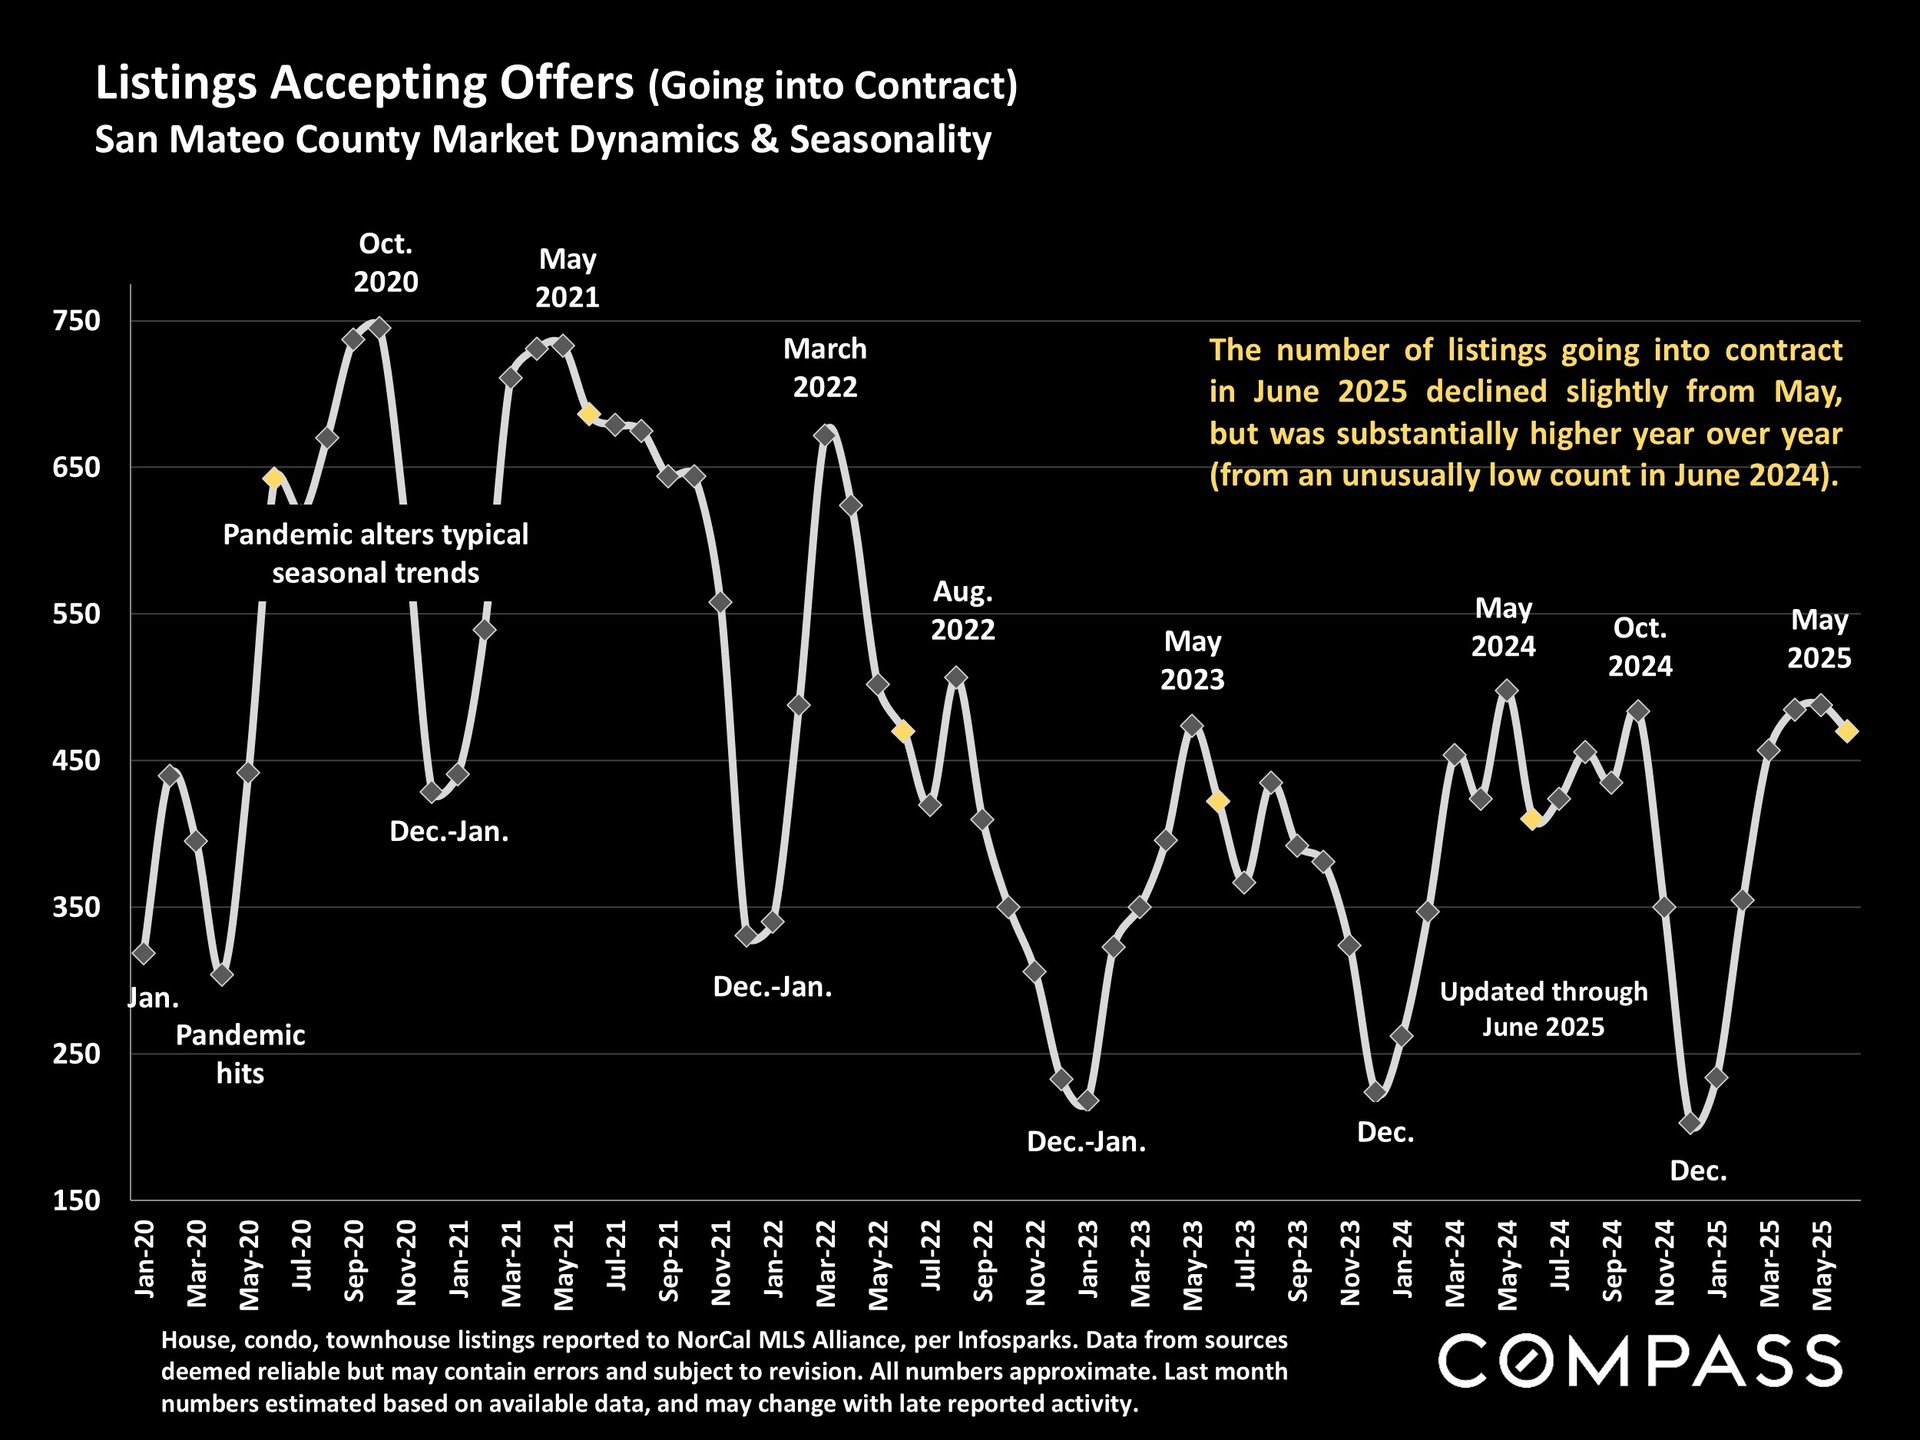
San Mateo County chart of listings going into contract, January 2020 to June 2025, with seasonal fluctuations and June 2025 update.


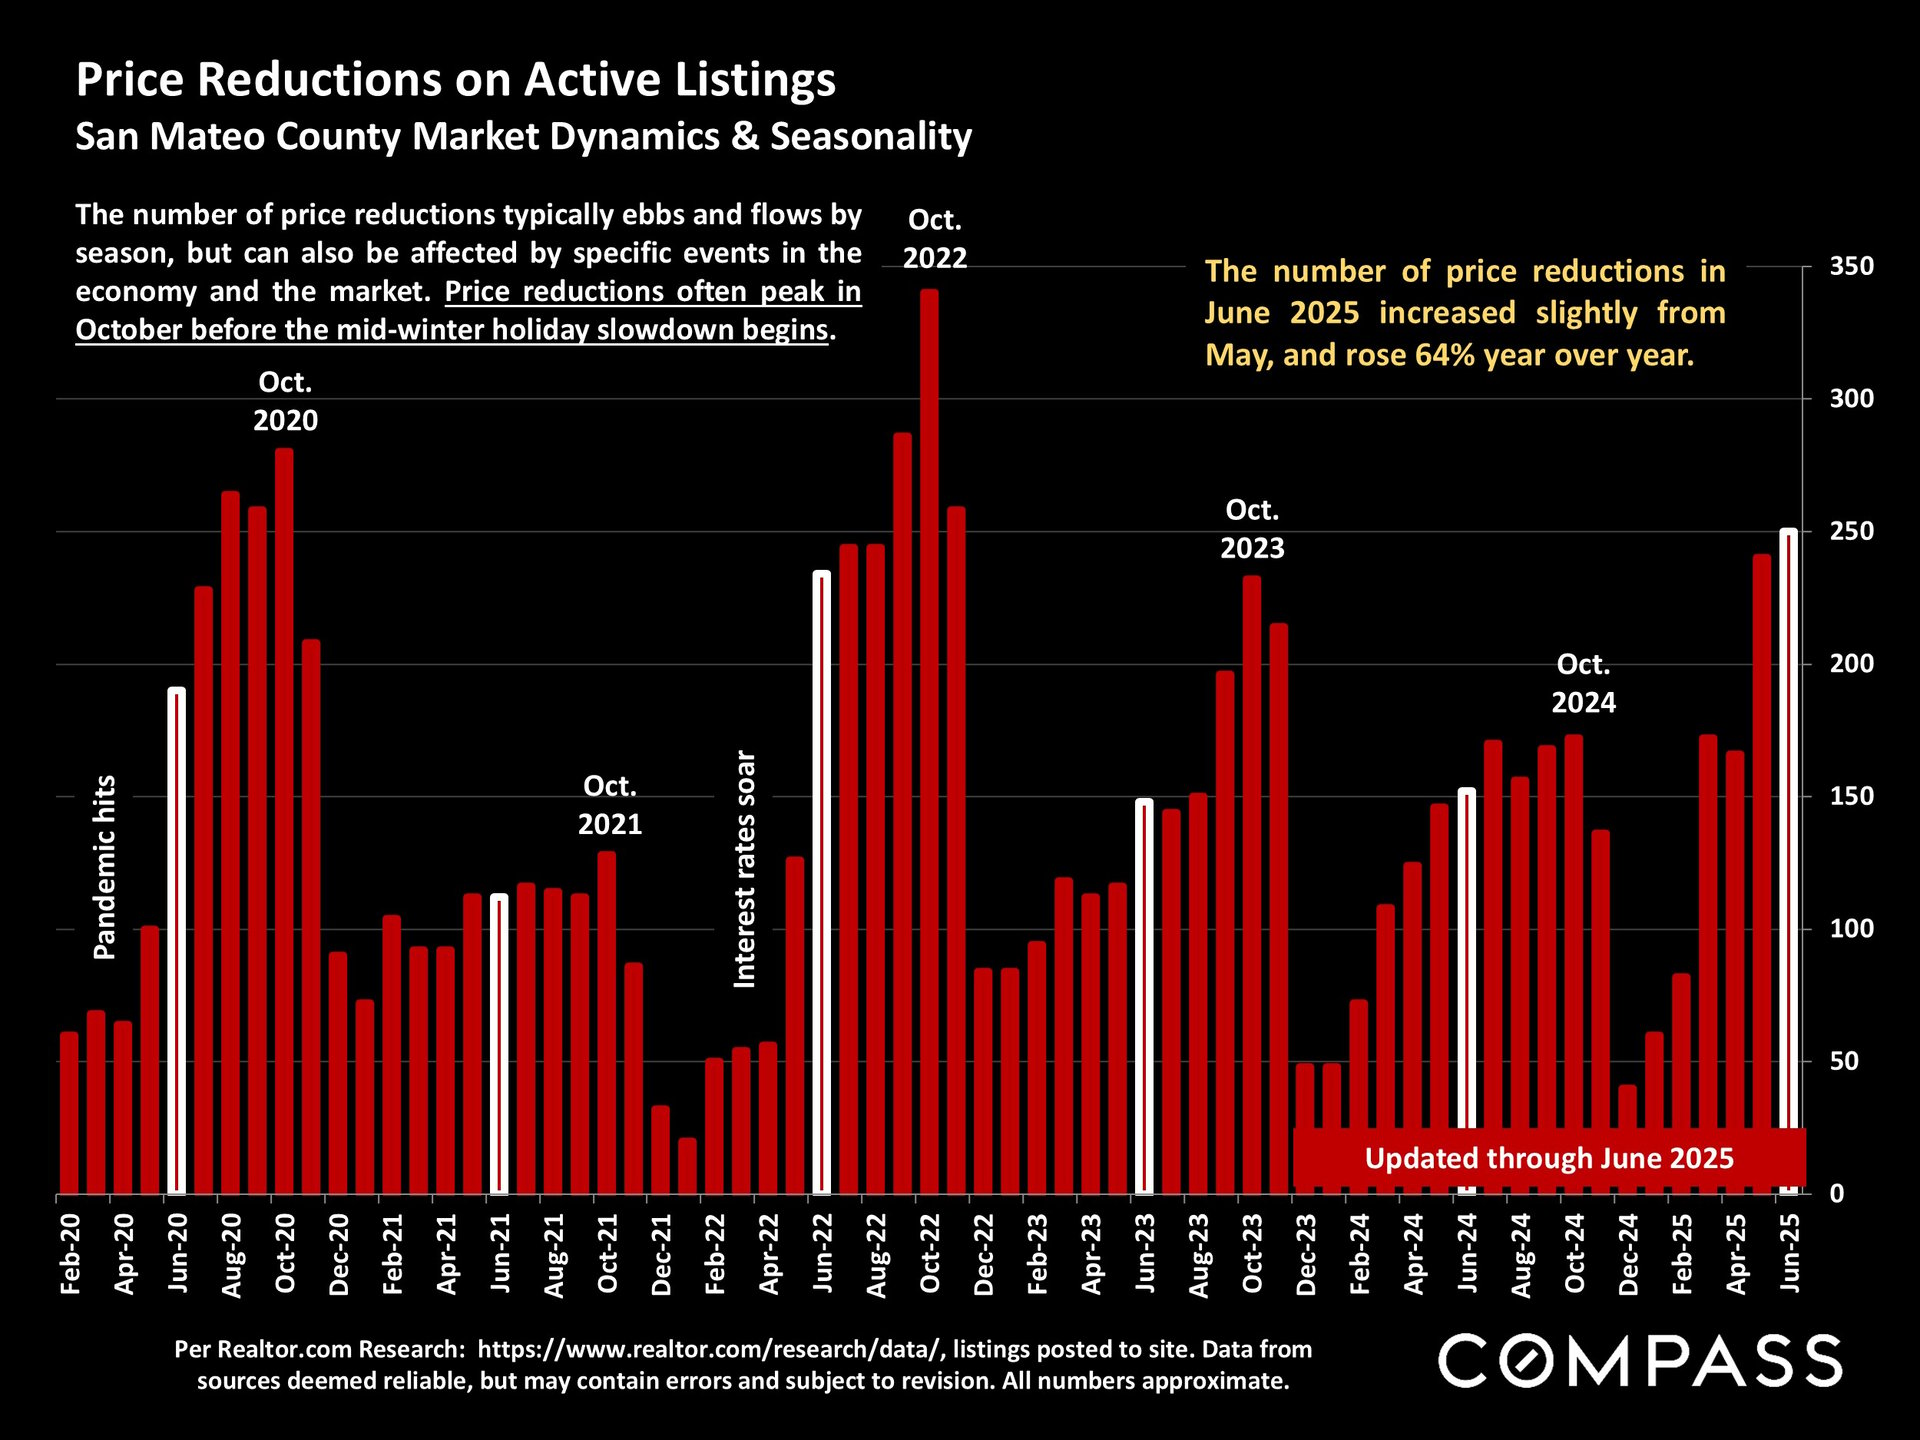
San Mateo County price-reduction chart, with monthly bars from 2020 to June 2025 and a 64% year-over-year increase noted.


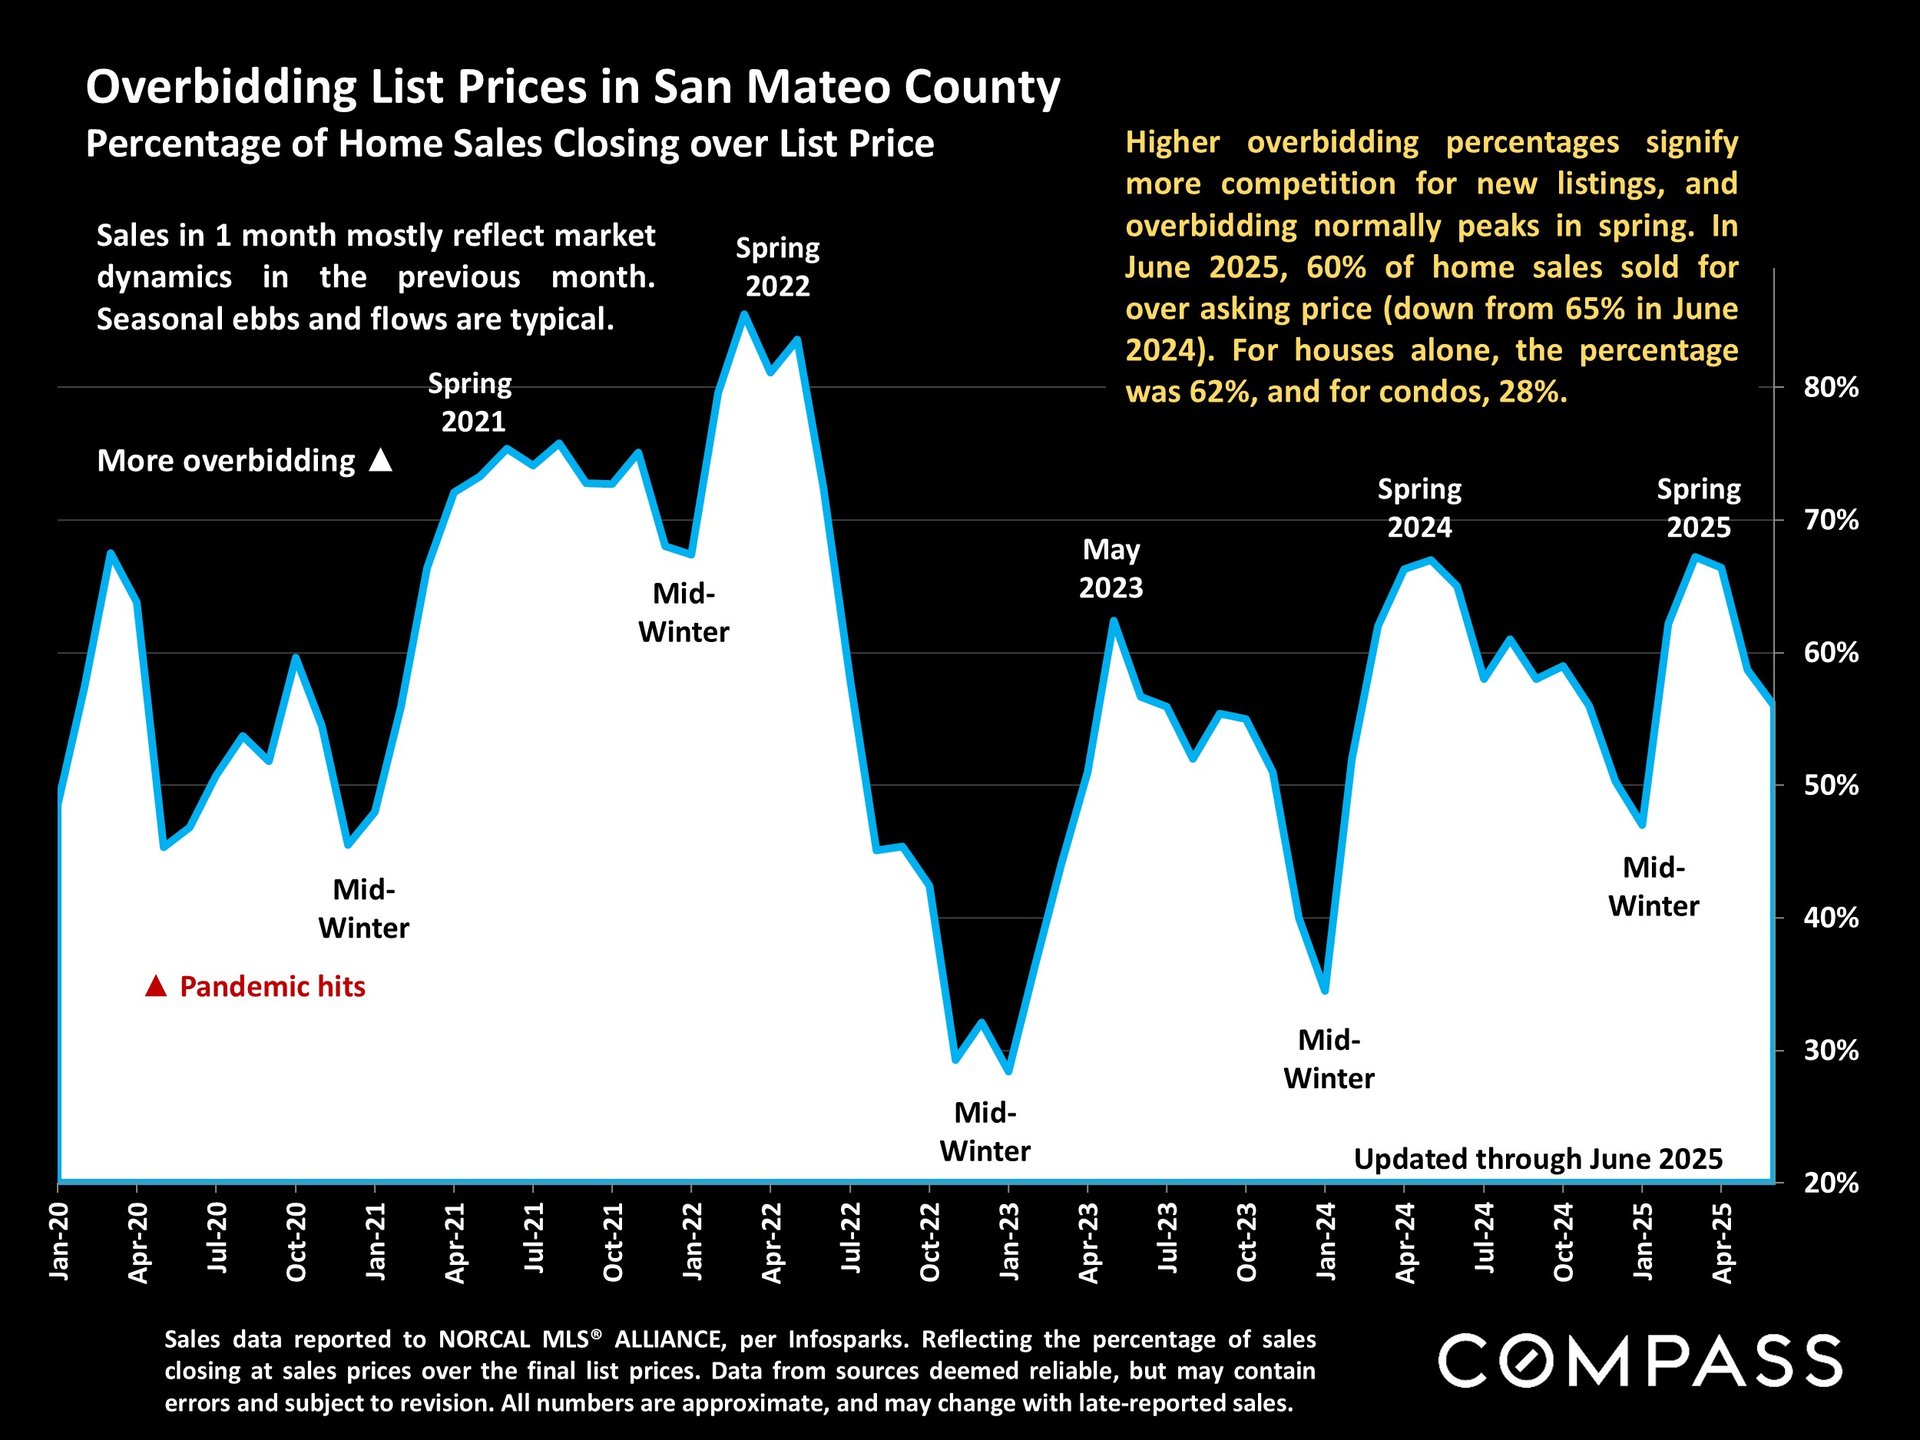
San Mateo County chart of home sales closing over list price, updated through June 2025.


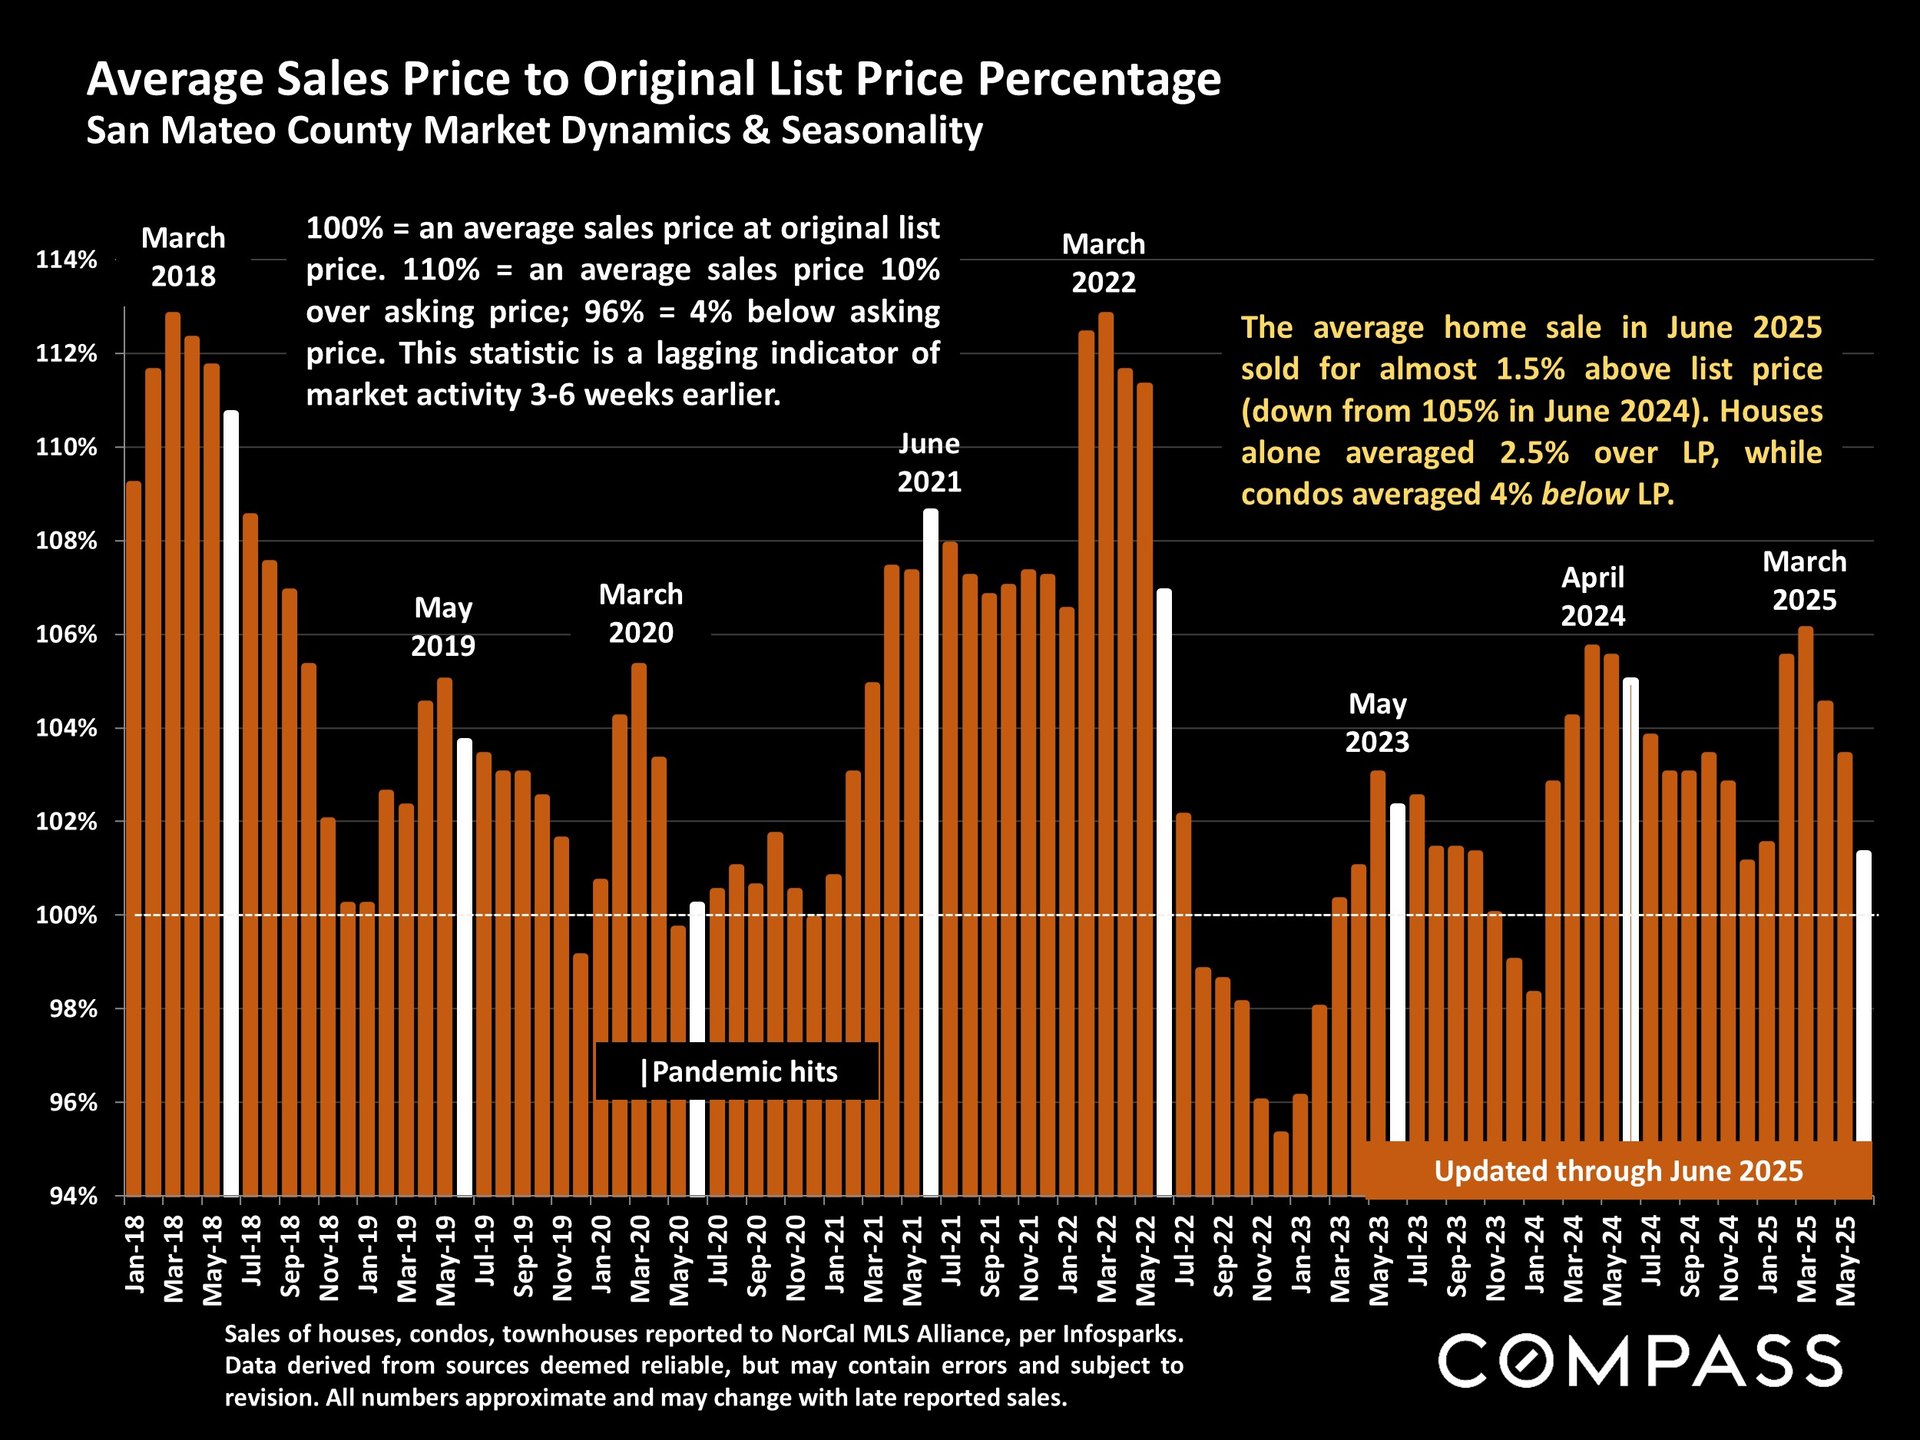
San Mateo County chart of home sale prices versus original list prices, updated through June 2025.


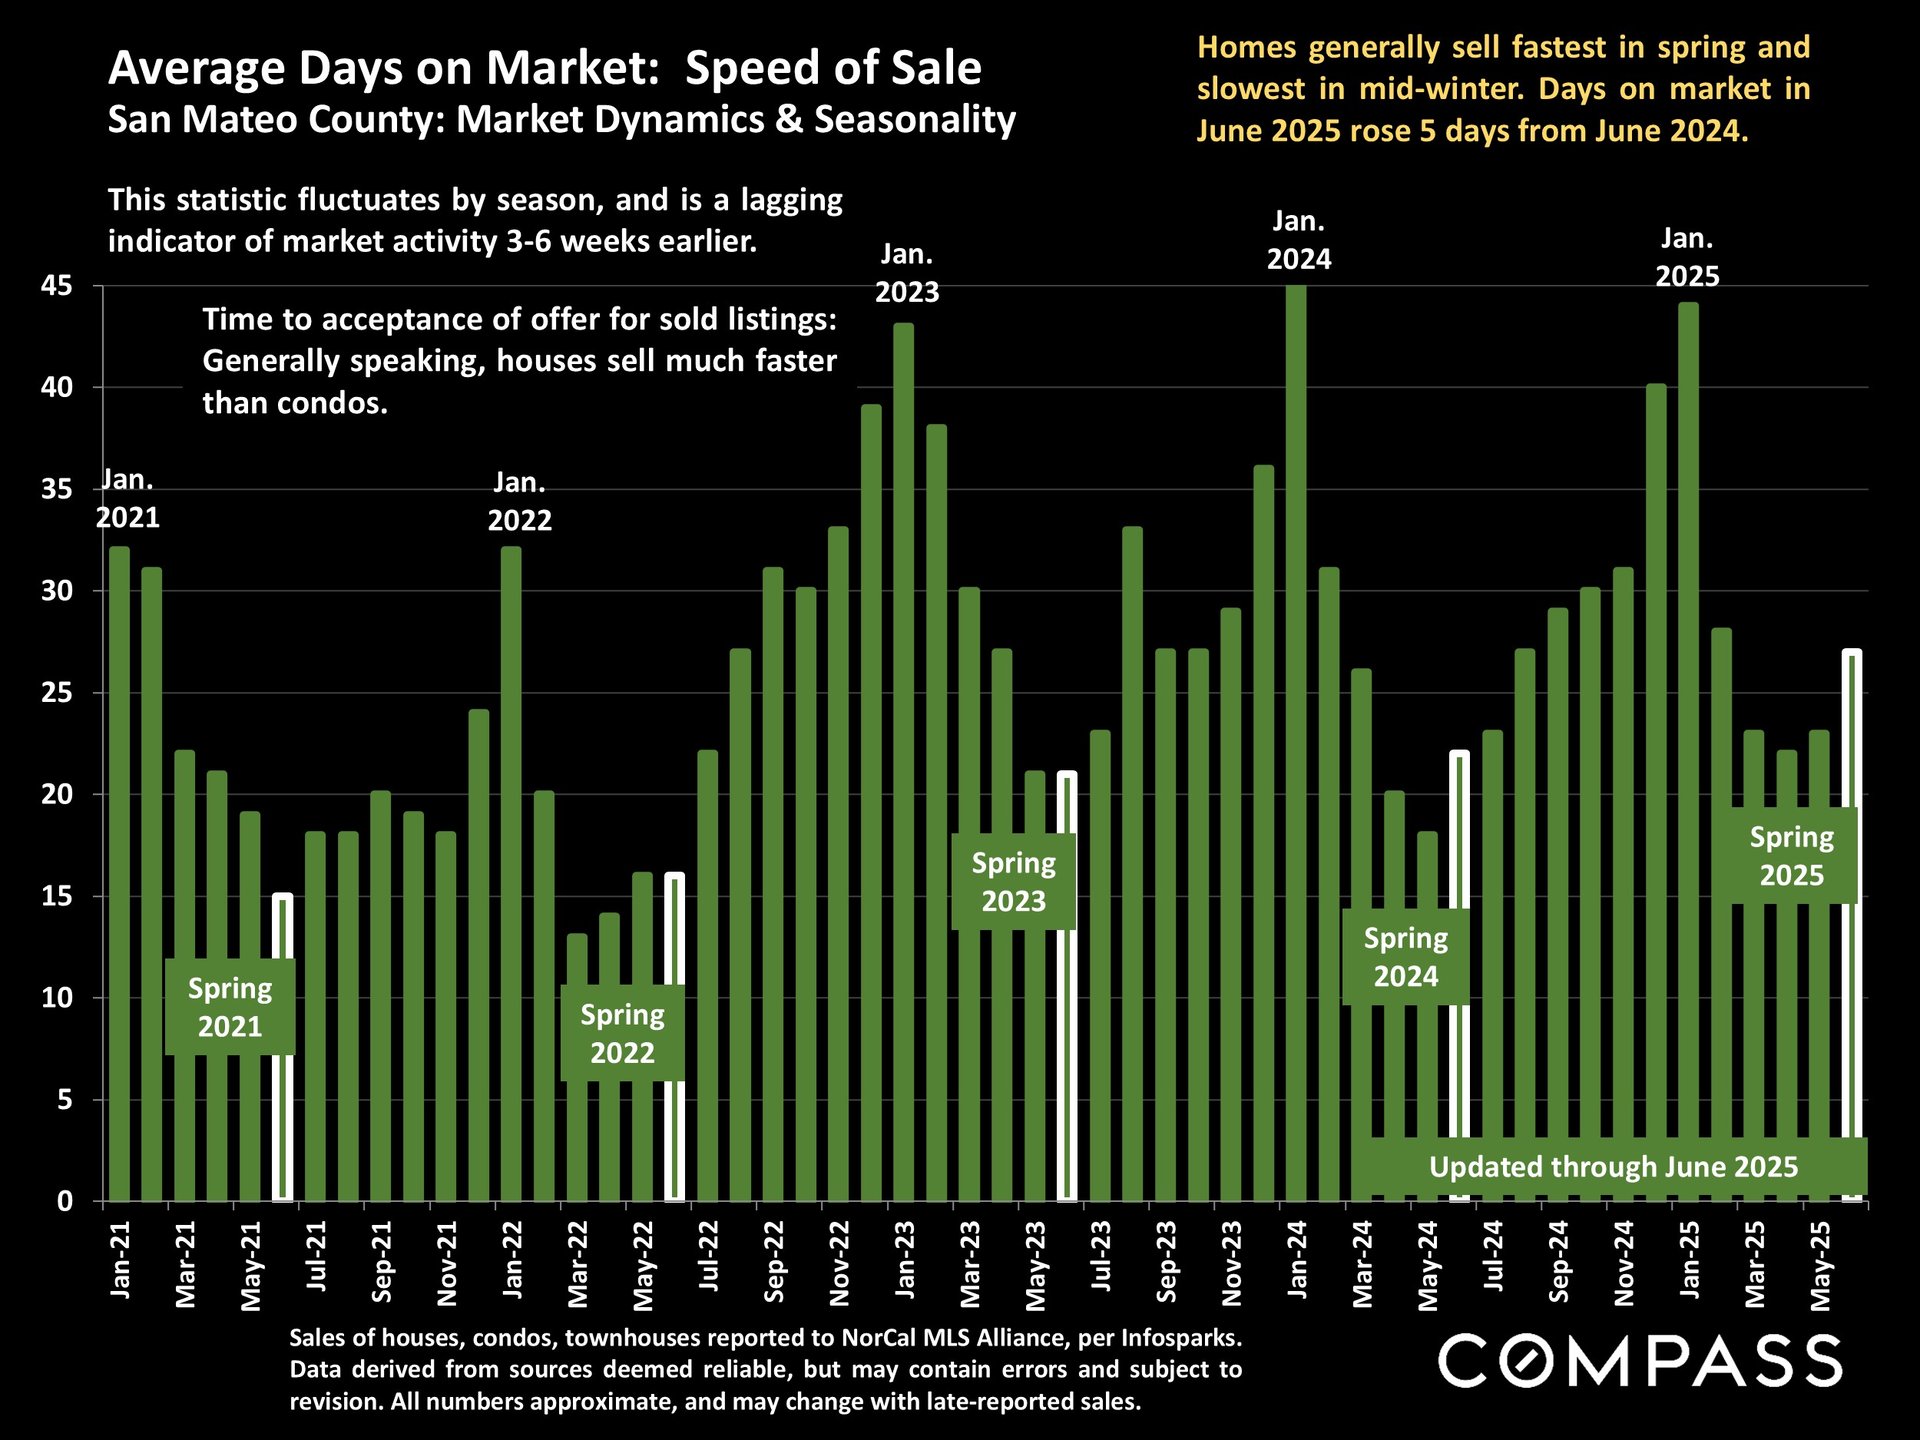
San Mateo County days-on-market chart, showing monthly trends from 2021 to 2025 and spring season markers.


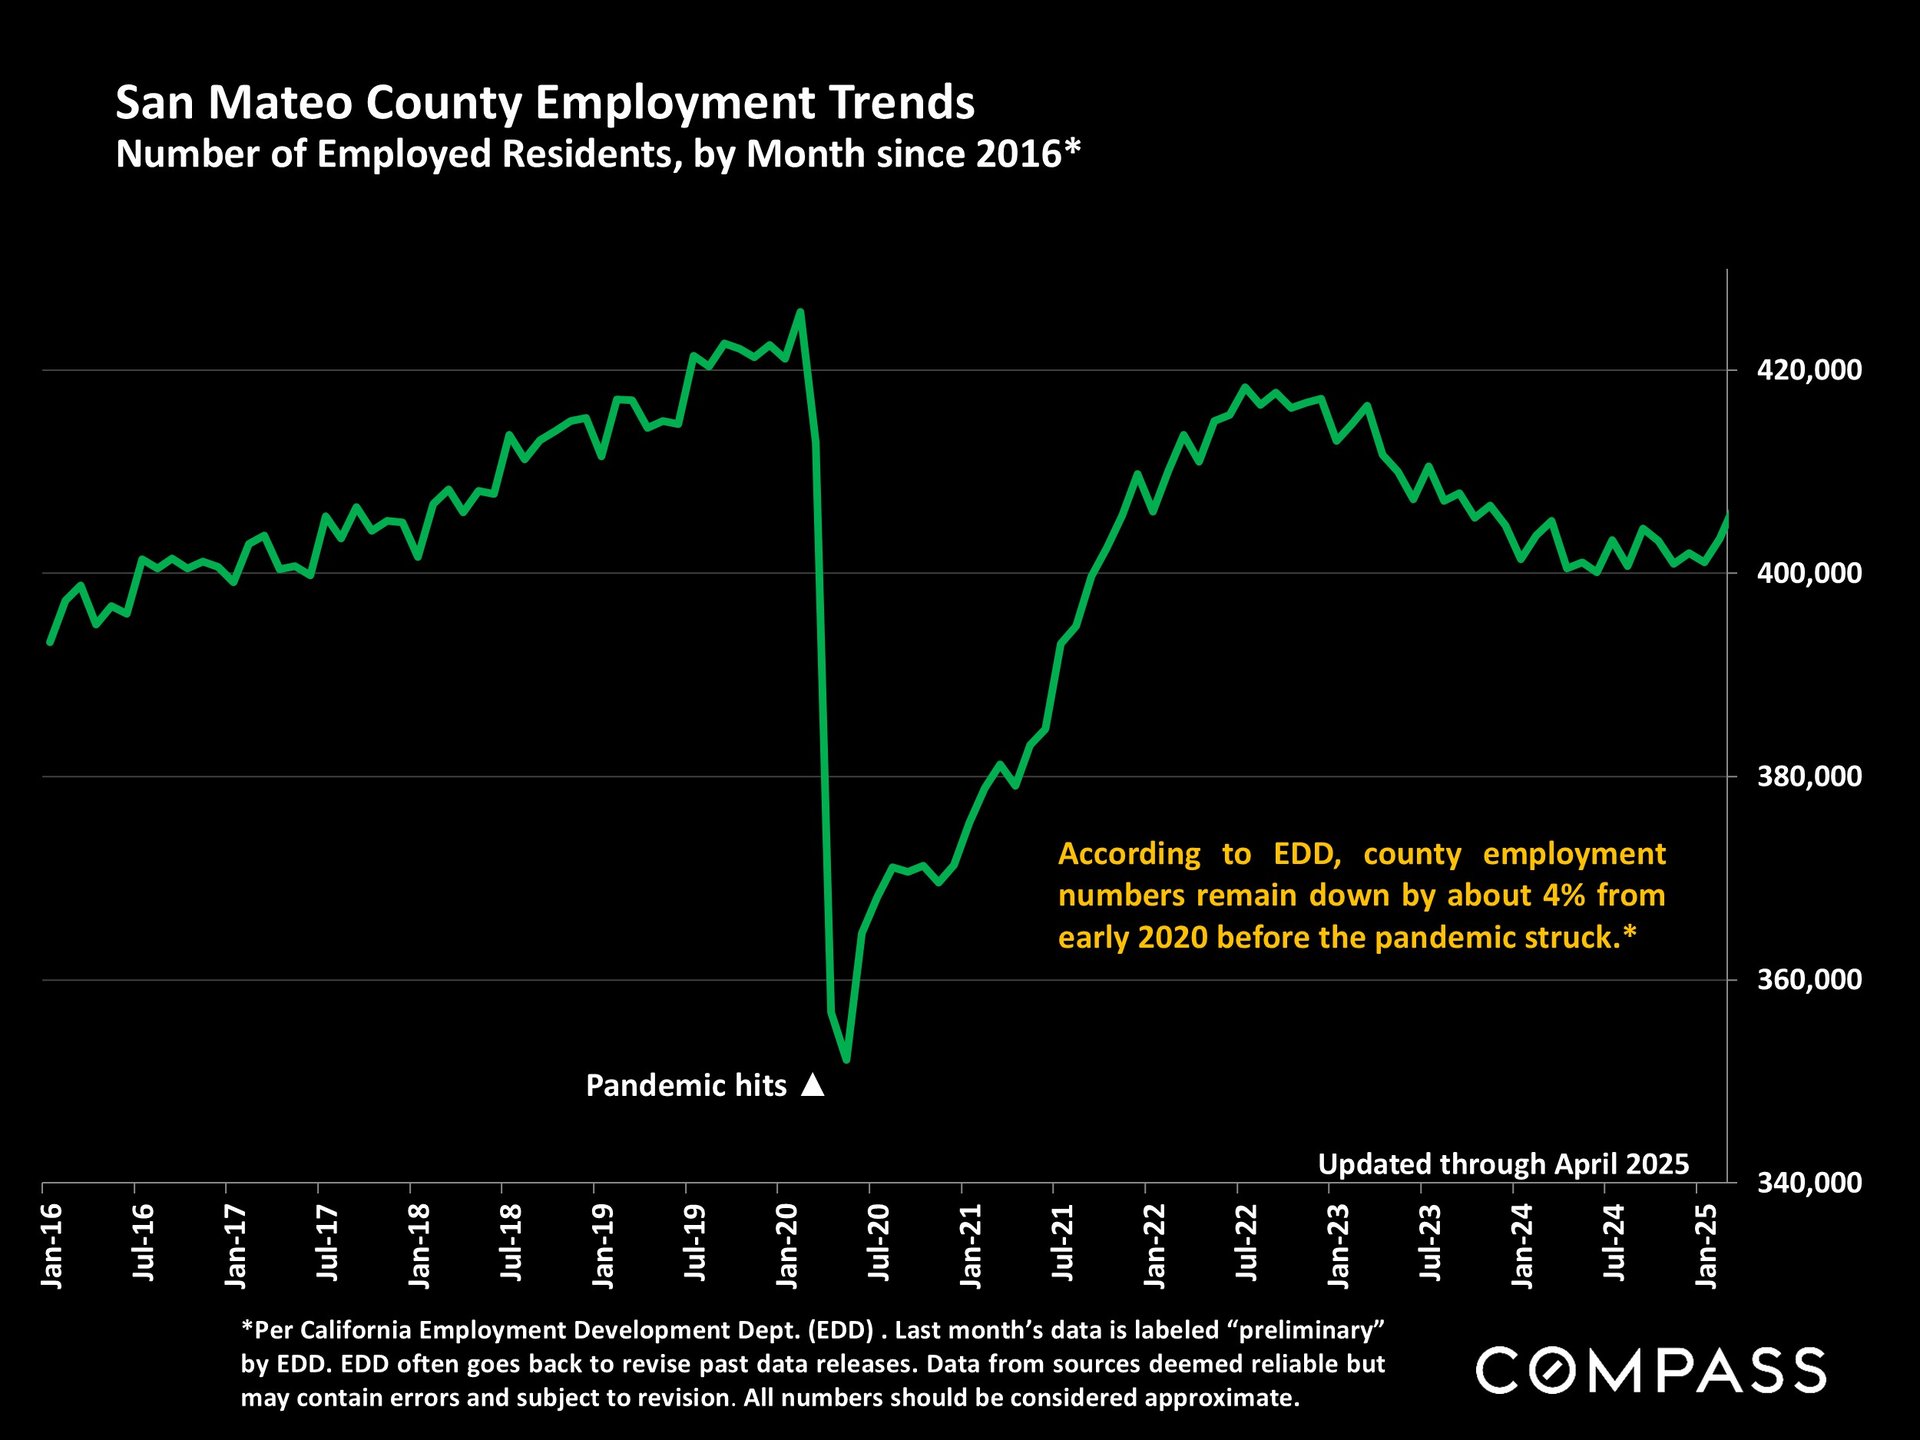
Chart of San Mateo County employment from 2016 to April 2025, showing the pandemic drop and subsequent recovery.


Work With Us

We pride ourselves in providing personalized solutions that bring our clients closer to their dream properties and enhance their long-term wealth.
Contact Us

Follow Us On Instagram